Correlating Finite Element Stress Fields with Triaxial Rosette Strain Telemetry Data
Correlating FEA stress fields with triaxial strain rosette telemetry requires spatial area-integration, thermal apparent strain compensation, and orthotropic tensor transformations.


Transform
Plane Stress Conversion for Rectangular Rosettes
Raw strain gauge channels record dimensional variation along isolated physical axes. Translating those discrete electrical voltage shifts into a complete in-plane surface stress tensor demands strict mathematical conversion through coordinate transformation equations. Physical printed circuit board assemblies subjected to mechanical assembly forces, thermal expansion, or dynamic shock experience multi-axial surface strains.
Telemetry packages employing rectangular triaxial rosettes capture strain amplitudes across three discrete grid angles: zero degrees, forty-five degrees, and ninety degrees. The resulting strain vector defines the local strain state on the component surface under a plane stress assumption, where normal and shear stresses acting perpendicular to the board surface remain zero.
The mathematical transformation converts raw strain readings into principal strains and orientation vectors. Let raw telemetry output channels yield normal strain values of epsilon zero, epsilon forty-five, and epsilon ninety. The in-plane shear strain relative to the zero-degree sensor axis derives directly from the geometry of the rosette layout:
gamma xy = 2 epsilon forty-five – (epsilon zero + epsilon ninety)
With normal strains and shear strain established, the algebraic center and radius of Mohr’s circle of strain yield the maximum and minimum principal strains, designated as epsilon one and epsilon two:
epsilon center = (epsilon zero + epsilon ninety) / 2
strain radius = sqrt(((epsilon zero – epsilon forty-five)^2 + (epsilon forty-five – epsilon ninety)^2)) / sqrt(2)
epsilon one = epsilon center + strain radius
epsilon two = epsilon center – strain radius
The principal angle phi, measured counterclockwise from the zero-degree physical gauge axis to the direction of maximum principal strain, follows the arctangent relationship:
tan(2 phi) = gamma xy / (epsilon zero – epsilon ninety)
Strain gauges measure length changes. Consider an active telemetry measurement on a 1.6 millimeter FR-4 printed circuit board during board-level mechanical flexure testing. The zero-degree gauge reports +650 microstrain, the forty-five-degree gauge reports +200 microstrain, and the ninety-degree gauge reports -400 microstrain.
Evaluating these telemetry inputs yields a strain center of +125 microstrain and a shear strain value of +500 microstrain. The calculated strain radius equals +530.3 microstrain. Consequently, maximum principal strain epsilon one equals +655.3 microstrain, while minimum principal strain epsilon two equals -405.3 microstrain.
The principal strain direction aligns at an angle of +4.07 degrees relative to the primary sensor axis.
Surface strain measurements on 1.6 millimeter FR-4 laminate exhibit up to twelve percent shear stress variance when orthotropic board elasticity replaces isotropic assumptions.
Elasticity Matrix Mechanics and Anisotropic Board Substrates
Printed circuit board laminates display distinct mechanical stiffness values along warp and weft fiber directions. Standard isotropic strain-to-stress conversions introduce baseline calculation errors when applied to glass-reinforced epoxy substrates like FR-4 or high-frequency PTFE laminates. Converting principal strains to in-plane principal stresses demands applying the orthotropic compliance matrix specific to the board layer construction.
For an isotropic approximation, Young’s modulus E and Poisson’s ratio nu govern the conversion through simplified Hooke’s law equations:
sigma one = (E / (1 – nu^2)) (epsilon one + nu epsilon two)
sigma two = (E / (1 – nu^2)) (epsilon two + nu epsilon one)
Applying an isotropic modulus of 22 gigapascals and a Poisson’s ratio of 0.18 to the calculated principal strains (+655.3 and -405.3 microstrain) produces maximum principal stress sigma one of 13.24 megapascals and minimum principal stress sigma two of -6.53 megapascals. Equivalent von Mises stress sigma vM evaluates structural intensity across multi-axial stress states:
sigma vM = sqrt(sigma one^2 – sigma one sigma two + sigma two^2)
For this telemetry sample, calculated von Mises stress lands at 17.45 megapascals. Copper traces yield early. Substituting full orthotropic constitutive matrices accounts for warp-direction Young’s modulus E x of 25 gigapascals, weft-direction modulus E y of 21 gigapascals, in-plane shear modulus G xy of 4.5 gigapascals, and major Poisson’s ratio nu xy of 0.16.
Under orthotropic transformations, peak calculated principal stress rises to 14.82 megapascals when sensor axes align off-axis from glass bundle fiber orientations. Ignoring substrate directional stiffness misaligns finite element model predicted stress vectors with physical strain gauge telemetry readings.
- In-plane normal strain vector captures dimensional displacement along physical zero and ninety degree gauge legs during mechanical loading.
- Resolved shear strain component determines angular distortion across the diagonal gauge element to establish full tensor field orientation.
- Orthotropic elasticity tensor maps strain vectors to internal stresses using direction-specific elastic moduli across woven substrate matrices.
- Von Mises equivalent stress scalar consolidates principal stress components into a single magnitude for ductile yield comparison.
Aligning sensor axes with primary PCB reinforcement fibers minimizes calculation errors caused by substrate shear coupling.


Mesh
Spatial Averaging across Finite Element Volume Components
Nodal outputs from numerical simulations calculate strain values at localized geometric points. Physical strain gauges aggregate mechanical deformation over an expansive foil surface. A triaxial rosette grid measuring 0.8 millimeters by 0.5 millimeters yields an analog signal representing the integral mean strain across that entire surface area.
Comparing a single peak finite element nodal strain value directly against physical rosette telemetry introduces structural correlation bias. Geometric stress concentration features adjacent to gauge installation points create steep spatial strain gradients that skew raw point-to-point comparisons.
Nodal points lack physical width. Converting finite element simulation fields into telemetric strain gauge equivalents demands mathematical spatial integration across element faces matching the sensor geometry. The average numerical strain value across a designated sensor foil area derives from surface integration across the underlying element domain:
epsilon average = (1 / A gauge) double_integral (epsilon numerical (x, y) dx dy)
When element formulations employ quadratic serendipity or linear isoparametric shape functions, strain integration evaluates Gaussian quadrature points located within element boundaries overlapping the sensor footprint. Comparing non-integrated peak FEA point strains against physical gauge outputs leads to overestimating numerical model error near stiffener brackets and large ball grid array component corners.

Sub-Modelling Techniques near High Stress Gradients
Geometric discontinuities like component pads generate steep localized strain fields. Coarse global finite element meshes fail to capture local strain gradients, under-predicting stress concentrations around solder joints and plated through-holes. Sub-modelling extracts global displacement fields from coarse structural simulations and applies those values as boundary conditions onto highly refined local meshes surrounding rosette installation sites.
Local element edge lengths near sensor locations must scale down to one-fourth of the gauge grid width to achieve numerical convergence.
| Mesh Element Size (mm) | Integration Method | Peak Point Strain (με) | Area-Averaged Strain (με) | Telemetry Deviation (%) |
|---|---|---|---|---|
| 1.50 | Single Node Peak | 420 | 415 | -18.6 |
| 0.75 | Nodal Average | 485 | 455 | -10.7 |
| 0.25 | 4-Point Gauss Area Integral | 560 | 502 | -1.5 |
| 0.10 | 9-Point Gauss Area Integral | 595 | 508 | -0.3 |
Higher element densities reduce spatial discretization errors, bringing area-averaged finite element predictions within one percent of physical sensor grid telemetry. High gradients invalidate average readings. When strain gradients exceed fifty microstrain per millimeter across the active gauge footprint, physical telemetry data under-reports structural strain by damping sharp peak values.
Sub-model numerical algorithms account for sensor spatial damping by applying Gaussian weighting factors across element faces mapped directly beneath the physical rosette coordinates.
Failure to area-average finite element predictions across physical gauge foil dimensions violates IPC-9704 testing guidelines and invalidates mechanical acceptance certificates.
Simulation providers often claim that discrepancy stems entirely from physical gauge placement tolerances rather than inadequate numerical element density beneath the component footprint.

Drift
When Do Thermal Strains Mask Mechanical Flexure?
Operating temperature changes expand circuit board laminate independently from externally applied forces. Thermal expansion generates apparent strain within physical gauge foils due to mismatched thermal expansion coefficients between sensor alloys and substrate glass-epoxy materials. Strain gauge telemetry transceivers capture combined total strain, blending mechanical flexure strains with thermally induced expansion strain components.
Thermal strain isolation extracts true mechanical stress states by subtracting thermal apparent strain calibration curves from live telemetry datasets:
epsilon mechanical = epsilon total – epsilon apparent (T) – alpha board Delta T
Polynomial calibration functions define apparent strain response T across operating temperature envelopes. Precision test regimes perform baseline zero-load thermal sweeps prior to mechanical testing to map individual rosette apparent strain profiles from minus forty degrees Celsius to plus one hundred twenty-five degrees Celsius. Verification demands spatial alignment.
Telemetry Signal Conditioning and Lead Wire Compensation
Raw analog voltages originating from distant strain bridges suffer amplitude attenuation during transmission. Lead wire resistance shifts driven by ambient temperature changes introduce spurious offsets into quarter-bridge telemetry channels. Utilizing three-wire Wheatstone bridge configurations or active constant-current bridge excitation circuit topologies cancels lead wire thermal resistance variations across long wiring harnesses.
- Mount triaxial strain rosettes onto designated circuit board test locations using low-shrinkage cyanoacrylate or epoxy adhesive systems.
- Connect sensor lead wires to high-CMRR differential amplifier telemetry channels utilizing shielded twisted-pair cabling.
- Perform baseline shunt calibration across all telemetry channels using high-precision metal film resistors to establish transfer gains.
- Execute an un-loaded thermal chamber profile across the full operating range to generate temperature compensation lookup tables.
- Apply real-time polynomial subtraction filters to incoming telemetry datasets to isolate mechanical strain during dynamic testing.
| Bridge Configuration | Excitation Mode | Thermal Drift Noise (με/°C) | Telemetry SNR (dB) | Max Sampling Frequency (kHz) |
|---|---|---|---|---|
| Quarter-Bridge 2-Wire | Constant Voltage | 4.2 | 38 | 1.0 |
| Quarter-Bridge 3-Wire | Constant Voltage | 0.8 | 52 | 10.0 |
| Quarter-Bridge 3-Wire | Constant Current | 0.1 | 68 | 50.0 |
| Half-Bridge Active | Constant Current | 0.03 | 74 | 100.0 |
High-speed wireless telemetry modules sampling at fifty kilohertz allow transient strain capture during drop testing and dynamic mechanical shock. Dynamic drops create transient spikes. Insufficient sampling rates cause signal aliasing, smoothing peak mechanical strain pulses and under-reporting dynamic structural stress by up to thirty percent relative to finite element transient dynamic simulations.
Uncompensated apparent thermal expansion corrupts fatigue life calculations, leading to unpredicted field returns and expensive warranty settlements.
Boundary
Constraint Stiffness and Fixture Compliance Realities
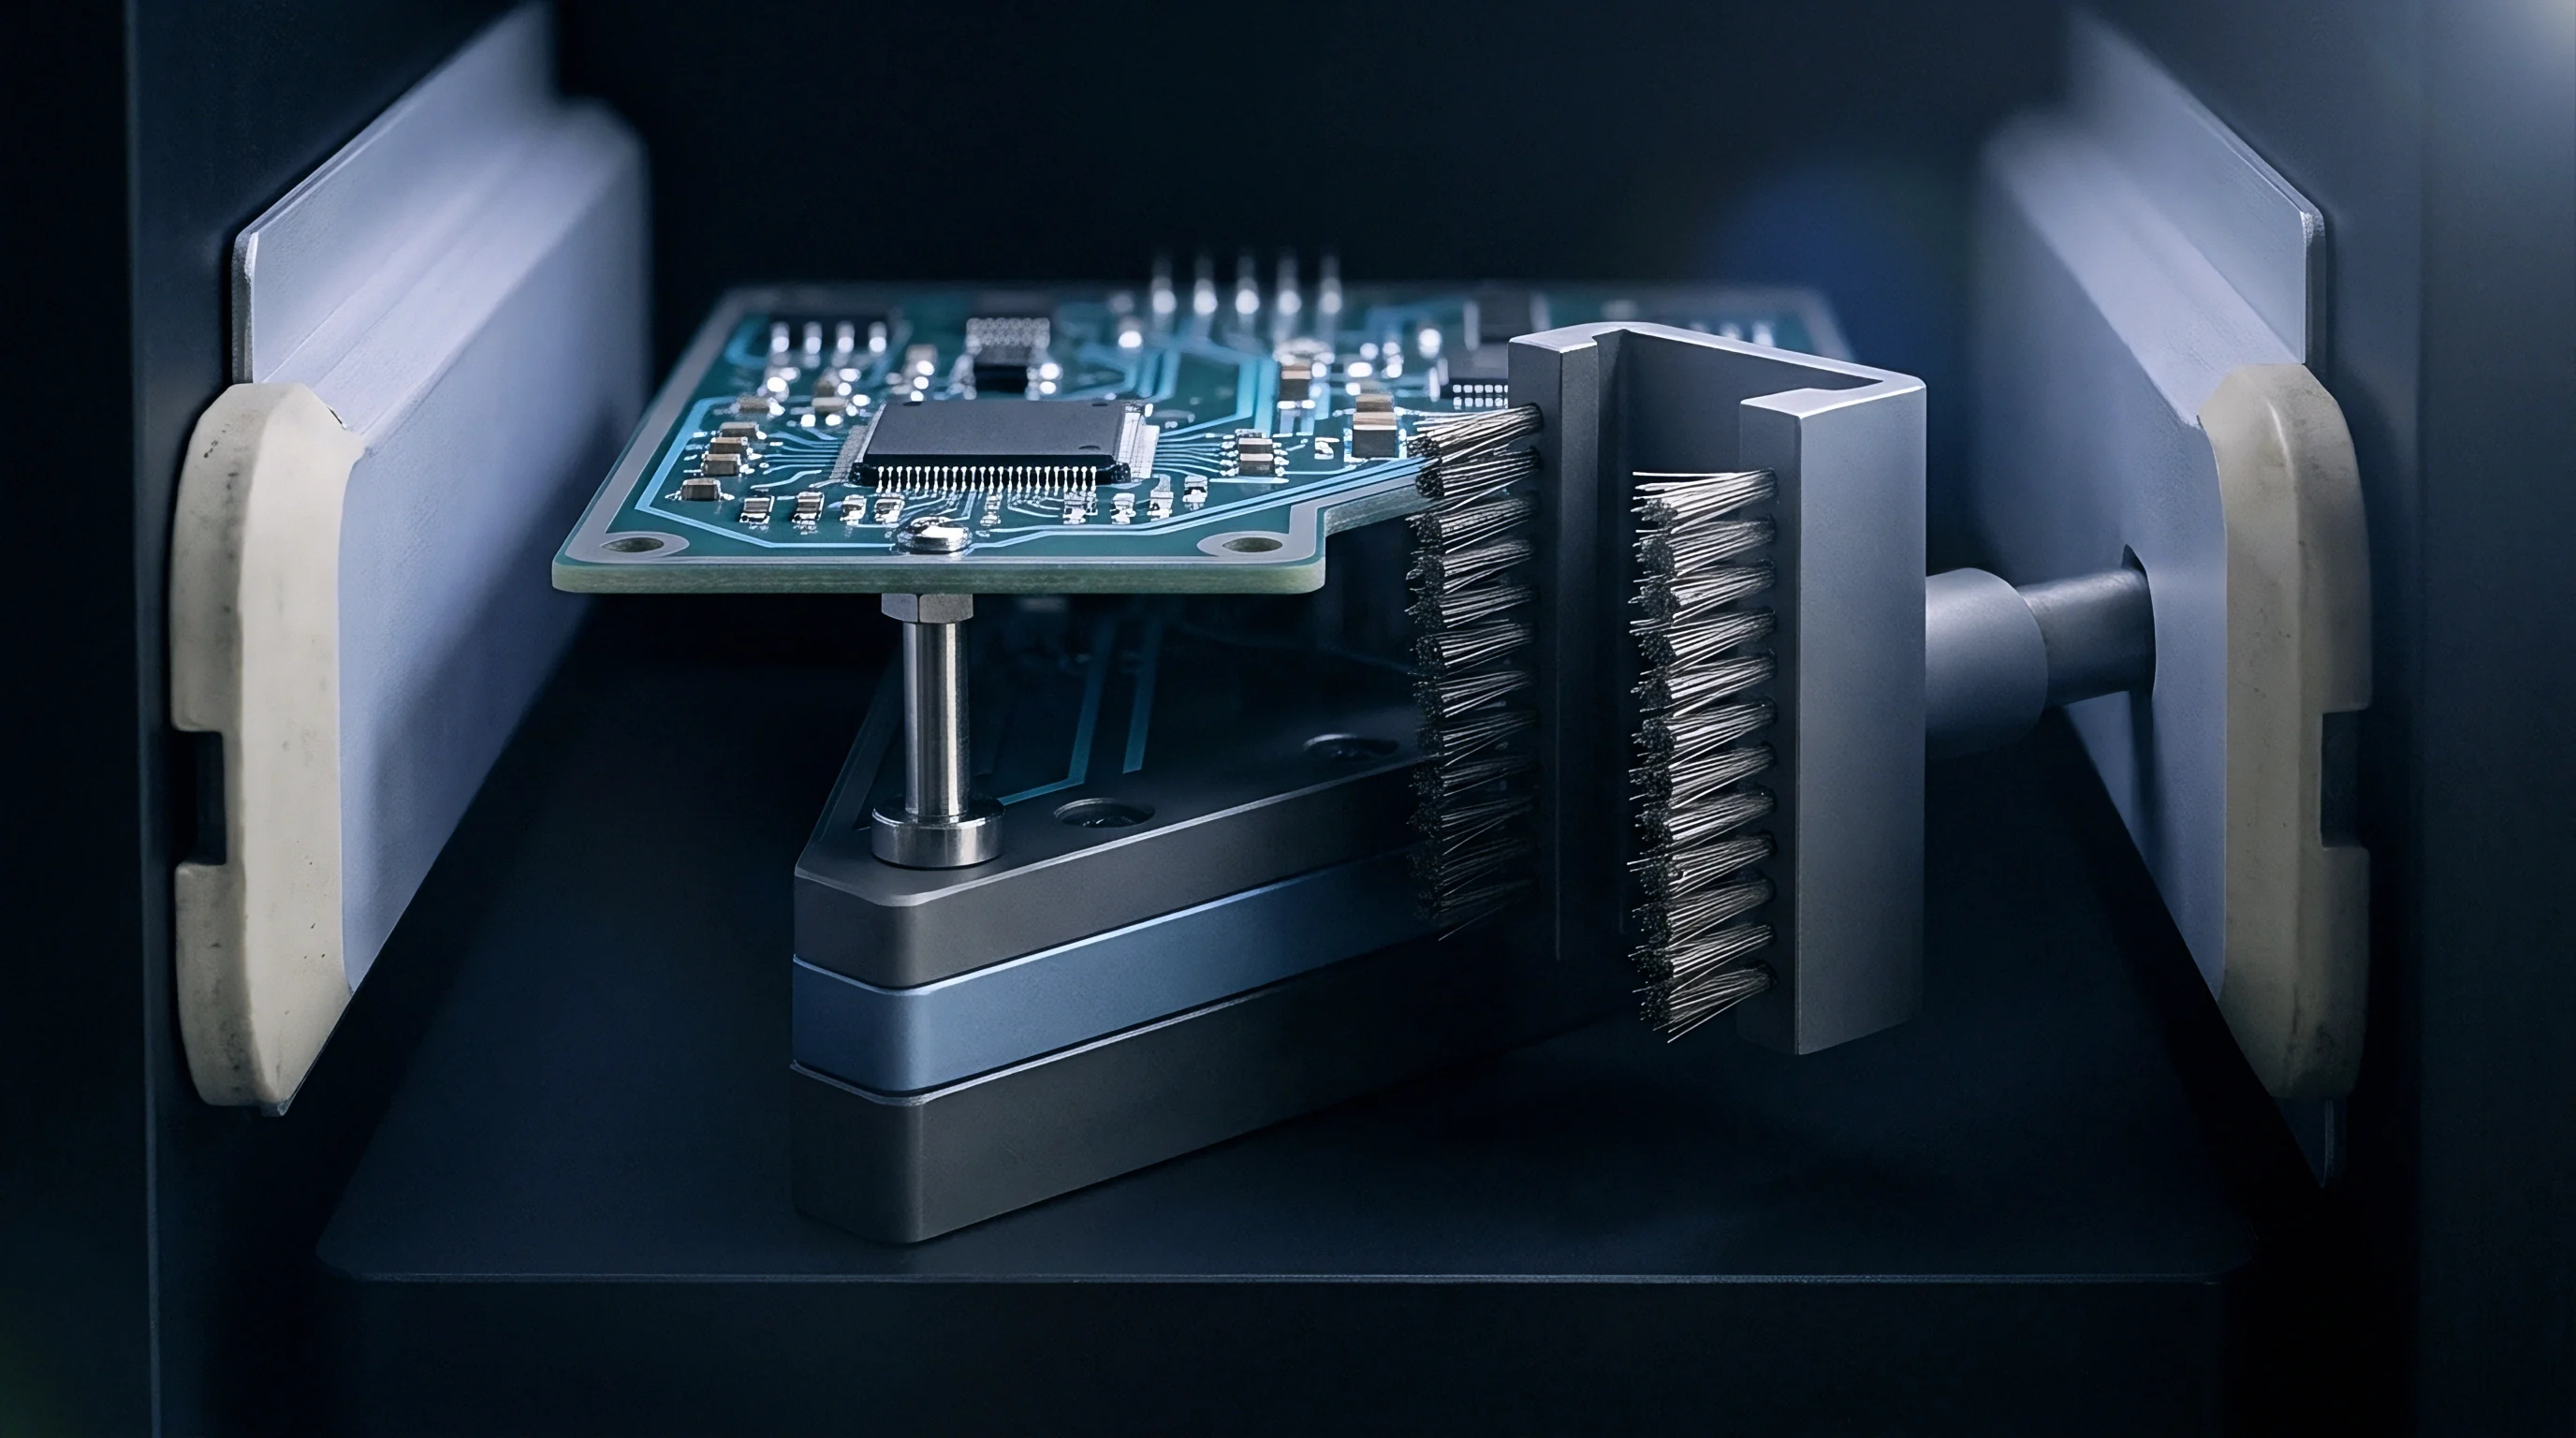
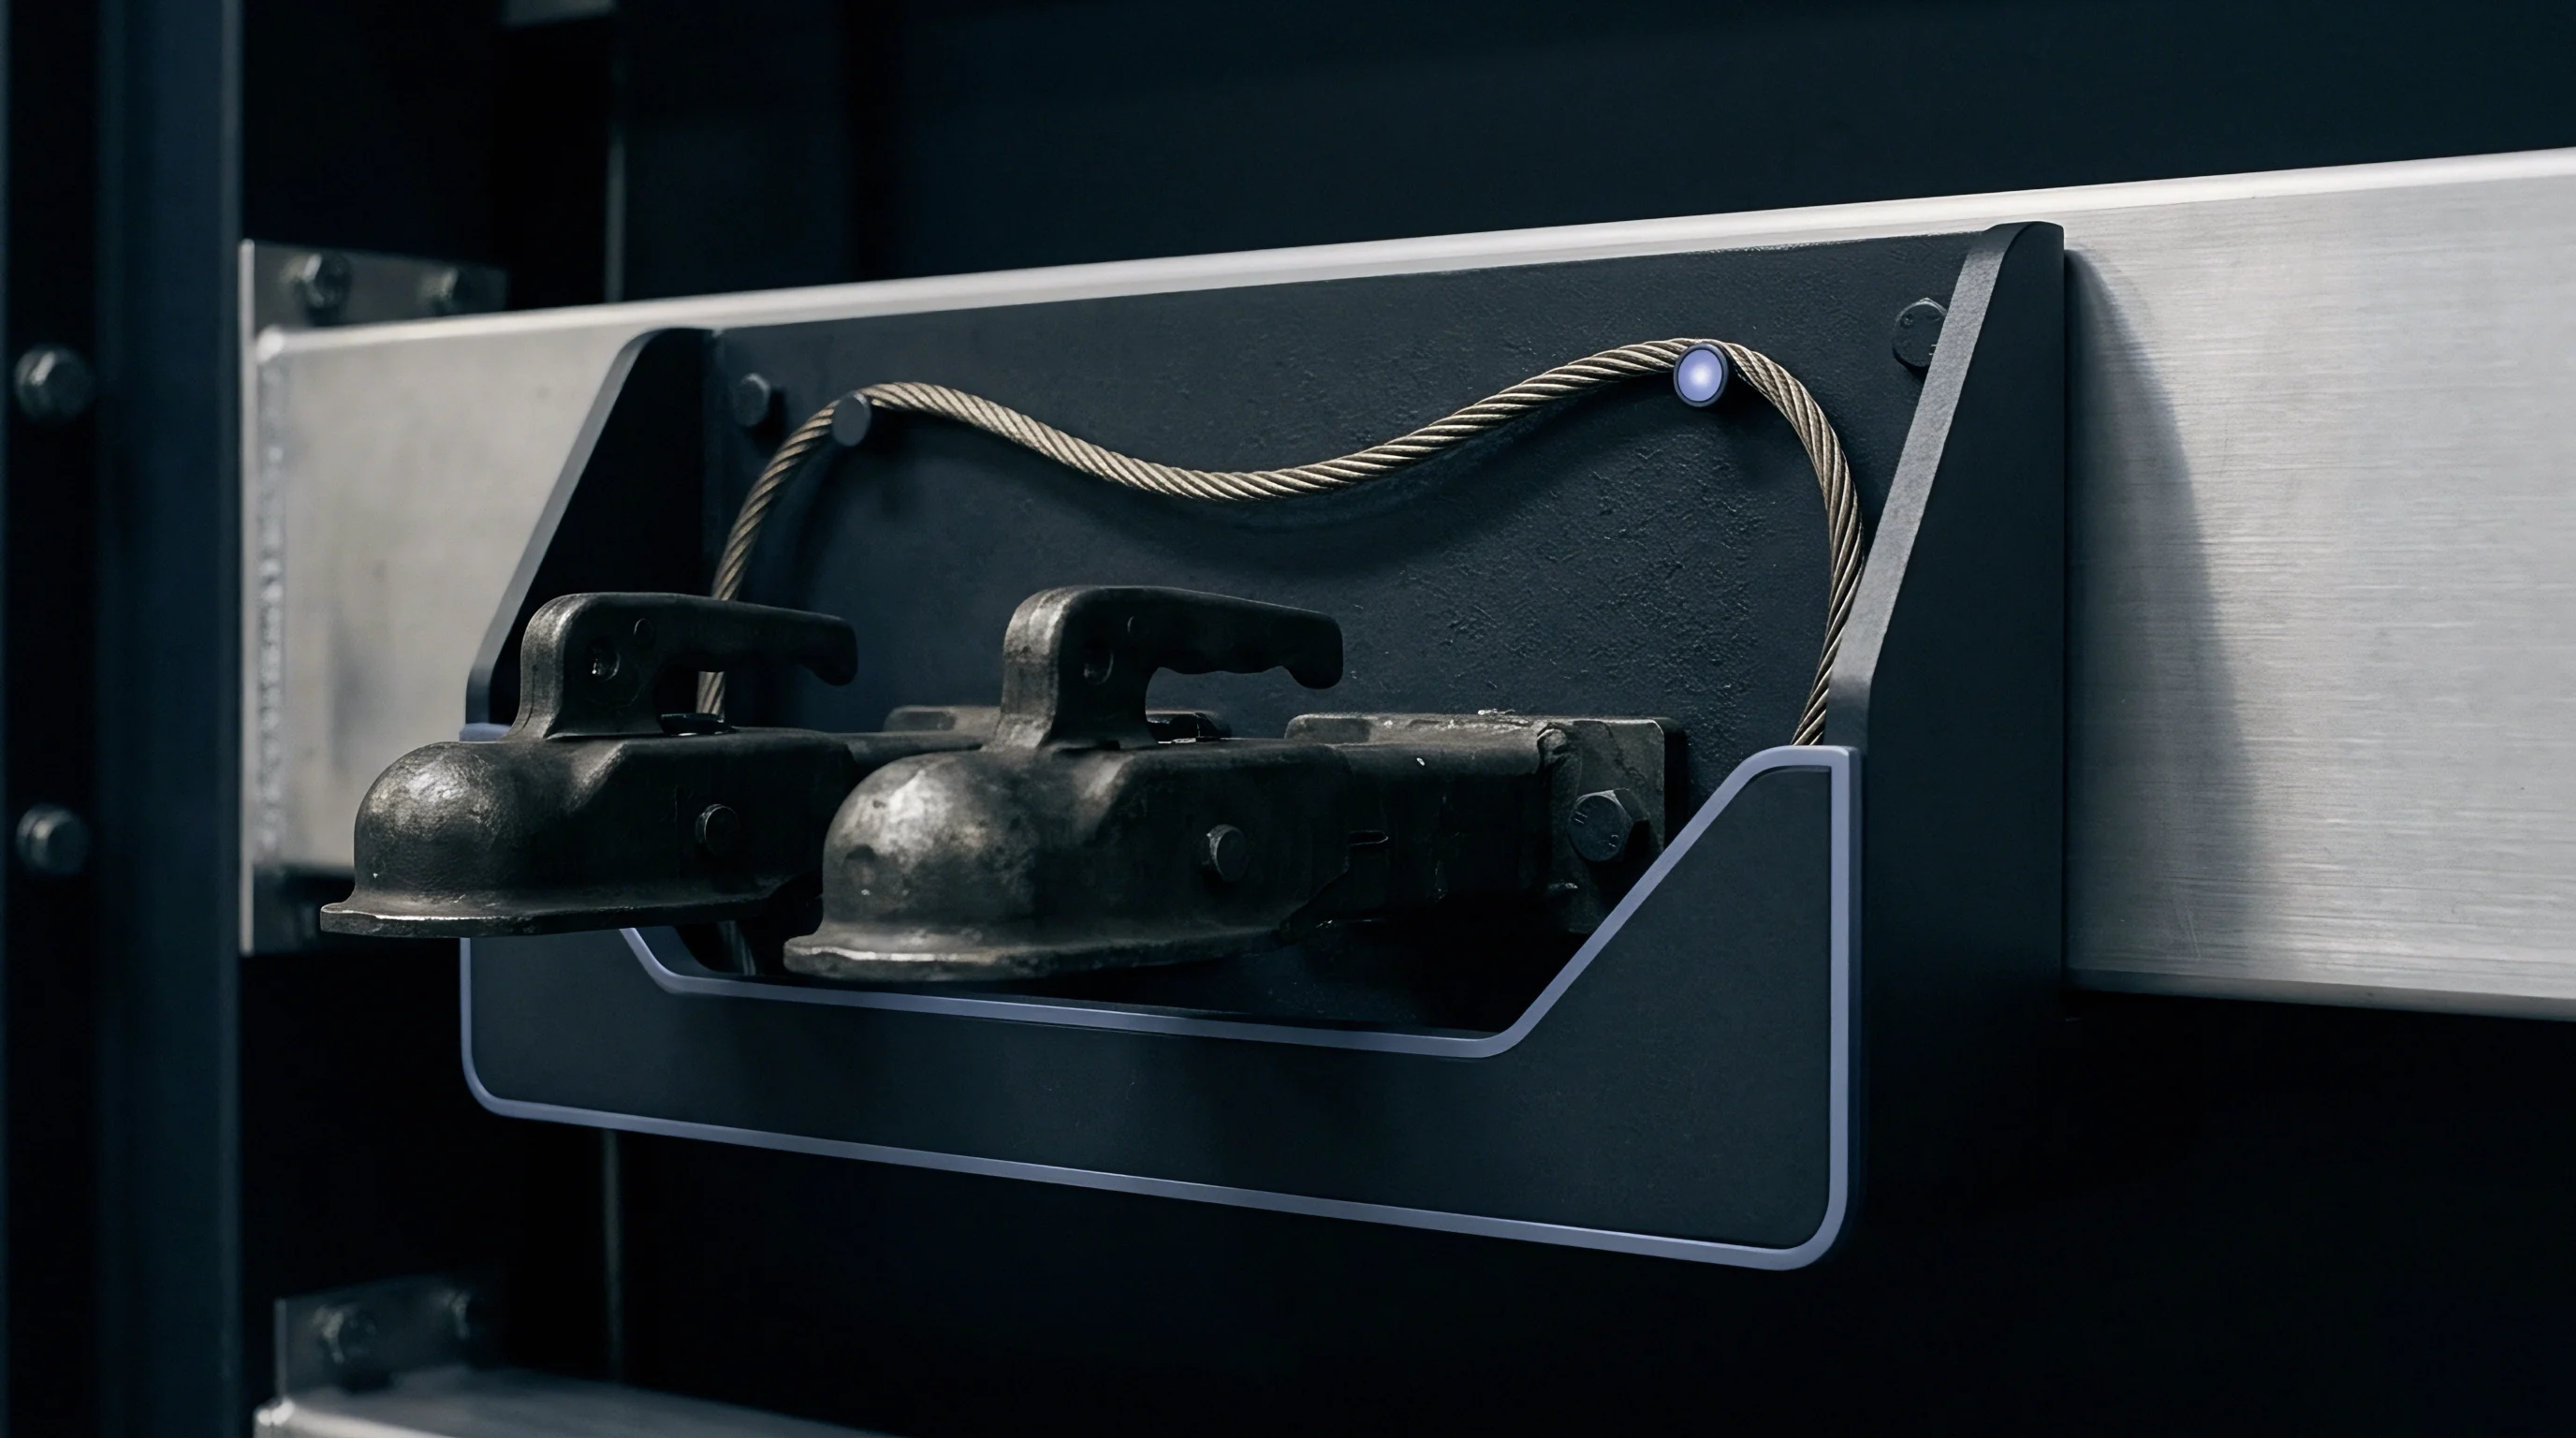
Clamping forces applied to printed assemblies induce localized pre-load conditions. Numerical finite element models routinely apply ideal zero-displacement boundary constraints at mounting hole locations, assuming perfectly rigid support structures. Physical test fixtures deform under load, introducing compliance that redistributes board bending moments away from theoretical constraint points.
Discrepancies between assumed rigid boundaries and real fixture elasticity skew stress field distributions across the entire printed circuit board assembly.
Boundary stiffness dictates global response. Modeling test stand compliance requires introducing grounded spring elements with measured translational and rotational stiffness values at every mechanical fastening location. Measuring physical torque loss on mounting screws reveals local boundary relaxation during prolonged vibration screens.
- Fixture deflection compliance shifts global assembly bending modes, reducing physical strain magnitudes relative to rigid numerical constraints.
- Fastener clamping pre-load variance alters localized substrate boundary stiffness, causing asymmetrical stress field distributions across board surfaces.
- Connector interface constraint friction introduces non-linear hysteresis during cyclic mechanical loading trials.
- Enclosure frame chassis compliance absorbs structural vibration energy, shifting fundamental resonance frequencies away from bare-board numerical models.

Dynamic Response Alignment under Random Vibration
Frequency response functions link base excitation inputs to board bending amplitudes. Correlating dynamic stress fields under random vibration shaker testing demands aligning numerical power spectral density outputs with physical telemetry spectral density traces. Physical acceleration inputs generate multi-modal structural responses where strain fields shift rapidly between dominant bending modes.
Physical screw torque variances alter localized board stiffness far more than minor laminate thickness variations.
Translating power spectral density inputs into finite element stress fields relies on modal superposition or direct frequency-domain integration. Physical rosette telemetry arrays measure strain response peaks across modal crossover regions. When finite element natural frequency predictions deviate by more than three percent from physical resonance peaks observed in telemetry spectrum analysis, numerical stress fields misalign spatially with actual board stress concentrations.
Compliance with MIL-STD-810H Method 514.8 mandates physical strain telemetry verification under dynamic load before final simulation model sign-off.

Fatigue

IPC-9704 Tensile Strain Limits and Principal Stress Criteria
Standardized strain thresholds protect sensitive component packages from micro-cracking during assembly and testing. Surface-mount electronic packaging guidelines establish maximum allowable strain limits based on printed circuit board thickness and component package geometry. Mechanical manufacturing operations, including panel singulation, connector insertion, and heat sink mounting, subject circuit assemblies to transient mechanical flexure.
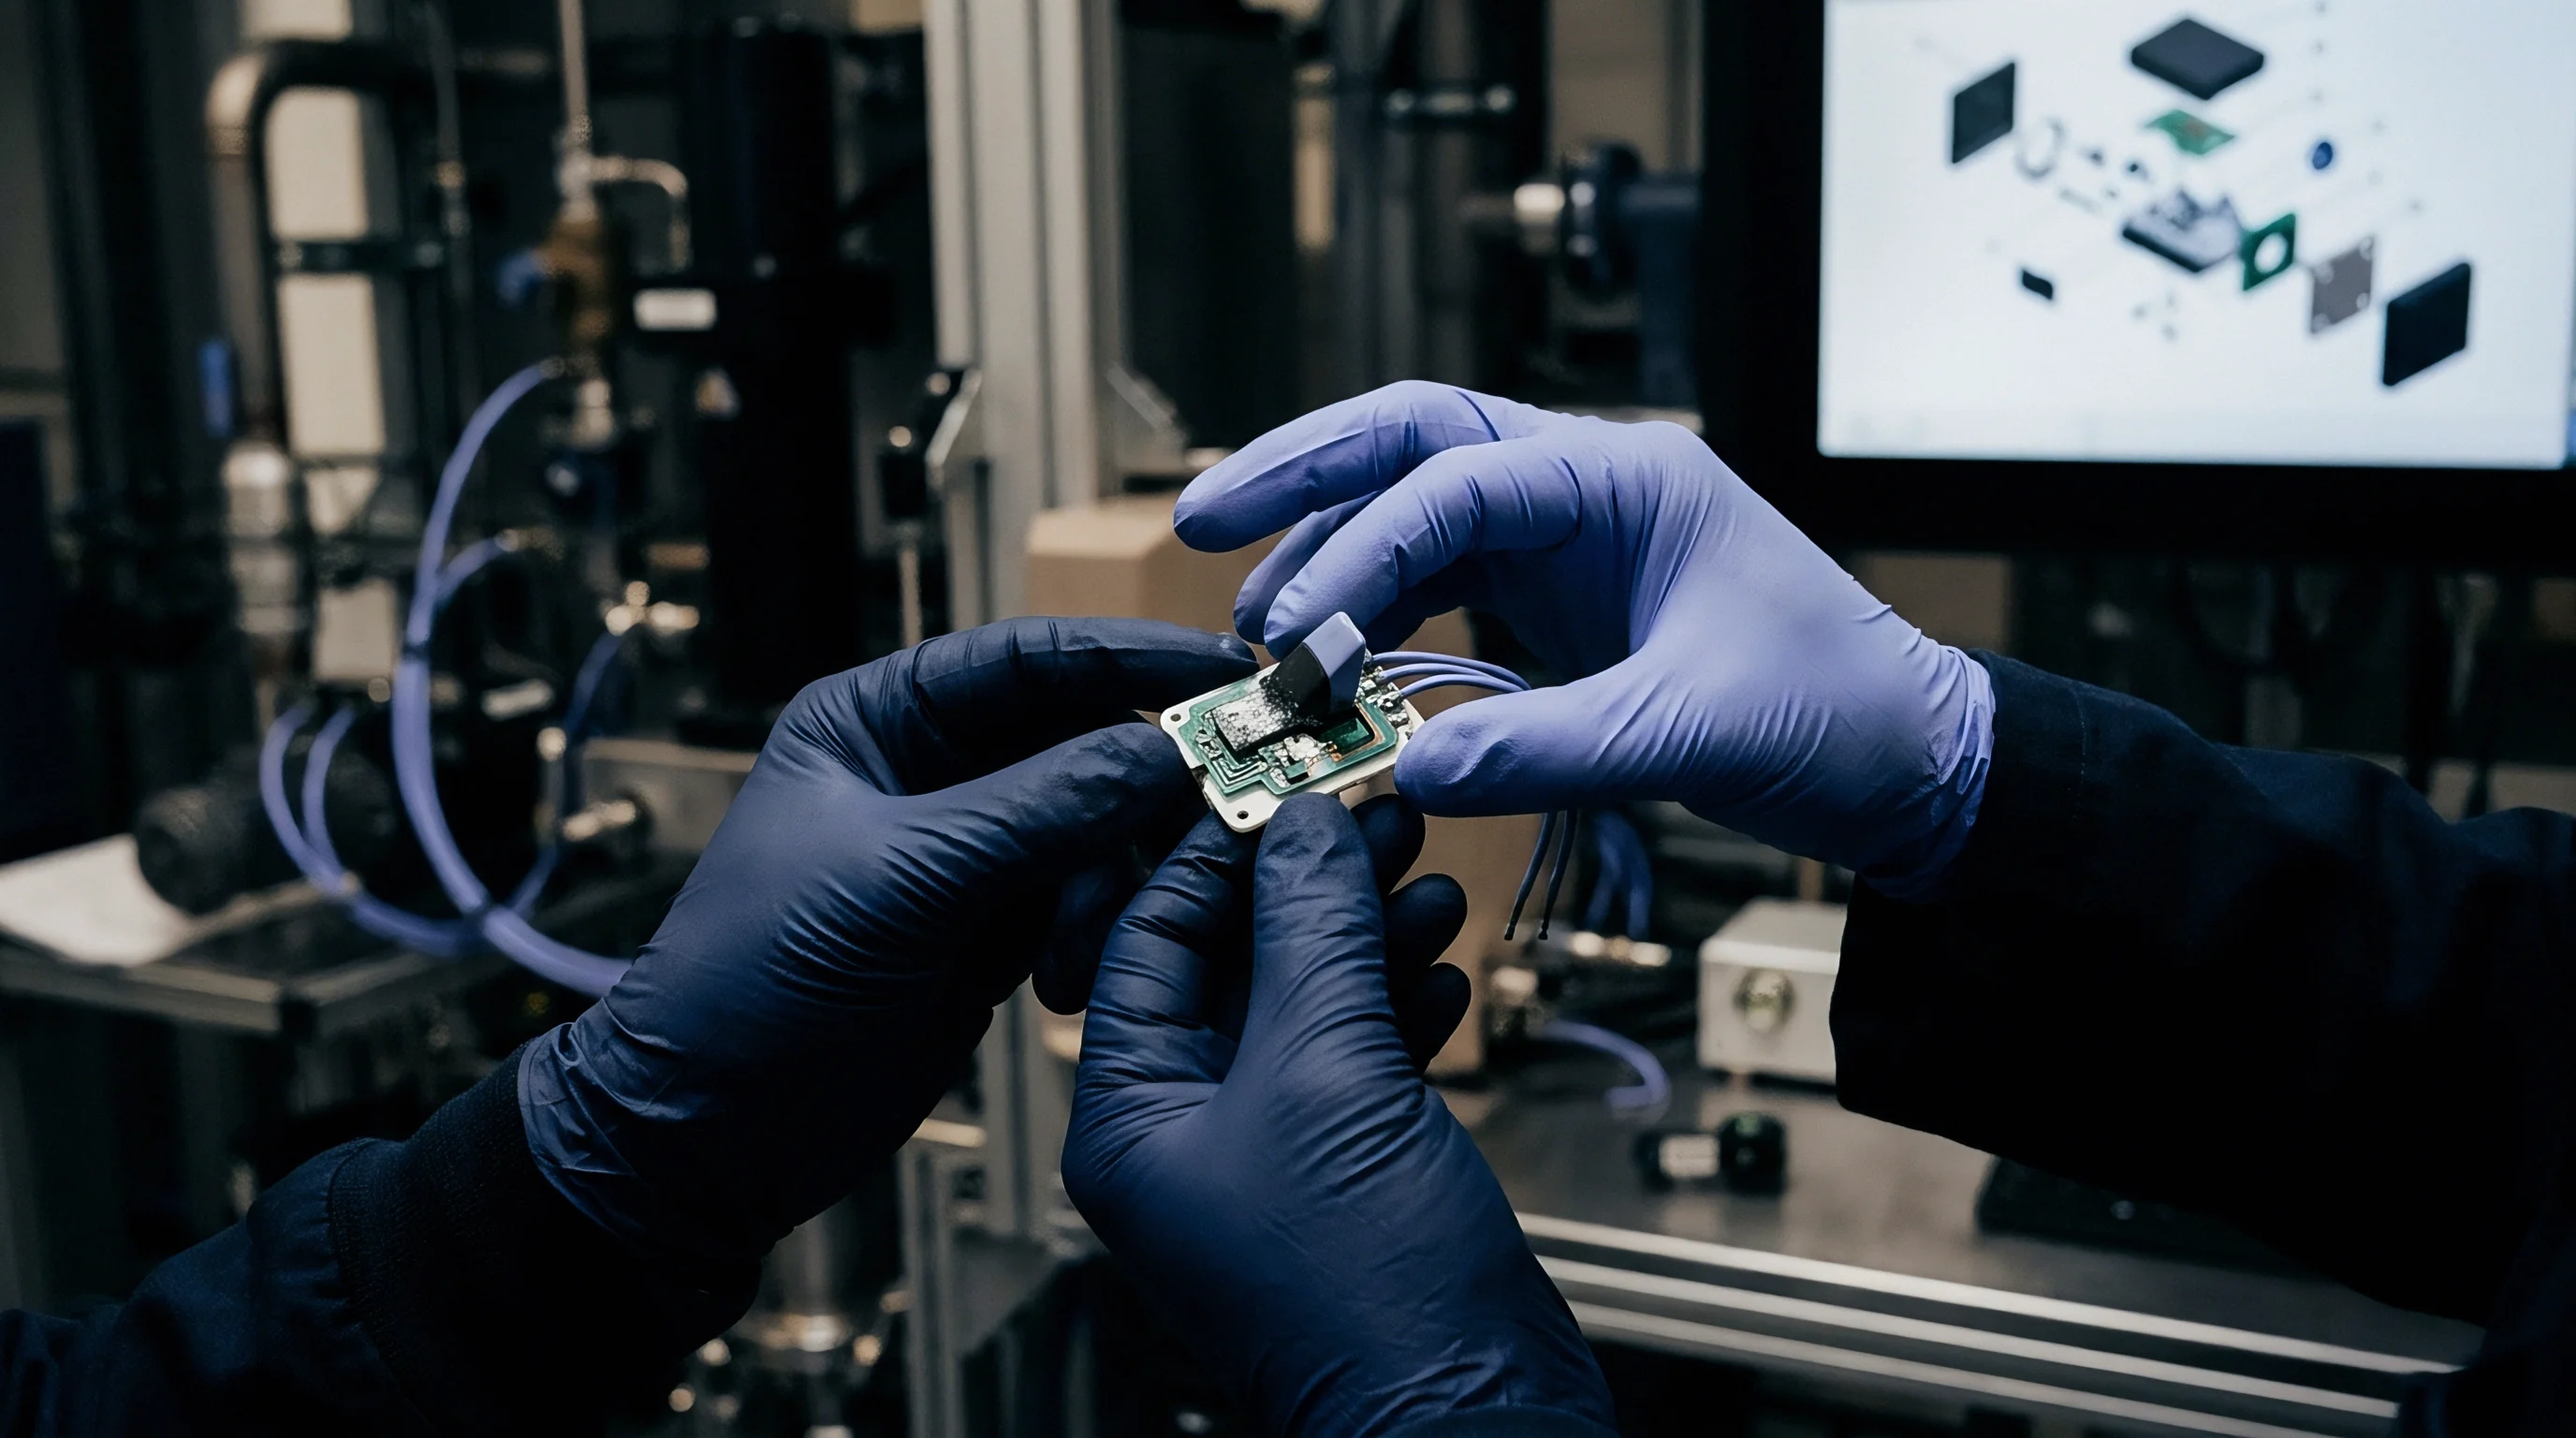
Physical strain rosettes installed adjacent to sensitive ball grid arrays and multi-layer ceramic capacitors monitor real-time strain accumulation against industry threshold limits.
| Component Type | PCB Thickness (mm) | Max Allowable Strain (με) | Max Strain Rate (με/s) | FEA Stress Correlation Limit (MPa) |
|---|---|---|---|---|
| BGA Pitch > 0.8mm | 1.6 | 750 | 100,000 | 16.5 |
| BGA Pitch ≤ 0.8mm | 1.6 | 500 | 100,000 | 11.0 |
| MLCC Package 1206 | 1.0 | 400 | 50,000 | 8.8 |
| WLCSP Package | 0.8 | 300 | 30,000 | 6.6 |
Exceeding allowable strain thresholds risks solder joint cracking, copper trace tearing, and ceramic die fracture. Telemetry links drop frame packets. Finite element stress fields calculate full continuous stress contours across hidden solder joint arrays where physical strain gauges cannot be installed directly.
Correlating surface rosette telemetry with numerical stress field predictions validates the simulation model, allowing buyers to reliably project structural stress levels at un-instrumented internal solder interconnects.
Solder joint life drops by an order of magnitude when localized principal strain rates exceed five thousand microstrain per second during board assembly.

Solder Joint Failure Prediction Using Correlated Stress Fields
Calculated strain field histories enable reliable projection of interconnect wear under cyclic loading. Solder joints fail in shear. Lead-free solder interconnects like SAC305 exhibit time-dependent viscoplastic deformation under combined thermal and mechanical cycling.
Converting strain telemetry cycles into cumulative fatigue damage uses the Darveaux energy dissipation model or modified Coffin-Manson relationship. Accumulated inelastic strain energy density per cycle delta W derives directly from correlated finite element stress-strain hysteresis loops:
N f = C1 (Delta W)^C2
Material constants C1 and C2 calibrate the fatigue life curve for specific solder alloy compositions. Strain gauge telemetry captures global board flexure cycles, which feed finite element sub-models to compute local plastic work density delta W inside critical corner solder balls. Calibration offsets shift baseline values.
Solder ball creep relaxes tension. Correlating global surface telemetry against numerical sub-models provides structural evidence that assembly manufacturing regimes do not consume excessive fatigue life before boards ship into operational environments.
- Intermetallic compound micro-cracking initiates near pad interfaces when principal strain rates exceed assembly limit specifications.
- Solder ball creep fatigue accumulates during combined thermal-mechanical dwell periods, causing electrical open circuits over field lifespans.
- Copper trace necking failure occurs under localized high-cycle flexure bending near rigid mounting hardware enclosures.
- Die corner delamination stems from severe shear stress gradients driven by coefficient of thermal expansion mismatches under power cycling.
Whether sub-grid micro-cracking in lead-free solder alloys can be reliably isolated without embedding strain sensors directly beneath BGA pads remains an open debate.


Discrepancy

Quantitative Correlation Metrics and Normalized Root Mean Square Error
Statistical indices provide objective scalar values to evaluate numerical simulation fidelity. Establishing correlation confidence between finite element stress fields and physical triaxial strain telemetry demands quantitative evaluation across multiple sensor locations and load steps. Calculating the Normalized Root Mean Square Error bridges discrete telemetry data vectors with numerical field predictions across a complete test board assembly:
NRMSE = sqrt((1 / N) sum((sigma FEA, i – sigma telemetry, i)^2)) / (sigma max – sigma min)
A calculated NRMSE below ten percent indicates strong spatial correlation across the sensor array, proving numerical model validity. Pearson correlation coefficients R squared evaluate directional trend alignment across continuous time-series telemetry profiles under dynamic loading. Achieving an R squared value above 0.92 confirms that numerical simulation accurately captures dynamic structural mode shapes and damping behavior.
When NRMSE exceeds fifteen percent, systematic numerical errors exist within material property inputs, boundary constraint definitions, or geometric element representations.

Model Updating Protocols and Dossier Sign-Off Evidence
Adjusting boundary stiffness parameters aligns numerical models with physical sensor readings. Systematic model updating protocols employ sensitivity analysis to identify which simulation parameters drive observed telemetry discrepancies. Automated optimization loops adjust laminate shear moduli, damping ratios, and fixture spring constants until numerical predictions converge within designated correlation guard bands.
Documenting correlation metrics inside technical files provides immutable evidence of structural integrity during regulatory batch sign-off and cross-border customs audits. Technical dossiers carrying verified correlation data prove structural compliance, preventing costly product recalls and protecting manufacturing margins against unverified field defect claims.