Quantifying Non-Destructive High-Frequency Reflection Phase Shift Limits for Sub-Micron Delamination Escapes
Sub-micron delaminations transmit acoustic energy, causing intermediate phase shifts that escape binary inverted-phase gates without spectral Fourier analysis.


Interface
A passing scanning acoustic microscope report often accompanies a lot of packaged semiconductors whose internal boundaries are already coming apart. In high-reliability lots containing quad flat no-lead packages, power quad flat packs, or flip-chip ball grid arrays, non-destructive acoustic inspection relies on acoustic impedance mismatches to identify physical separation. When sound travels from a mold compound or silicon die into an internal delamination, the boundary reflects ultrasound.
The reflected echo carries an inverted phase because the acoustic impedance of trapped gas or partial vacuum drops several orders of magnitude below that of solid encapsulation materials. Standard inspection stations classify these boundaries by checking whether the reflected signal undergoes a nominal 180-degree phase shift relative to a known bonded reference echo.
Acoustic wave physics alters this clean binary classification when physical separation distances fall below one micron. At separation gaps between twenty nanometers and eight hundred nanometers, air or process gas no longer behaves as an acoustically infinite half-space. The front and back surfaces of the gap interact mechanically and elastodynamically, allowing acoustic energy to transmit across the fault.
The reflected pulse is a superposition of reflections from the top and bottom boundaries of the opening. This interference produces intermediate phase shifts ranging between twenty and one hundred forty degrees rather than a crisp polarity reversal. Inspection gates set to flag only full polarity inversions treat these intermediate reflections as bonded interfaces, creating systematic inspection escapes.
Acoustic impedance differentials at solid-to-gas boundaries drop from thirty million Rayls to four hundred Rayls, creating strong theoretical polarity flips that thin-gap interference dampens below standard detection limits.
Impedance governs the echo amplitude. Epoxy mold compound exhibits an acoustic impedance between three and five Megarayls, while silicon registers approximately twenty Megarayls and copper leadframes register over forty Megarayls. Air exhibits an acoustic impedance near four hundred Rayls.
When ultrasound encounters a thick void, the acoustic reflection coefficient approaches negative unity, reversing the polarity of the reflected radio-frequency echo. When the gap narrows below the acoustic wavelength in the gap medium, acoustic transmission through the gap rises sharply. Phase shift magnitude decreases continuously as gap thickness approaches zero.
These sub-micron voids originate during post-mold cure thermal contractions, moisture expansion during IPC/JEDEC J-STD-020 reflow soldering, or mechanical shear stresses during lead trimming. The resulting opening permits moisture ingress and accelerates galvanic corrosion along wire bonds or solder bumps while remaining completely sealed under initial visual or radiographic checks. Automated test handlers configured with broad time-domain gates record nominal amplitude echoes.
These systems pass packaged units whose structural delaminations release during subsequent temperature cycling screens in field operation.


Pulse
Time-domain waveforms captured by high-frequency transducers reveal the gradual distortion of the reflected acoustic package as separation distances collapse. A typical scanning pulse centered at one hundred megahertz produces an acoustic wavelength of roughly fifteen microns in mold compound, eighty-four microns in silicon, and approximately three and a half microns in atmospheric air. When a delamination gap measures five microns or more, the reflected echo resolves as a discrete reflection from the primary interface, displaying an inverted radio-frequency signal shape with an unmistakable phase flip.
Sub-micron gaps force acoustic reflections from the upper solid-gas interface and the lower gas-solid interface into tight temporal overlap.
Superposition alters the received echo structure. The initial reflection from the top surface exhibits a negative reflection coefficient, while the reflection from the rear surface carries a positive reflection coefficient and a small time delay proportional to twice the gap width. Because this delay is minuscule compared to the acoustic period of the transducer, destructive interference cancels out the trailing tail while shifting the zero-crossing point of the primary waveform.
Signal processing algorithms monitoring only the peak positive amplitude or a simple zero-crossing trigger miscalculate the actual phase angle of the reflected package.

Can Phase Inversion Resolve Sub-Micron Gaps?
Direct phase calculation demands frequency-domain transformation through discrete Fourier algorithms rather than raw time-domain peak thresholding. Calculating the phase spectrum of the gated radio-frequency echo extracts the real and imaginary components across the transducer bandwidth. At forty nanometers separation, the calculated phase shift at one hundred megahertz registers less than fifteen degrees away from the bonded reference signal.
Test equipment lacking spectral phase analysis registers this return as an acceptable bonded joint. The table below outlines acoustic material properties and theoretical reflection parameters across typical component package interfaces.
| Interface Boundary | Material One Impedance (MRayl) | Material Two Impedance (MRayl) | Reflection Coefficient Bonded | Reflection Coefficient Open Void | Nominal Phase Inversion |
|---|---|---|---|---|---|
| Mold Compound to Copper | 4.2 | 41.8 | +0.817 | -0.999 | 180 Degrees |
| Mold Compound to Silicon | 4.2 | 19.7 | +0.648 | -0.999 | 180 Degrees |
| Silicon to Die Attach Epoxy | 19.7 | 3.8 | -0.676 | -0.999 | 0 Degrees |
| Die Attach Epoxy to Copper | 3.8 | 41.8 | +0.833 | -0.999 | 180 Degrees |
| Silicon to Underfill | 19.7 | 4.5 | -0.628 | -0.999 | 0 Degrees |
Signal tracking becomes complicated at silicon-to-epoxy interfaces where the bonded reflection coefficient is already negative. When ultrasound travels from silicon into die attach or underfill, the transition from high impedance to low impedance naturally inverts signal polarity even under pristine bonding. Identifying delamination at these sites requires detecting changes in phase magnitude and amplitude shifts rather than looking for a simple sign change.
Quality engineers unaware of this baseline behavior often instruct test technicians to filter for negative peaks, blind to the true physical state of the die attach plane.
Assemblers often argue that standard acoustic thresholding calibrated on manufactured calibration blocks guarantees complete package integrity across production lots.

Interference
Acoustic resonance inside ultra-thin gas films explains why conventional acoustic microscopes routinely allow borderline lots to leave the testing dock. Thin-film acoustic models treat the sub-micron gap as an elastic boundary stiffness parameter rather than a discrete volumetric layer. The effective normal stiffness per unit area equals the adiabatic bulk modulus of the trapped gas divided by the separation distance.
When separation width shrinks, boundary stiffness increases proportionally. At stiffness values exceeding ten gigapascals per micrometer, the acoustic wave transmits across the boundary almost unhindered, creating minimal reflected energy.
Wavelength dictates detection sensitivity. The acoustic wavelength in the package material defines the physical resolution limit of the time-of-flight gate. At two hundred thirty megahertz, acoustic waves in silicon measure approximately thirty-six microns, meaning a one-hundred-nanometer gap represents less than three thousandths of a wavelength.
Signal attenuation increases with the square of acoustic frequency, preventing endless upward scaling of transducer power. Attenuation limits maximum usable frequency in heavily filled mold compounds to roughly one hundred fifty megahertz, locking the inspection regime into an acoustic regime where sub-micron delaminations display faint phase anomalies.
IPC/JEDEC J-STD-035 defines delamination detection limits by scan pixel grid size rather than phase displacement thresholds, leaving sub-micron separations unclassified in production screening records.
Phase angle calculation requires resolving the complex reflection coefficient through elastodynamic transmission equations. Expressing the acoustic reflection coefficient in terms of boundary stiffness yields an explicit relationship between gap thickness, ultrasound frequency, and observed phase angle:
Phase shift equals the arctangent of acoustic impedance divided by the quotient of boundary stiffness and angular acoustic frequency. At low angular frequencies or high interface stiffness, the phase angle approaches zero. As the gap opens toward several microns, stiffness collapses toward zero, swinging the phase shift toward negative one hundred eighty degrees.
The transition zone between twenty degrees and one hundred sixty degrees defines the escape window for conventional acoustic sorting fixtures.
- Reference Calibration Echo establishes baseline phase angle and amplitude off an unblemished internal package feature at identical depth.
- Radio Frequency Digitization converts the analog return trace at a minimum sampling rate of two gigasamples per second to preserve high-order harmonics.
- Temporal Window Gating brackets the specific mechanical interface within a precise three-nanosecond time-of-flight window to isolate the target boundary.
- Fast Fourier Transformation maps the gated time-domain pulse into spectral phase and amplitude vectors across the sixty-decibel usable bandwidth.
- Phase Angle Discrimination compares the calculated boundary phase angle against defined threshold limits established through destructive physical cross-section correlation.
The transition behavior of sub-micron gaps creates severe discrepancies between optical inspection, X-ray inspection, and acoustic imaging. X-ray radiography lacks density contrast to identify separations without volumetric material loss. Optical inspection cannot view encapsulated dies without destructive decapsulation.
Decapsulation dissolves the surrounding plastic, relieving residual mechanical stresses and destroying the mechanical geometry of the gap. The true phase shift threshold at which a sub-micron delamination initiates moisture-induced interfacial fatigue under field stress remains contested across production lines.

Transducer
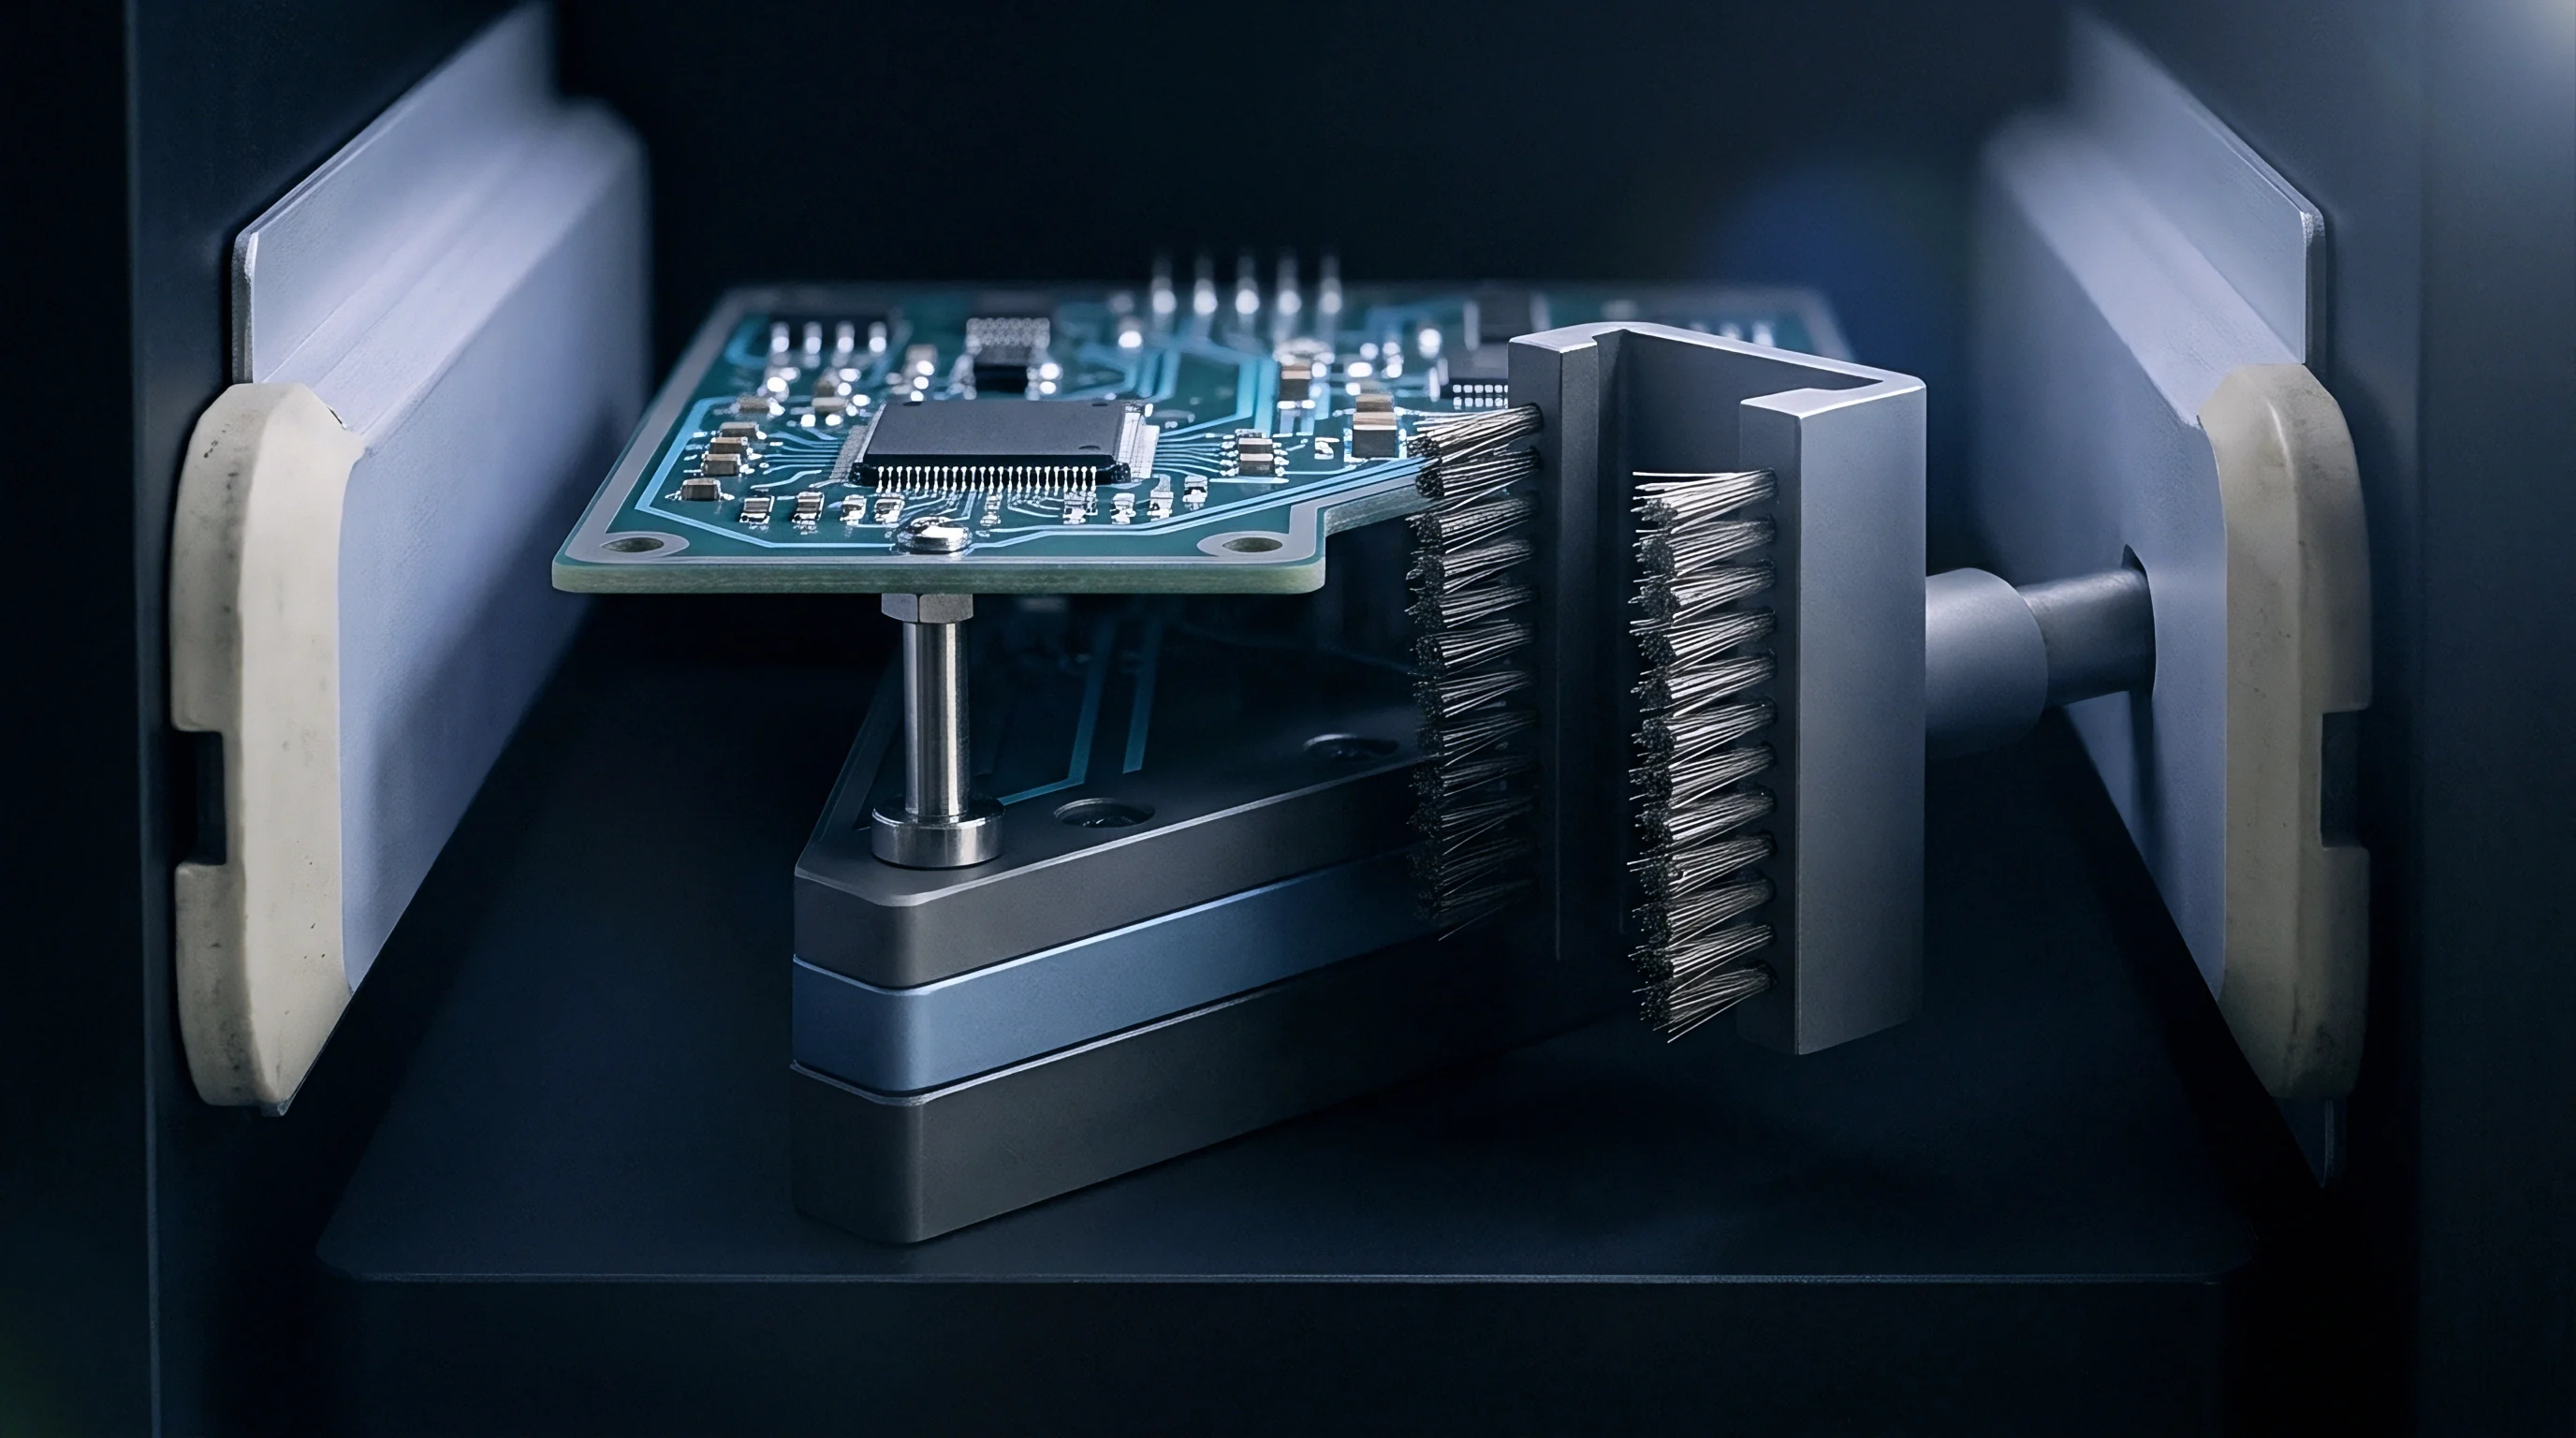
Hardware configuration fixes the physical boundary between a detectable defect and an unflagged escape. Acoustic microscopes employ focused piezoelectric transducers constructed from lithium niobate, zinc oxide, or lead zirconate titanate bonded to sapphire or quartz acoustic buffer rods. A ground acoustic lens cut into the buffer rod focuses ultrasound through deionized coupling water into the test sample.
Lens diameter, focal length, transducer frequency, and radio-frequency receiver bandwidth together dictate the lateral resolution and focal depth of the inspection beam.
Higher frequency reduces the focal spot size, concentrating energy on smaller interfacial areas. A fifty-megahertz transducer with a half-inch focal length yields a beam spot diameter of approximately one hundred microns at the package interface. A two-hundred-thirty-megahertz transducer with a quarter-inch focal length narrows that spot to roughly twenty microns.
Lateral resolution matters because real-world delaminations do not manifest as flat, uniform plates. Delaminations exhibit micro-scale topographic roughness, partial contact asperities, and feathering edges where gap thickness tapers gradually to zero.
Could High Attenuation Mask Boundary Discontinuities?
Signal loss in epoxy mold compounds sets the absolute ceiling for transducer frequency selection. Mold compounds contain fused silica filler particles added to control thermal expansion and improve thermal conductivity. Particle sizes range from one micron to over thirty microns.
When the acoustic wavelength approaches the average particle diameter, acoustic scattering transitions from predictable Rayleigh scattering into Rayleigh-Mie regime dispersion. At frequencies above one hundred seventy-five megahertz, energy absorption in standard transfer-molded compounds exceeds eight decibels per millimeter of travel, extinguishing the return echo from die paddles or buried substrates.
- Low Frequency Transducers operating between fifteen and thirty megahertz penetrate deeply through thick power modules but lack phase resolution for gaps below five microns.
- Midband Focus Transducers centered at fifty to seventy-five megahertz provide reliable penetration through three millimeters of molded plastic while maintaining phase detection limits near one micron.
- High Frequency Transducers covering one hundred to two hundred thirty megahertz resolve phase shifts in gaps down to two hundred nanometers in low-loss flip-chip packages.
- Ultrahigh Frequency Transducers reaching three hundred megahertz to one gigahertz image sub-hundred-nanometer separations through polished silicon backsides while failing entirely through mold compound layers.
Transducer damping governs axial pulse duration. Highly damped transducers produce extremely short acoustic bursts containing one or two cycles of radio-frequency energy. Short pulses prevent overlapping reflections from closely spaced package layers, such as the top of a leadframe and the underlying tie bar.
Lightly damped transducers generate extended pulse trains that ring down over several cycles, obscuring phase changes in trailing echoes. Acoustic scanning fixtures configured with ringing transducers lose phase inversion sensitivity whenever reflections occur within forty nanoseconds of adjacent structural boundaries.
Transducer frequency selection balances penetration depth against phase sensitivity across every encapsulated interface.

Partition
Escape probability models establish mathematical guard bands that protect buyers against undetected sub-micron delamination lots. Defect escapes follow a bivariate distribution governed by gap thickness variation and transducer phase measurement uncertainty. In a production run subjected to moisture sensitivity preconditioning, interfacial delamination gaps exhibit a log-normal distribution across affected leadframes.
If the automated acoustic scanner uses a blunt ninety-degree phase inversion threshold, every unit with gap dimensions yielding phase shifts between fifteen and eighty-nine degrees escapes as acceptable inventory.
Signal-to-noise ratio in the measurement receiver degrades phase determination accuracy. When background electronic noise and acoustic reverberation generate four millivolts of baseline jitter on a forty-millivolt return signal, phase estimation uncertainty spans plus or minus twelve degrees. Setting an inspection rejection limit at ninety degrees means parts with true eighty-degree shifts can register as ninety-two degrees and face rejection, while parts with true ninety-eight-degree shifts register as eighty-six degrees and ship out.
Establishing guard bands requires pushing the phase rejection threshold down to the ambient noise floor of the bonded reference waveform.
| Gap Thickness (nm) | Effective Boundary Stiffness (GPa/um) | Theoretical Phase Shift (deg) | Measured Phase with 10% Noise (deg) | Standard Gate Call | Escape Probability |
|---|---|---|---|---|---|
| 1000 | 0.14 | 172.5 | 171.8 | Reject | 0.001 |
| 500 | 0.28 | 165.2 | 163.9 | Reject | 0.004 |
| 250 | 0.56 | 151.1 | 149.6 | Reject | 0.021 |
| 100 | 1.41 | 122.4 | 119.8 | Reject | 0.083 |
| 50 | 2.83 | 88.6 | 86.1 | Pass | 0.542 |
| 25 | 5.66 | 54.3 | 52.7 | Pass | 0.965 |
| 10 | 14.15 | 25.1 | 24.3 | Pass | 0.999 |
Escapes manifest as early life field failures during operational thermal cycling. A package containing a fifty-nanometer delamination over a power die paddle retains sufficient thermal conductivity to pass initial automated burn-in and functional testing. Under field load, thermal resistance across the unbonded interface rises as cyclic expansion widens the microscopic gap.
The temperature of the silicon die increases, accelerating channel wear and triggering thermal shutdown or die cracking within several hundred operating hours.
Failure to quantify phase shift limits passes latent package delaminations into critical assemblies, driving field return rates that exhaust warranty reserves and trigger widespread product recalls.
Settlement
Commercial contracts and purchase specifications dictate how test evidence resolves disputed component lots. When an incoming qualification lot fails at the buyer dock due to acoustic phase anomalies, suppliers frequently counter that the parts satisfy visual and functional parameters under IPC-A-610 and IPC/JEDEC J-STD-020 standards. Standard J-STD-020 classifies delamination based on area percentage, such as no delamination exceeding ten percent of the die attach area, but standard factory testing uses peak-amplitude acoustic thresholds that never register sub-micron gaps.
The buyer technical dossier must specify the exact acoustic inspection parameters required for formal lot acceptance.
Inspection agreements must establish whether scanning acoustic microscopy reports include raw digitized radio-frequency A-scan waveforms alongside converted C-scan color maps. A supplier can configure C-scan software to display an interface as completely bonded simply by setting the amplitude detection gate above the attenuated signal return of a thin delamination. Requiring full waveform capture across a grid of test coordinates allows the buyer to perform independent discrete Fourier phase transformation, recalculating the true interfacial phase shift across critical stress points.
Acoustic inspection criteria lacking raw radio-frequency A-scan data submission leave buyers without evidential standing during warranty disputes over thermal failure escapes.
Quality agreements must define the specific actions triggered when intermediate phase shifts appear in production sample lots. The list below outlines the mandatory verification steps required within a high-reliability supply agreement to prevent escape disputes:
- A-Scan Waveform Archival Clause mandates that the assembly vendor capture and store raw time-domain radio-frequency waveforms for every scanned package coordinate.
- Spectral Phase Threshold Clause establishes an absolute phase rejection threshold at forty-five degrees of phase shift relative to the bonded calibration standard.
- Transducer Center Frequency Specification fixes the minimum transducer frequency at one hundred megahertz for mold compound interfaces and two hundred thirty megahertz for flip-chip dies.
- Destructive Physical Analysis Verification requires cutting cross-sections and performing focused ion beam scanning electron microscopy on any lot exhibiting twenty to sixty degrees of acoustic phase shift.
- Batch Rejection Liability Clause assigns freight, sorting, and replacement costs entirely to the supplier if destructive physical analysis confirms mechanical separation at acoustic anomaly sites.
The landed cost of high-reliability components increases significantly when suppliers incorporate full spectral phase processing into automated scanning acoustic microscopy lines. High-speed scanning handlers running simple time-domain peak capture process up to sixty units per minute. In contrast, comprehensive radio-frequency digitization and real-time spectral phase analysis reduce throughput to eight to twelve units per minute per inspection head.
Sourcing teams must balance this test hour expense against the severe financial exposure of catastrophic field failures.
Section 6.2.1 of JEDEC Standard JESD22-A104 stipulates that any thermal fatigue cycling test report must incorporate baseline and post-stress acoustic scanning images captured using identical transducer frequencies and focal configurations to validate interface endurance.