Calibrated Reference Artifacts for Inline Industrial Micro Computed Tomography
Calibrated reference artifacts validate inline micro-CT voxel scaling, focal spot drift, and spatial resolution to guarantee true volumetric defect measurement.
Sphere
Precision dimensional calibration in three-dimensional X-ray imaging depends on stable physical geometries measured to nanometer-level tolerances. Inline industrial micro computed tomography systems operating inside surface mount assembly lines evaluate solder joint integrity, wire bond geometry, and internal void distributions at production cadence. Without traceable physical reference structures scanned under identical geometric magnification conditions, reconstructed voxel grids drift across production shifts.
This drift converts quantitative defect sizing into arbitrary grey-value estimation, undermining automated pass and fail decisions on high-density circuit assemblies.
Reference artifacts built for inline micro computed tomography utilize highly spherical elements mounted in stable, low-attenuation matrices. Sphericity affects calculation accuracy. These elements serve as invariant spatial coordinates across the volumetric field of view.
When an X-ray cone beam projects through an object onto a flat-panel digital detector, tiny mechanical inaccuracies in stage rotation, thermal expansion of the X-ray tube filament, and detector panel tilts alter the calculated image geometry. Physical sphere arrays provide known center-to-center distances that allow reconstruction algorithms to calculate true voxel scaling factors across three orthogonal axes.
Physical Reference Geometries for Inline Voxel Scaling
High-resolution micro-CT systems assign volumetric element sizes by projecting magnification ratios onto a digital detector panel. The physical distance between the X-ray spot origin, the center of object rotation, and the detector plane dictates the nominal voxel edge length. On a fast-running surface mount line, ambient temperatures fluctuate when reflow exhaust draws air across nearby automated inspection cabinets.
A thermal change of three degrees Celsius expands the mechanical manipulator frame sufficiently to alter geometric magnification, introducing multi-micron spatial errors across a fifty-millimeter circuit board panel.
3D ball plates and helical sphere artifacts solve this spatial uncertainty by placing high-precision spheres throughout the inspection volume. Grade 5 ruby spheres and silicon nitride elements provide sphericity tolerances tighter than 0.13 micrometers. Silicon nitride resists thermal expansion.
When arranged in a carbon-fiber frame exhibiting near-zero thermal expansion, these spheres yield invariant spatial references. The automated CT reconstruction software detects sphere centroids via three-dimensional edge extraction, comparing calculated center-to-center distances against NIST-traceable calibration certificates issuing from accredited laboratories.
Silicon nitride reference spheres held at 20 degrees Celsius yield dimensional uncertainty below 0.3 micrometers under monochromatic micro-CT calibration.
Evaluating voxel anisotropy demands spatial references distributed across the entire z-height of the scan field. Single-plane target grids catch lateral scaling drift in x and y dimensions but miss focal spot migration along the optical beam path. Helical arrangements position spheres at incremental z-axis heights, enabling simultaneous measurement of aspect ratio distortion, detector skew, and rotation axis tilt during a single ten-second calibration sweep.

Material Density Selection and Attenuation Contrast
Radiographic contrast across composite industrial assemblies demands target elements with predictable photon absorption rates. An artifact designed for electronic assembly qualification incorporates materials that match the X-ray attenuation profiles of copper traces, lead-free solder alloys, and aluminum heat sinks. Density shifts alter image contrast.
If reference spheres attenuate photons too weakly, projection images lack the signal-to-noise ratio required for precise sphere center calculation. Excessive attenuation starves the detector panel, creating severe photon starvation artifacts that distort sphere edge detection algorithms.
Selecting reference materials involves balancing atomic number, physical density, and mechanical hardness. Titanium alloy and grade 5 sapphire spheres function reliably in mid-energy inspection regimes between 100 kV and 160 kV, where printed circuit board substrates and SAC305 solder joints are routinely characterized. For heavy copper power electronics applications imaged at 220 kV, tungsten carbide spheres provide sufficient absorption contrast against dense background metal structures.
- Metrological baseline verification measures the physical artifact on a tactile coordinate measuring machine to establish certified center-to-center distances.
- X-ray magnification alignment positions the calibration phantom at exact operational source-to-object distances matching production board geometries.
- Voxel scale factor assignment adjusts reconstruction coordinate matrices until calculated sphere centroids match certified reference dimensions.
- Detector tilt compensation calculates rotation and skew angles of the digital panel using asymmetric projection profiles of corner-mounted reference spheres.
| Sphere Material | Sphericity Grade | Thermal Expansion (10⁻⁶/K) | Attenuation at 130 kV (cm⁻¹) | Target Inspection Matrix |
|---|---|---|---|---|
| Silicon Nitride (Si3N4) | Grade 5 (0.13 µm) | 3.2 | 1.85 | Silicon dies and flip-chip bumps |
| Ruby (Al2O3 + Cr) | Grade 10 (0.25 µm) | 5.4 | 2.10 | Standard SMT boards and BGAs |
| Sapphire (Pure Al2O3) | Grade 10 (0.25 µm) | 5.3 | 2.08 | Multi-layer ceramic substrates |
| Titanium Alloy (Ti-6Al-4V) | Grade 25 (0.63 µm) | 8.6 | 8.45 | Power modules and copper bars |
| Tungsten Carbide (WC) | Grade 25 (0.63 µm) | 4.9 | 42.10 | Automotive power hybrid joints |
Calibrating an inline inspection system with sphere arrays prior to running high-reliability production lots ensures dimensional measurement stability down to the voxel limit of the detector setup.

Attenuation
X-ray spectrum hardening occurs as polychromatic beams penetrate dense metallic structures inside electronic packages. Low-energy photons absorb preferentially in outer copper layers and solder joints, shifting the mean energy of the transmitted beam toward higher keV levels. When uncompensated, this effect manifests in reconstructed cross-sections as cupping artifacts, where homogeneous solder joints appear dense at their perimeter and hollow at their center.
These radiometric distortions corrupt automated threshold algorithms, causing false reporting of central joint voids on bottom-terminated components.
Polymaterial reference step wedges and density phantoms enable empirical correction of beam hardening profiles across production voltage ranges. Tube voltage changes X-ray output. By capturing projection data through known thicknesses of aluminum, copper, and tin-lead or lead-free foils, system software constructs non-linear attenuation lookup tables.
These calibration curves map measured attenuation values back to true material density, smoothing grey-value responses across complex circuit board geometries.

Polymaterial Phantoms for Beam Hardening Compensation
Reconstruction algorithms encounter non-linear absorption profiles when evaluating copper power planes and lead-free solder interconnects simultaneously. Copper scatters polychromatic X-ray beams. A single-material phantom fails to capture the spectral shifting caused by multi-element electronic hardware.
Effective attenuation standards incorporate stacked planar steps composed of high-purity copper, aluminum alloy 6061, and SAC305 foil sheets, representing the precise material ratios present on production circuit boards.
Step wedge phantoms are scanned at varying power settings to construct beam hardening correction polynomials. The inline micro-CT computer applies these mathematical polynomials to raw projection frames before executing filtered back-projection or iterative volumetric reconstruction algorithms. Correcting beam hardness at the projection level stabilizes grey values, ensuring that a twenty percent void in a quad-flat no-lead center pad yields identical absorption density regardless of adjacent ground plane copper thickness.
Compliance with VDI VDE 2630 Part 1.3 requires documented sphere distance errors across the full volumetric field of view before inline pass fail limits take effect.
Calibrating Grey Value Curves for Void Volume Metrics
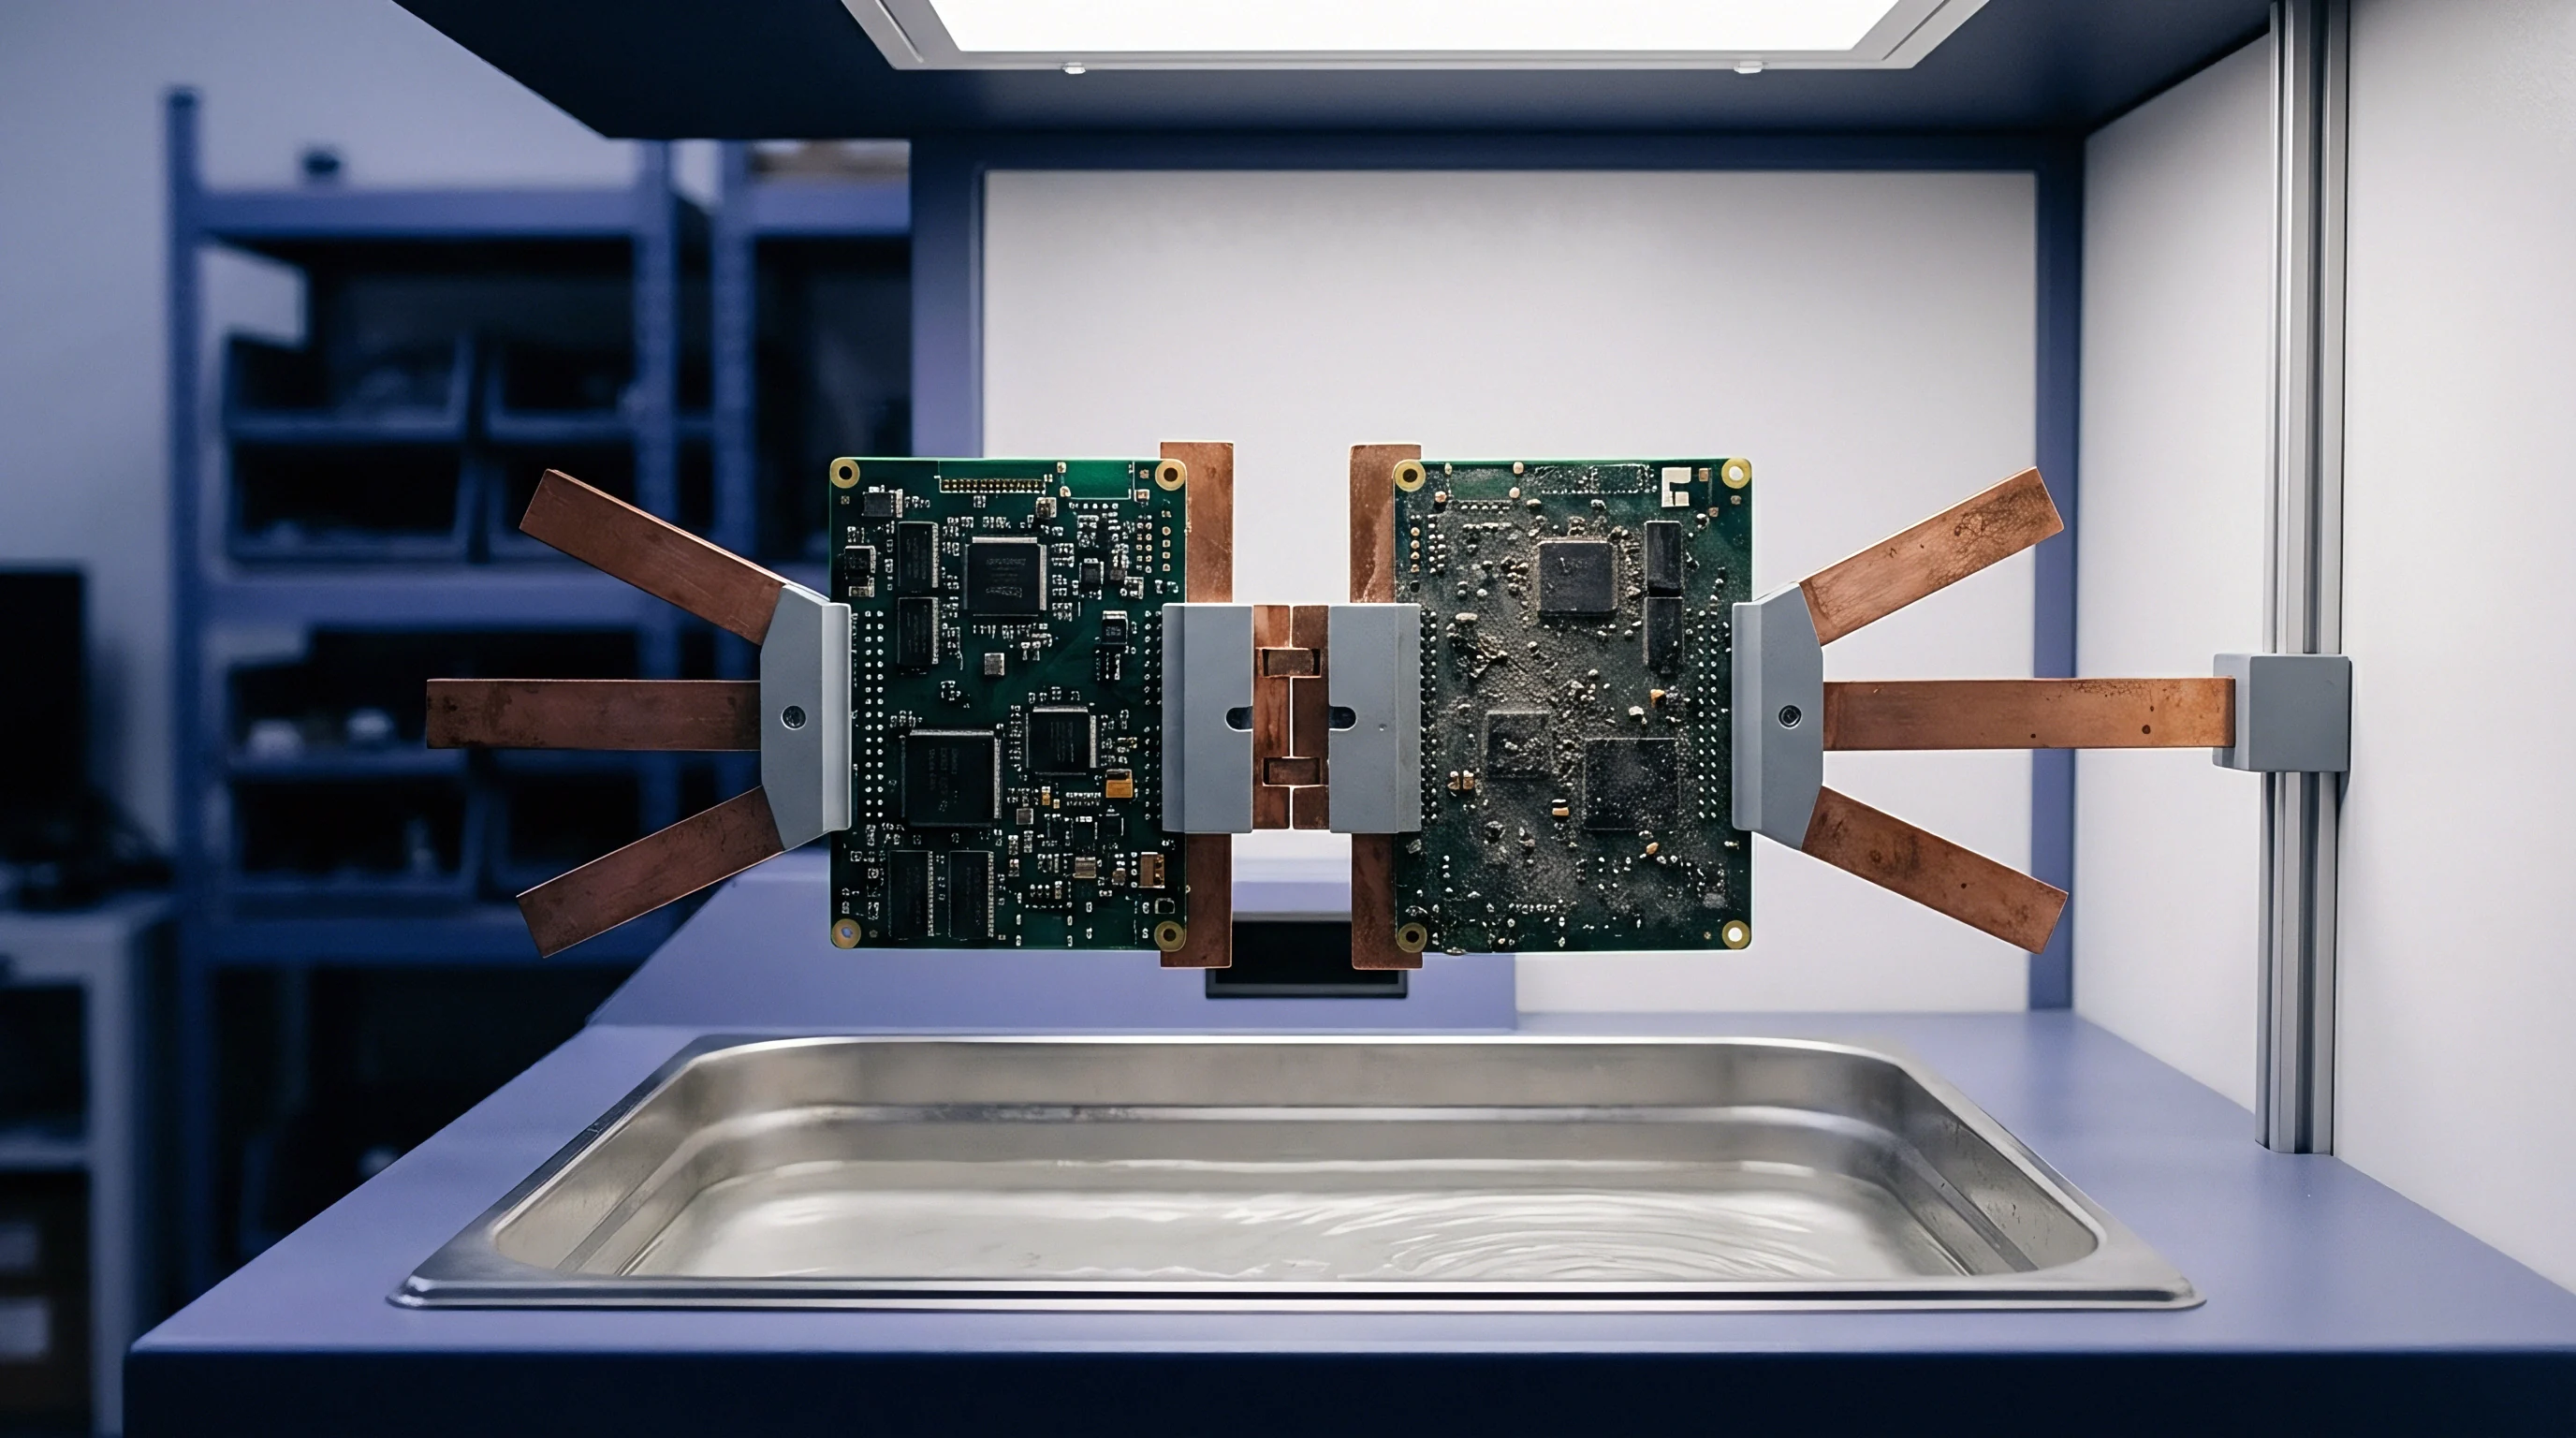
Converting raw reconstructed voxel intensity into true physical void volume requires empirical mapping against standardized step targets. Automated defect recognition software identifies voids by segmenting dark voxel clusters within the brighter solder joint volume. If the grey-value histogram spreads due to scatter radiation or detector lag, segmentation thresholds shift, causing under-reporting or over-reporting of void fractions.
Grey-scale reference phantoms contain micro-cavities of precisely known volume laser-drilled into solid metallic discs. Scanning these standards establishes absolute voxel intensity baselines for zero percent density (air voids) and one hundred percent density (solid SAC305 alloy). The software maps intermediate grey values using polynomial curve fits, yielding robust surface determination limits for volumetric segmentation algorithms.
- Aperture filtering match selects metallic beam filters that pre-harden the X-ray spectrum to minimize cupping on dense copper panels.
- Scintillator grey level target sets tube current to drive unattenuated beam intensity to eighty percent of detector saturation limits.
- Dynamic range utilization verifies that solder joint projections span at least twelve bits of a sixteen-bit detector output scale.
- Beam hardening correction polynomial applies third-order linear transform equations to projection data before volumetric reconstruction starts.
| Target Voltage (kV) | Filter Material & Thickness | Aluminum Step Transmission (%) | Copper Step Transmission (%) | Dynamic Range Depth (Bits) |
|---|---|---|---|---|
| 100 | 0.2 mm Diamond / Carbon | 68.4 | 12.1 | 13.8 |
| 130 | 0.5 mm Aluminum | 79.2 | 28.5 | 14.6 |
| 150 | 0.25 mm Copper | 84.1 | 41.2 | 15.1 |
| 180 | 0.5 mm Copper | 89.6 | 56.3 | 15.4 |
X-ray tube suppliers frequently state that software algorithms eliminate beam hardening without hardware filtering, but floor results demonstrate that unfiltered polychromatic beams degrade edge definition on inner-row BGA joints regardless of post-processing routines.
Metrology
Volumetric measurement accuracy in high-speed automated production inspection hinges on eliminating kinematic and thermal drifts from the acquisition pipeline. Industrial micro-CT systems operating inline substitute rapid gantry rotation or high-speed board translation stages for static laboratory sample mounts. Mechanical vibration from conveyor stop-and-go actions introduces spatial jitter into two-dimensional projection sets.
When back-projection algorithms combine jittered projections, reconstructed feature boundaries blur, inflating calculated measurement uncertainty beyond allowable gauge repeatability limits.
Standardized metrology artifacts quantify sphere distance errors, probing errors, and spatial resolution boundaries under full production line speeds. Evaluating an inline micro-CT cabinet using standards compliant with ISO 10360-11 and VDI/VDE 2630 Part 1.3 establishes absolute performance limits. These measurements verify whether an automated system can reliably classify solder joint shapes, micro-via fill percentages, and component lead alignment against tight tolerance specifications.

Can Inline Micro CT Achieve Sub Micron Traceability?
Sub-micron volumetric accuracy remains elusive in high-speed inline environments due to conveyor dynamics and focal spot expansion. High-power X-ray operations demand target currents that broaden the electron focal spot from a sub-micron point to three or four micrometers. Thermal expansion of the tube target further degrades spatial sharp focus over continuous operating shifts.
Conveyor vibration degrades spatial resolution. Under these conditions, claiming sub-micron feature traceability on a twenty-second production scan cycle contradicts physical measurement limits.
Traceable accuracy at inline speed relies on calibrating sphere distance errors across defined test volumes. A calibrated artifact containing twenty-five ruby spheres is scanned using the high-speed inline production preset. Calculated sphere-to-sphere distances are evaluated against certified physical coordinates.
The difference defines the system sphere distance error (ESD), establishing the expanded uncertainty bounds for all subsequent dimensional measurements taken on client assemblies.
Consider a worked measurement calculation for a ball grid array solder joint void requirement. A tier-one automotive client specifies that no individual void inside a steering control module BGA joint may exceed 50 micrometers in effective diameter, with an expanded measurement uncertainty (U) below 5 micrometers. An inline micro-CT system operates at a 15-micrometer voxel resolution setting to meet the 18-second cycle time limit.
At 15 micrometers per voxel, a 50-micrometer void spans approximately 3.3 voxels in diameter.
If the sphere distance error calculated from the calibration artifact scan shows an uncertainty of 0.8 voxels due to focal spot blur and rotation stage runout, the physical dimensional uncertainty equals 0.8 multiplied by 15 micrometers, resulting in a measurement uncertainty of 12 micrometers. This 12-micrometer uncertainty exceeds the client allowable limit of 5 micrometers, rendering the 15-micrometer scan mode non-compliant for production release. To achieve compliance, the inline system must increase geometric magnification to yield a 6-micrometer voxel size, reducing spatial measurement uncertainty down to 4.8 micrometers while requiring line balancing adjustments to accommodate the longer acquisition time.
Artifact calibration frequency matches the ambient thermal drift cycle of the inline inspection cabinet.
Spatial Resolution Targets and Modulation Transfer Evaluation
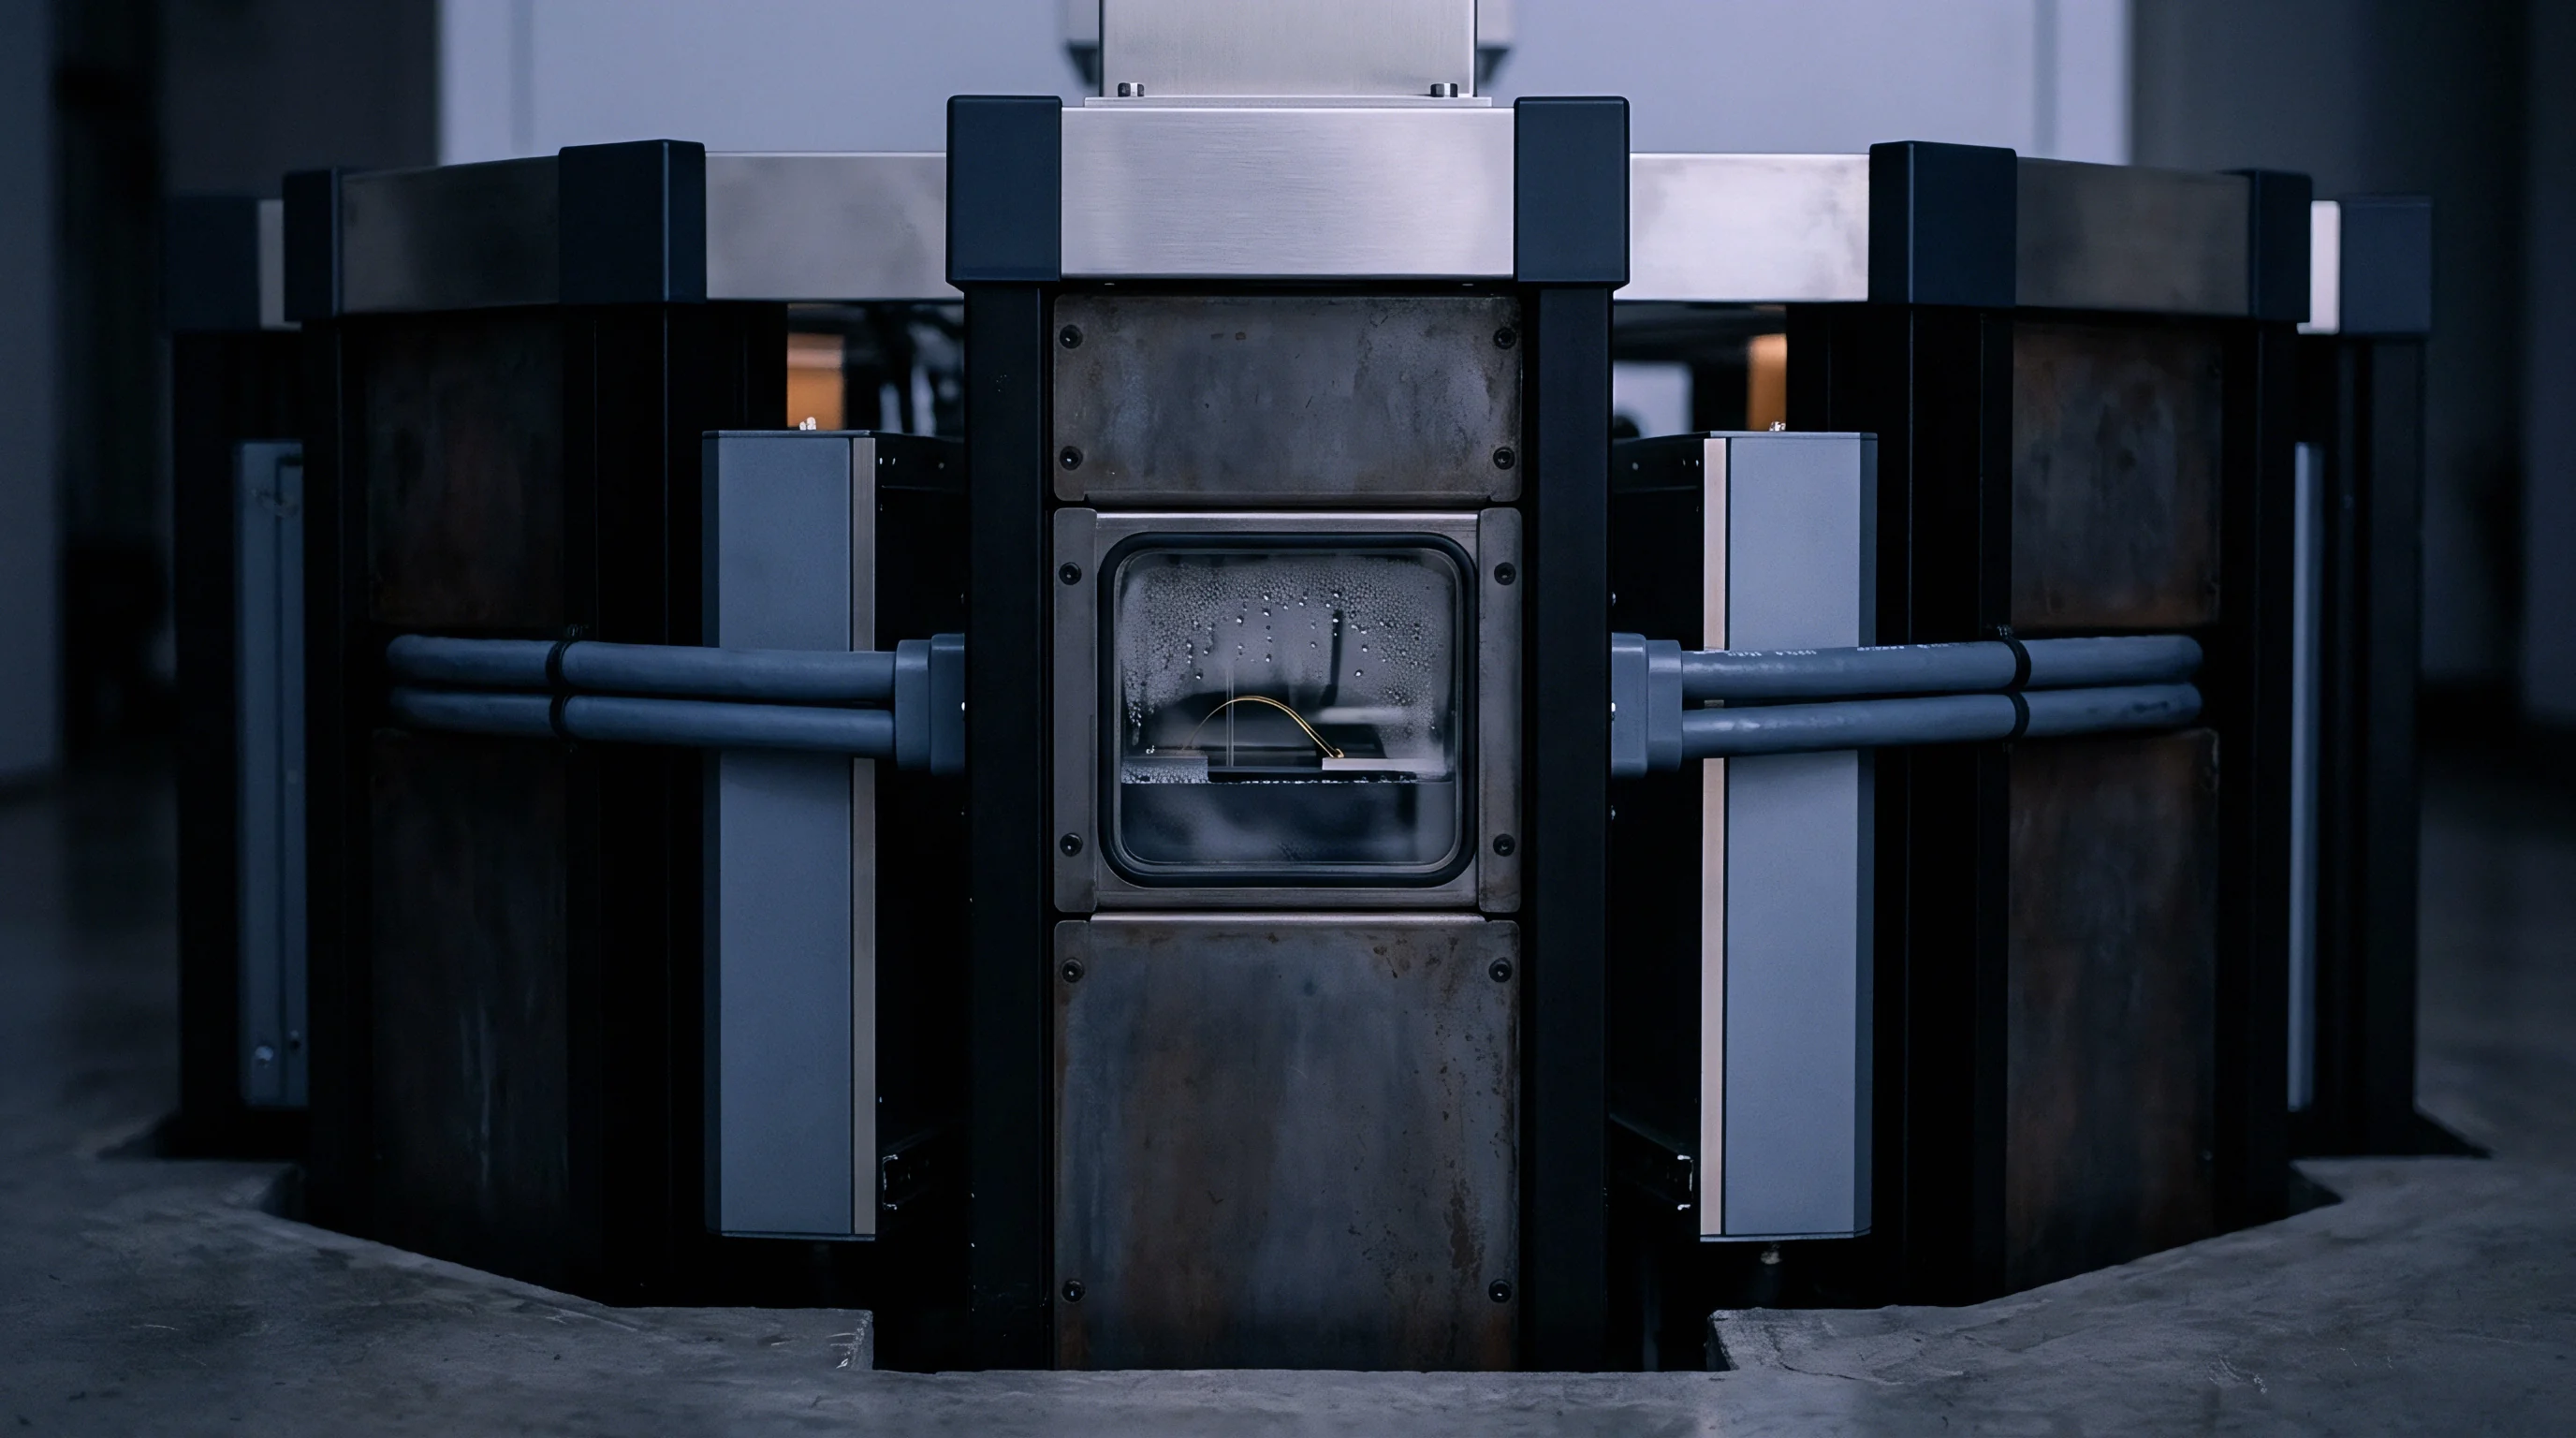
Defining the limits of defect detection requires objective determination of system spatial frequency responses. Siemens star targets, wire pair artifacts, and high-density tungsten edge blocks provide measurable optical transfer functions for three-dimensional X-ray systems. Scintillators degrade under continuous exposure.
As scintillator screens age under continuous radiation exposure, optical light output degrades and spatial resolution drops, reducing the system capability to resolve fine features like micro-cracks inside lead-free solder joints.
Evaluating spatial resolution involves scanning a high-precision resolution phantom containing electroformed tungsten lines ranging from 0.5 micrometers to 20 micrometers in width. Automated analysis software calculates the Modulation Transfer Function (MTF) across the image field, identifying the 10 percent modulation limit. This 10 percent MTF frequency marks the absolute physical threshold for resolving adjacent void boundaries or narrow solder bridges.
- Focal spot thermal bloom expands source spot diameter as tube target wattage increases, inducing phase-contrast blurring across high-magnification projection images.
- Scintillator lag image ghosting carries persistent optical fluorescence from previous board projections into current frames during rapid panel indexing.
- Rotation stage runout introduces eccentric spatial wobble during projection acquisition, causing radial unsharpness in reconstructed cross-sections.
- Voxel distortion at detector edges produces cone-beam magnification errors when imaging large-format circuit panels near detector boundary limits.
Contractually, standard purchase specifications invoking ISO 10360-11 require suppliers to prove sphere distance error bounds across five distinct positions inside the volumetric field of view before production equipment sign-off occurs.


Uncertainty
Quantifying total volumetric measurement errors requires combining contributions from mechanical positioning, optical magnification, and radiation physics. In accordance with the Guide to the Expression of Uncertainty in Measurement, an inline micro-CT inspection system operates within a combined uncertainty budget (uc) that accounts for both systematic and random error components. Omitting environmental factors, such as ambient temperature swings or line vibration, results in overly optimistic measurement capability claims that fail under audit conditions.
Evaluating uncertainty sources involves isolating hardware components, software reconstruction variations, and material scattering behaviors. Thermal drift shifts focal spots. Voxel size sets feature resolution.
When an automated system segments a void or measures lead coplanarity, total expanded uncertainty (U) determines whether measured dimensions fall safely within quality specification limits or sit inside a region of ambiguity that demands product rejection.
Thermal Drift and Mechanical Kinematic Errors
X-ray tube filaments operate at elevated temperatures that induce thermal expansion in the tube housing and mounting frame. As an inline machine runs continuously through a eight-hour shift, the X-ray focal spot drifts several micrometers from its cold start position. Unchecked focal spot migration continuously alters geometric magnification, shifting voxel dimensions mid-production and corrupting automated volume calculations.
Mechanical manipulators carrying heavy circuit panels or rotating gantry systems experience kinematic repeatability errors. Backlash in motor drives, stage tilt under uneven load, and conveyor rail misalignment introduce systematic geometric shifts. Calibrating these systems using low-expansion physical reference standards maps kinematic errors across the motion volume, enabling real-time software compensation matrices to correct projection geometries before reconstruction algorithms execute.
Inline computed tomography systems measure joint integrity against calibrated physical standards rather than unverified CAD models.
Reconstruction Algorithm Artifacts and Ring Suppression
Filtered back-projection routines translate two-dimensional projection images into three-dimensional volumetric representations. Detector pixel response variations create concentric ring artifacts centered on the rotation axis in reconstructed slices. Ring artifacts obscure void boundaries.
Uncorrected ring patterns disrupt grey-value intensity thresholds, creating artificial density variations that automated software misinterprets as internal solder voiding or material delamination.
Iterative reconstruction techniques and advanced ring filtering algorithms reduce these visual errors, but aggressive filtering risks smoothing genuine small-scale defects. Calibration cycles prevent false rejects. Scanning homogeneous reference cylinders made of acrylic or aluminum provides zero-contrast flat fields that allow detection algorithms to isolate individual pixel response anomalies, creating precise pixel gain corrections that eliminate ring structures without degrading spatial sharpness.
- Mount the certified reference phantom securely on the inline manipulator stage using low-density foam fixtures.
- Execute an automated calibration scan sequence employing the exact exposure, voltage, filtering, and projection counts assigned to production board recipes.
- Extract three-dimensional center coordinates for all embedded reference spheres using gradient-based surface determination routines.
- Calculate sphere distance errors for all pair combinations and evaluate values against certified calibration limits.
- Update voxel scale correction factors and geometric projection matrices in the reconstruction engine.
- Log calibration parameters, focal spot drift values, and temperature readings into the permanent line release database.
| Uncertainty Component Source | Standard Uncertainty (ui) | Probability Distribution | Sensitivity Coeff. (ci) | Uncertainty Contribution (µm) |
|---|---|---|---|---|
| Artifact Calibration Certificate | 0.12 µm | Normal (k = 2) | 1.00 | 0.06 |
| Thermal Drift of Frame (2°C ΔT) | 0.85 µm | Rectangular | 0.58 | 0.49 |
| Focal Spot Position Drift | 1.20 µm | Rectangular | 0.58 | 0.70 |
| Rotation Axis Kinematic Runout | 0.90 µm | Normal (k = 1) | 1.00 | 0.90 |
| Threshold Surface Determination | 1.50 µm | Triangular | 0.41 | 0.62 |
Relying on factory default calibration tables without executing shift-level reference artifact validation causes inspection limits to drift beyond engineering allowances, resulting in scrap false-call spikes or undetected field escapes.

Paperwork
Documenting inspection capability ensures that quality release decisions stand up to external customer audits and regulatory scrutiny. High-reliability manufacturing sectors, including automotive safety systems, aerospace avionics, and implantable medical hardware, require traceable proof of inspection system performance. Calibration records serve as legal proof that an inline micro-CT machine maintained verified dimensional accuracy and defect detection thresholds during production runs.
A complete quality dossier links physical artifact certificates back to individual production board serial numbers. Calibration certificates issuing from ISO/IEC 17025 accredited metrology laboratories provide the foundational link to SI units, documenting exact sphere dimensions, material expansion coefficients, and measurement uncertainties. Integrating these calibration metrics into factory execution systems automates compliance verification, preventing production lines from indexing panels when calibration intervals expire.
ISO 17025 Traceability and Gauge Repeatability
Calibration certificates issuing from accredited laboratories establish an unbroken chain of measurement standards back to national metrology institutes. For an inline micro-CT machine, accreditation documentation must state the specific measurement procedures used to certify reference sphere artifacts, complete with temperature histories and expanded uncertainty values. Maintaining physical artifacts inside controlled storage units prevents surface oxidation or mechanical damage that alters reference dimensions over time.
Gauge Repeatability and Reproducibility (Gauge R&R) studies evaluate system performance across multiple operators and production shifts. A standard CT gauge R&R protocol involves scanning a calibrated phantom ten consecutive times across three separate shifts without clearing system settings. A acceptable inline system demonstrates a Precision-to-Tolerate (P/T) ratio below ten percent for critical defect measurements, proving that automated inspection results reflect true product variations rather than machine noise.
Line Release Qualification Dossier Requirements
Production line acceptance protocols mandate complete records of standard artifact measurements taken across consecutive shifts. A compliant line release dossier contains the physical artifact serial numbers, ISO 17025 calibration certificates, shift calibration logs, temperature trends, and raw projection evaluation files. Unverified algorithms hide joint defects.
Quality release protocols require uploading calibration results directly to centralized statistical process control software. If a daily reference scan reveals sphere distance errors exceeding predefined control limits, the inspection cell automatically locks down, preventing unverified boards from moving to downstream packaging stages. Quality engineers review the calibration trend data, perform X-ray tube alignment or mechanical maintenance, and re-run standard reference artifacts to re-authorize production line release.