Traceable Reference Artifact Calibration for Micro-CT Solder Void Quantification Accuracy
Traceable reference artifacts calibrate micro-CT void measurement by correcting beam hardening and threshold bias to achieve sub-percent volumetric uncertainty.
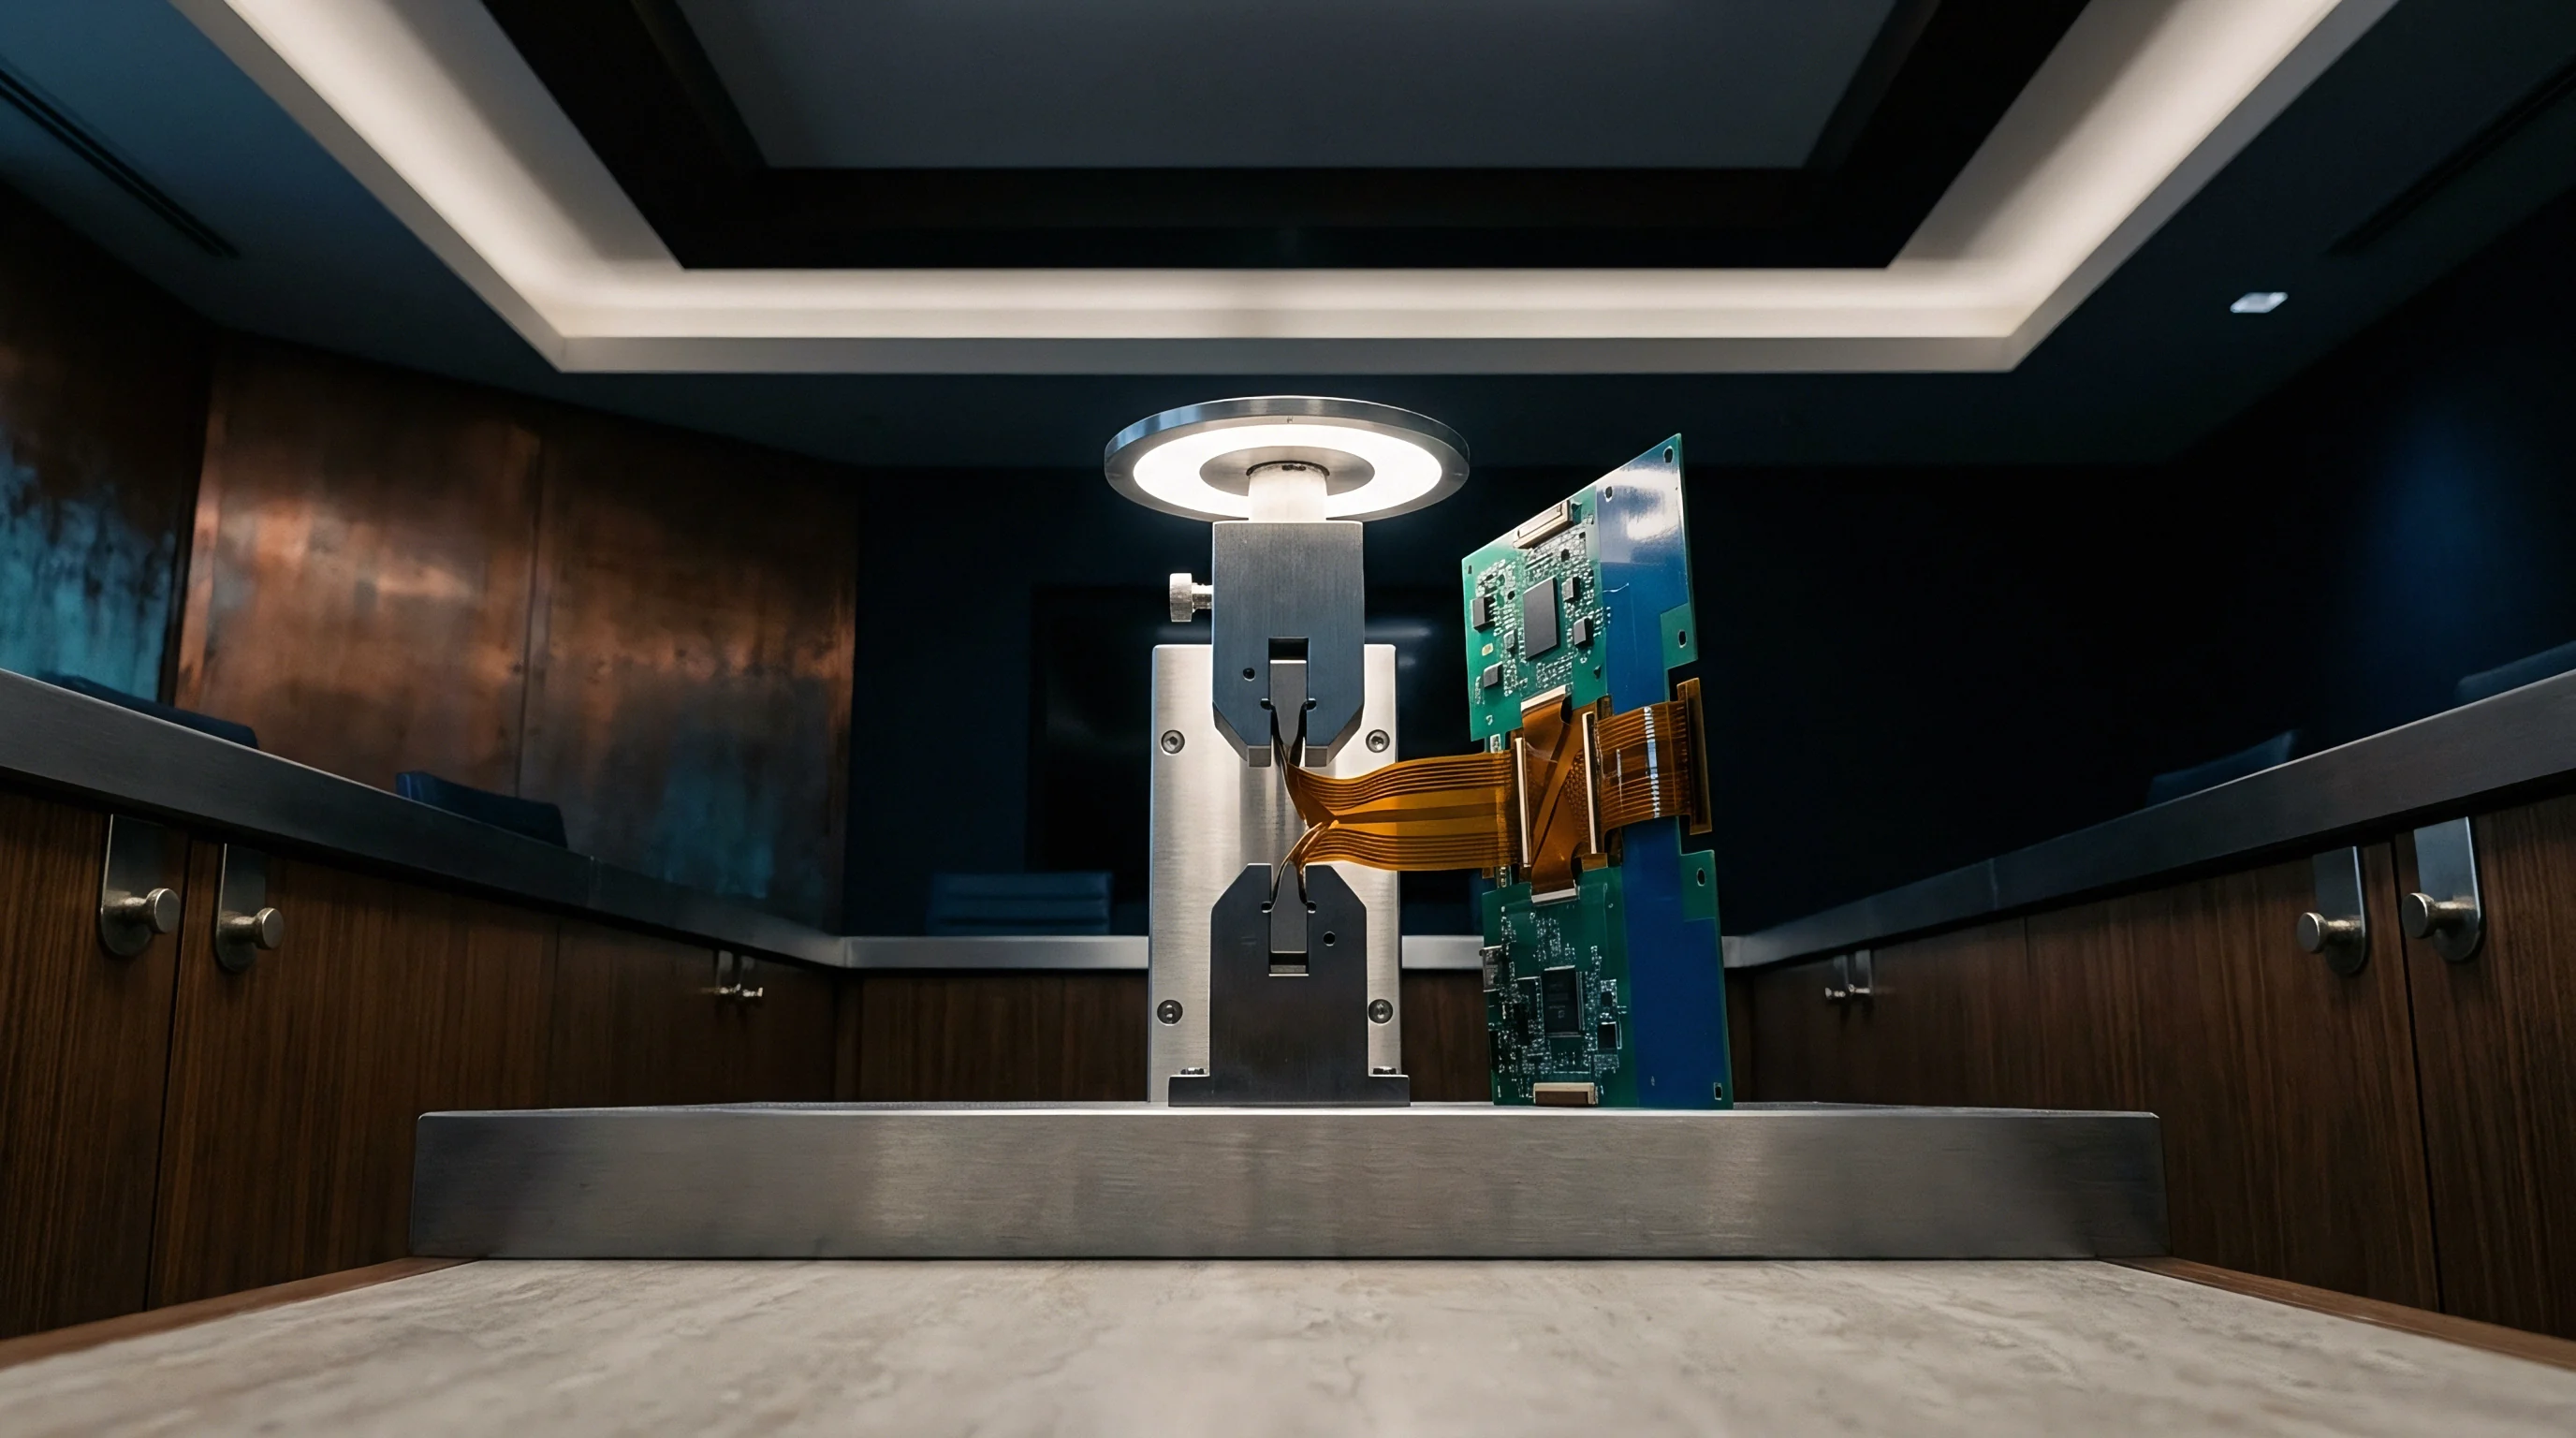
Phantom
Physical calibration of high-resolution computed tomography systems relies on dimensional reference standards constructed with certified geometric features. Solder joints fail under high thermal strain. When quantifying internal void volume fractions inside lead-free interconnects, uncalibrated X-ray volumetric measurements routinely introduce systemic errors exceeding fifteen percent of total void volume.
These deviations originate from beam interaction dynamics, optical magnification shifts, and algorithmic binarization choices. Establishing metrological traceability requires reference objects engineered with known inclusion geometries, validated independently through tactile or optical coordinate measurement machines calibrated to national standards.

Traceable Reference Artifact Design
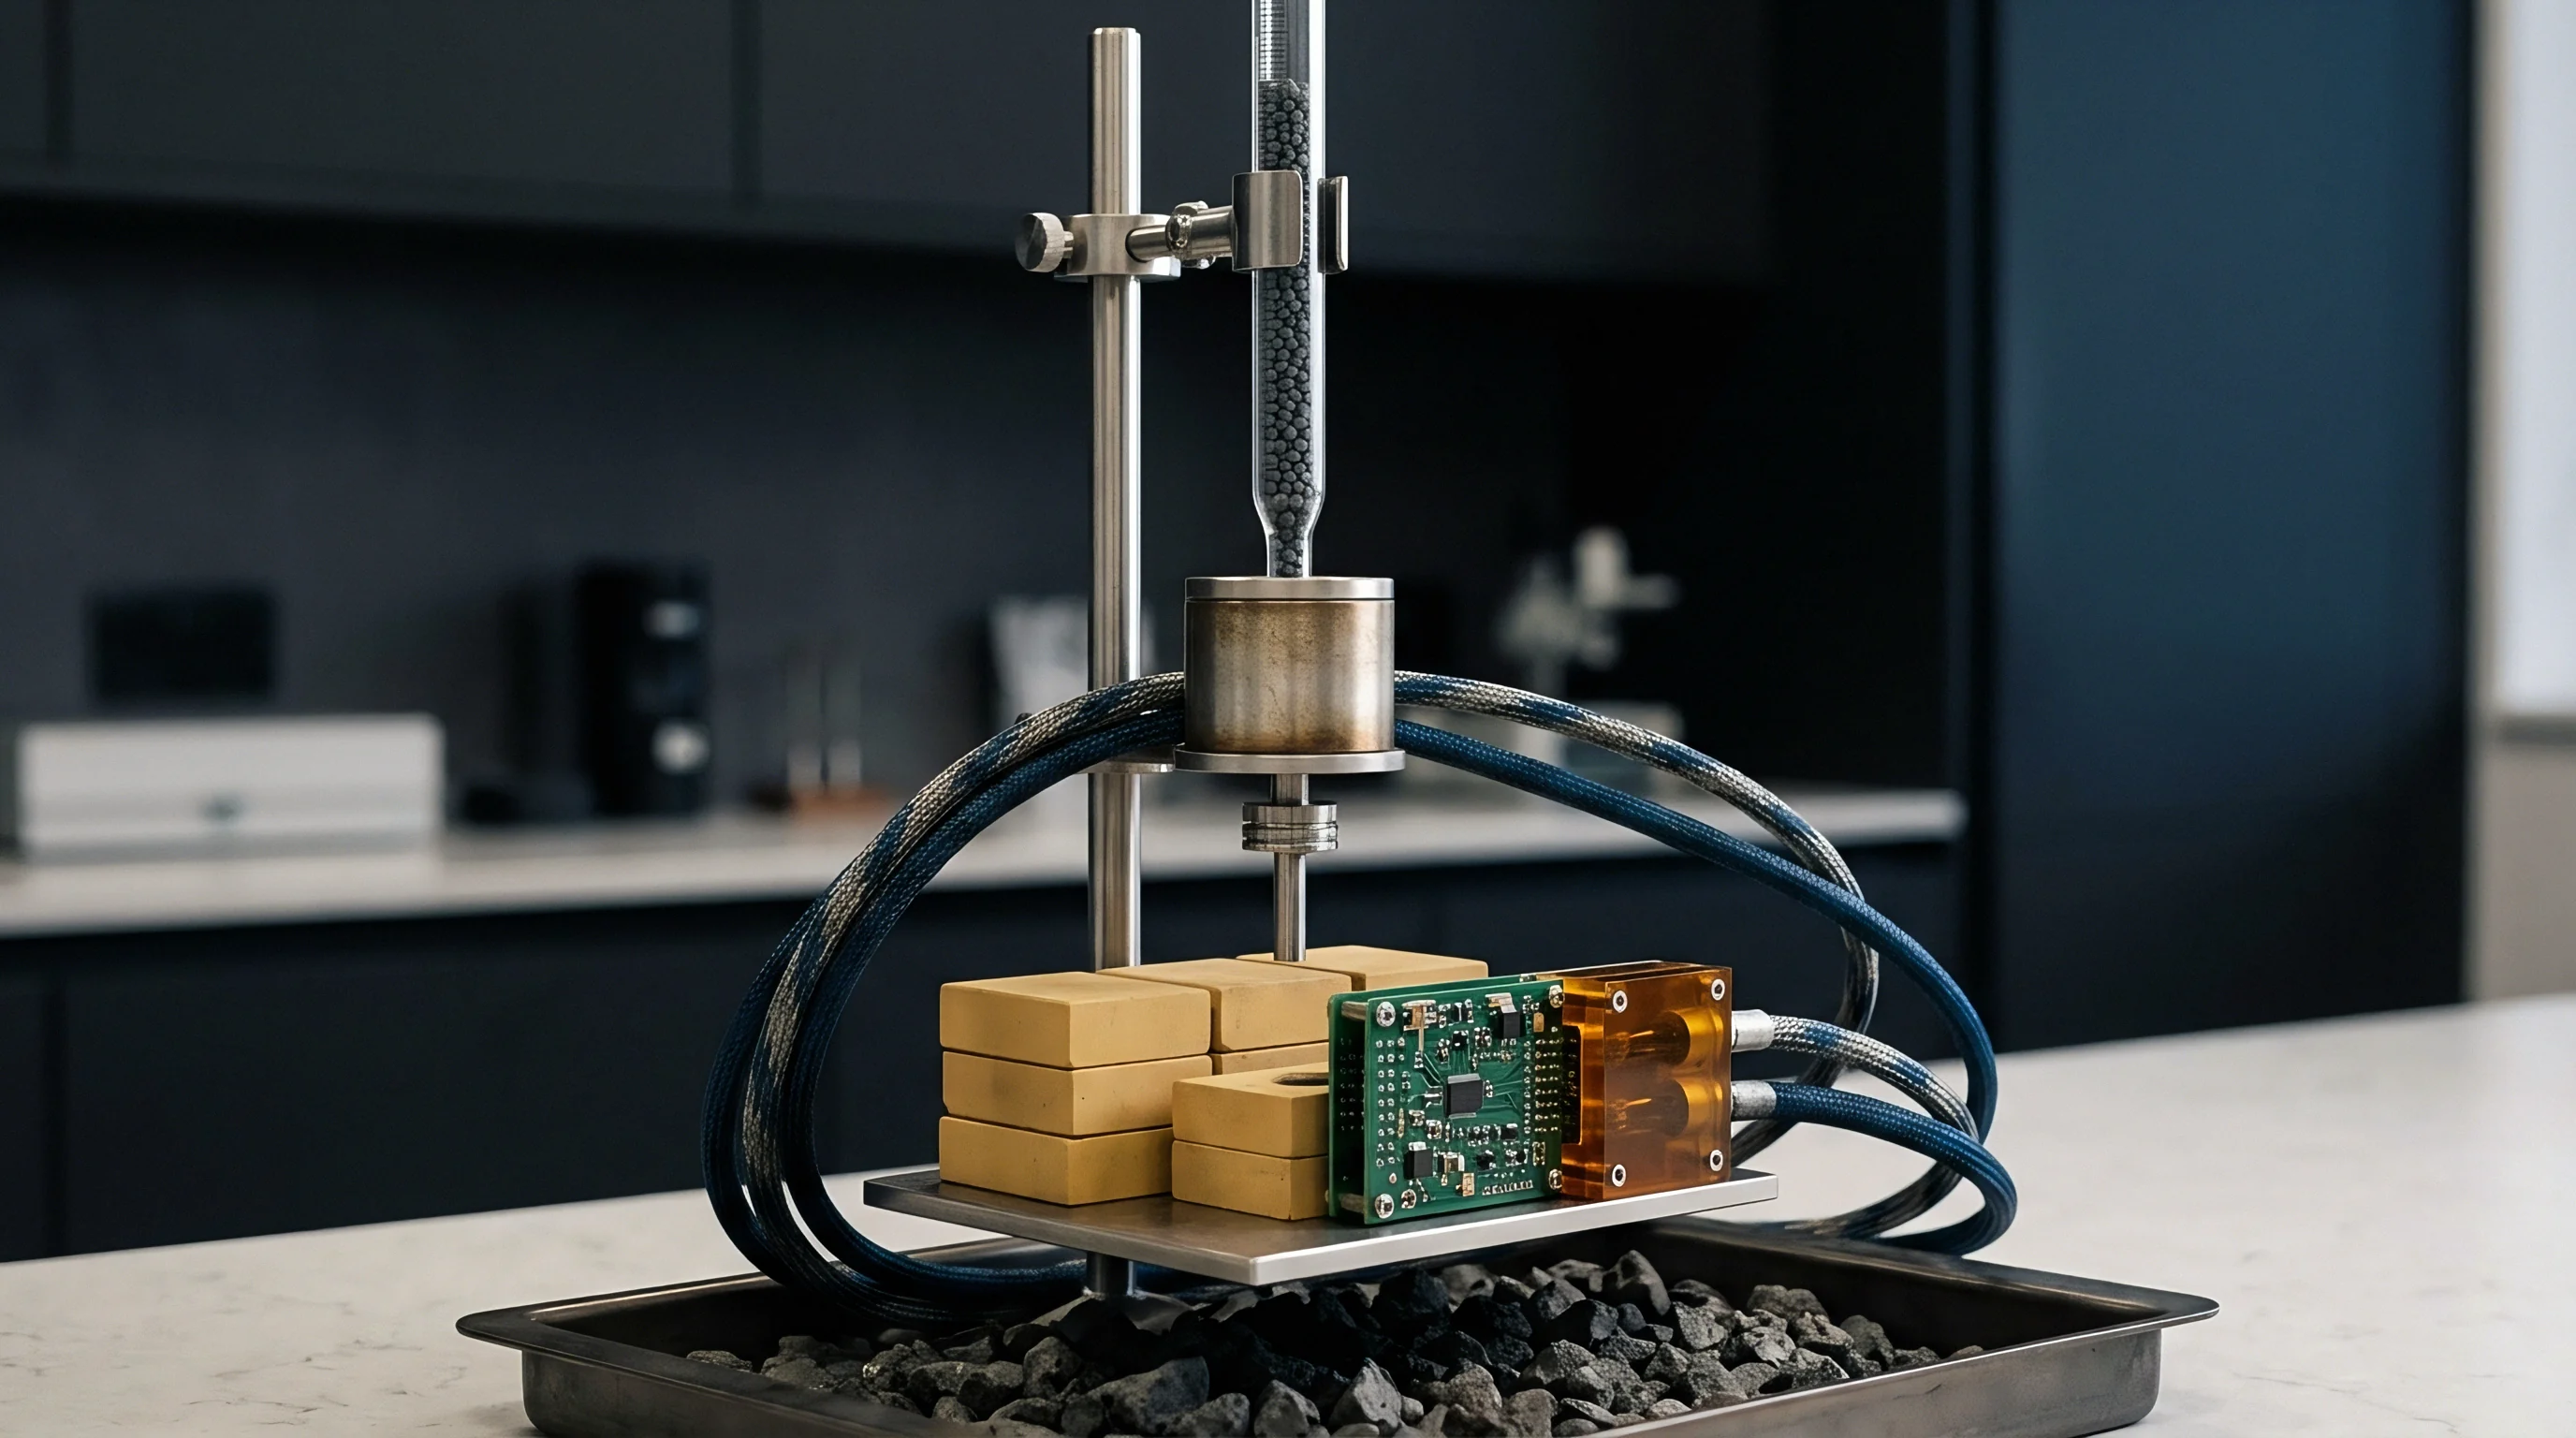
Synthetic reference bodies integrate low-density spheres into metallic or polymeric substrates to mimic solder voiding dynamics. Precision manufacturing utilizes spherical borosilicate glass beads, hollow microspheres, or vacuum-etched silicon cavity matrices embedded within matrices of aluminum, epoxy resin, or copper-doped alloys. The physical dimensions of embedded inclusions range from five micrometers to five hundred micrometers, spanning the entire defect size distribution observed in quad-flat no-lead and ball grid array assemblies.
Traceability demands an unbroken chain of optical measurements. Certified coordinate measuring machines establish sphere diameters with expanded uncertainties below fifty nanometers. These reference spheres sit arranged in precise three-dimensional spatial arrays inside the substrate, providing simultaneous dimensional calibration across spatial axes during a single rotational scan sequence.
Compliance with VDI/VDE 2630 Part 1.3 demands that structural threshold determinations reference physical artifacts certified within the same atomic number range as the assembly substrate.
Artifact construction must account for thermal stability during high-intensity X-ray exposure. Temperature increases within the micro-CT cabinet alter substrate dimensions, introducing thermal strain vectors that warp spatial grids. High thermal conductivity substrates like aluminum alloy 6061 mitigate localized heat buildup, stabilizing spatial geometry throughout multi-hour acquisition routines.
Material Contrast Characteristics
X-ray attenuation differences between inclusions and surrounding matrix materials determine the signal-to-noise ratio in volumetric reconstructions. Matching the effective atomic number of the artifact matrix to that of common solder alloys, such as Sn96.5Ag3.0Cu0.5 or Sn63Pb37, presents physical manufacturing challenges due to high metal density. Substrates constructed from high-density materials cause severe photon absorption, demanding higher X-ray acceleration voltages that alter inclusion contrast.
Dual-material reference artifacts solve attenuation matching by embedding known void inclusions within a stepped matrix. The stepped design provides varying material paths, allowing calibration across different solder thickness profiles found on actual printed circuit board assemblies.
- Substrate Material Inhomogeneity Local density fluctuations in the aluminum matrix alter local photon absorption.
- Sphere Dimensional Tolerance Diameter deviations in borosilicate inclusions introduce systemic offset into calibration models.
- Interface Micro-Cracking Thermal stress during artifact curing forms micro-gaps surrounding embedded inclusions.
- Thermal Expansion Coefficient Mismatch Temperature shifts during scan cycles shift physical feature spacing within the reference matrix.
Calibration certificates issued under ISO/IEC 17025 clause 7.8.2 mandate reporting expanded measurement uncertainty alongside coverage factors for each embedded feature dimension. This documentation establishes the baseline truth required to adjust volumetric image processing software against physical reality.

Beam
X-ray emission spectra generated by micro-focus tubes exhibit polychromatic photon distributions that shift as radiation traverses heavy metal assemblies. X-ray photons attenuate exponentially through metals. Low-energy photons absorb preferentially near the outer surfaces of dense solder pads, causing spectral hardening across the penetration path.
Reconstruction algorithms assuming monochromatic radiation translate this differential absorption into artificial density gradients, producing cupping artifacts where solid solder pad centers appear hollow.

Polychromatic Hardening and Cupping Errors
Low-energy photons undergo preferential absorption when passing through tin-silver-copper solder joints. High voltage increases beam penetration depth. The remaining spectrum consists predominantly of high-energy photons, artificially elevating reconstructed linear attenuation values at pad peripheries relative to joint centers.
Solder void quantification software mistakes these artificial low-density interior regions for physical voiding, inflating calculated void volume fractions.
Physical pre-filtering removes low-energy photons before they strike the target component. Thin sheets of copper, aluminum, or brass placed over the X-ray tube exit window harden the emission spectrum prior to sample interaction, flattening the reconstructed density profile across solid solder regions.
Physical beam filtering remains indispensable when scanning heavy lead-free solder arrays on thick copper ground planes.
Filtering reduces low-energy photon intensity, lowering overall signal levels reaching the flat-panel detector. System operators compensate for reduced flux by increasing tube current or extending integration time per projection, raising total scan duration and operational line cost.

Focal Spot Expansion Dynamics
Thermal dissipation at the tungsten target causes geometric enlargement of the photon source point during prolonged scanning runs. Focal spots expand under continuous heat. Target degradation broadens the emission area from a point source into an elliptical spatial spot, introducing geometric penumbra blur across target edges.
Penumbral blur softens sharp physical density boundaries between solder matrix and gas voids. Blur zones obscure void boundaries, causing sub-voxel edge detection routines to miscalculate boundary locations.
System drift degrades spatial accuracy over time. Water-cooled reflection targets and diamond-backed transmission targets stabilize focal spot diameters under continuous power loads, preserving high spatial frequency clarity across long scan sequences.
| Material Name | Material Composition | Density (g/cm³) | Linear Attenuation Coefficient µ (cm⁻¹) |
|---|---|---|---|
| Solder Alloy SAC307 | Sn96.5Ag3.0Cu0.5 | 7.38 | 12.45 |
| Lead Solder Sn63Pb37 | Sn63Pb37 | 8.40 | 18.92 |
| Copper Substrate Cu | Cu 99.9 | 8.96 | 10.15 |
| Borosilicate Inclusion | SiO2/B2O3 | 2.23 | 0.48 |
| Aluminum Matrix Al 6061 | Al Mg Si | 2.70 | 0.56 |
Equipment manufacturers frequently assert that automated software correction modules eliminate the need for hardware pre-filtering, yet unfiltered scans of thick solder pads consistently exhibit residual cupping artifacts that distort void fraction accuracy.

Voxel
Spatial sampling in three-dimensional reconstruction converts continuous linear attenuation measurements into discrete volumetric grid points. Voxel size dictates minimum void resolution. Geometric magnification, governed by the physical distances between X-ray source, sample stage, and flat-panel detector, determines the physical isotropic voxel size of the volumetric dataset.
Accurately resolving micro-voids demands setting voxel side lengths significantly smaller than the targeted defect diameter.

Magnification Scale and Boundary Blur
Geometric positioning between the source and detector establishes the Effective Isotropic Resolution per projection. Dense metals scatter primary radiation photons. Moving the sample closer to the focal spot increases geometric magnification, reducing effective voxel dimensions down to sub-micrometer scales.
Physical sample geometry limits minimum working distance, as wide printed circuit boards collide with the X-ray tube housing during three hundred sixty degree rotations.
Partial volume effects dominate voxel intensity values along physical phase boundaries. When a single volumetric voxel straddles both high-density solder alloy and zero-density void space, its reconstructed attenuation value represents an average of both materials based on their volume fractions within that cube. Voxel intensity gradients define outer boundaries.
Partial volume blurring spreads physical void boundaries across two to three voxel layers. Without sub-voxel edge detection algorithms, volumetric analysis tools misinterpret these blurred gradient zones, systematically overestimating or underestimating void volumes depending on the selected segmentation cutoff.

Spatial Resolution Standards
Optical line-pair grids and wire-target structures measure the Modulation Transfer Function of the imaging system. Modulation Transfer Function curves define spatial frequency response, illustrating how contrast decays as feature sizes approach the nominal voxel dimension. Uncalibrated system blur degrades Modulation Transfer Function performance, merging closely spaced micro-voids into single large virtual voids.
- Mount the calibrated micro-wire alignment phantom on the rotary stage fixture to minimize mechanical vibration.
- Adjust detector source distance to achieve the targeted geometric magnification factor and voxel resolution.
- Acquire three hundred sixty rotational projections using continuous angle step integration.
- Apply center-of-rotation correction software shifts before running the volumetric reconstruction pipeline.
- Extract spatial resolution values from line-spread functions generated across the wire boundaries.
Void feature identification stays stable when the smallest target void diameter spans at least five detector pixels across the unmagnified physical projection.

Threshold
Binarization converts reconstructed gray-scale volumetric data into discrete material and void regions. Global binarization fails on noisy projections. Solder matrices present extreme intensity contrasts against gas inclusions, creating bi-modal gray value histograms.
Algorithmic selection of the precise splitting point between void and metal voxels dictates final void volume measurements.

Which Volumetric Segmentation Method Minimizes micro-CT Void Measurement Bias?
Local gradient surface determination algorithms isolate density transitions by analyzing localized intensity derivative peaks rather than absolute gray values. Global thresholding techniques like Otsu or IsoData evaluate entire volume histograms, placing cutoff values at histogram minimums between material peaks. Polychromatic beam hardening, scattering, and detector non-uniformities distort global intensity values across large solder pads, rendering global cutoff points inaccurate.
Advanced gradient surface determination algorithms search locally for maximum gray-value slope positions along radial ray profiles originating from interior void candidate centers. The ISO 50% surface determination technique defines physical boundaries at the midpoint between local background solder intensity and interior void minimum intensity, neutralizing global gray-value shifts caused by component shielding.
Sub-voxel edge interpolation stabilizes volumetric measurement across high-contrast density transitions.
Global Thresholding Breakdown in High-Contrast Solders
Single-value histogram partitioning fails when beam attenuation variations distort signal intensity across large solder pads. Dense solder arrays attenuate X-rays severely, shifting localized background intensities downward toward the void threshold. A fixed global threshold misclassifies these attenuated solder regions as micro-voids, generating massive false-positive void volumes.
Raw projections require flat-field gain correction. Noise spikes in low-signal projections broaden material peaks in volumetric histograms. Overlapping histogram distributions force global algorithms to place thresholds within overlapping signal zones, introducing random classification errors across batch scans.
Gradient Edge Determination Mechanics
Second-derivative zero-crossing techniques identify material interfaces independently of global illumination variations. Directional gradient vectors locate the physical edge interface where edge slope peaks, interpolating sub-voxel position boundaries down to fractions of a voxel side length.
Sub-voxel edge interpolation refines boundary identification by fitting local gray values to continuous step-response mathematical models. This computational step resolves void boundary positions with spatial precision superior to the raw voxel grid size, recovering actual void morphology.
- Examine Gray Histogram Bimodality Verify that solder matrix and void peak valleys demonstrate distinct intensity separation before selecting algorithmic parameters.
- Select Local Adaptive Filtering Apply gradient-based surface extraction when polychromatic attenuation produces density gradients across larger solder planes.
- Calibrate ISO Surface Percentage Adjust edge determination boundaries against physical artifact sphere diameter standards to eliminate partial volume offsets.
- Validate Sub-Voxel Interpolation Run edge search routines across localized three-dimensional voxels to preserve minor void geometries under ten micrometers.
| Segmentation Method | Algorithm Type | Mean Void Volume Deviation (%) | Standard Deviation (%) | Processing Time per Volume (s) |
|---|---|---|---|---|
| Global Otsu Thresholding | Histogram Bimodal | +14.20 | 3.80 | 1.2 |
| Fixed ISO 50% Surface | Global Midpoint | +5.60 | 1.90 | 4.5 |
| Adaptive Region Growing | Local Neighboring | -3.10 | 1.40 | 12.8 |
| Canny Edge Gradient ISO | Derivative Boundary | +1.20 | 0.60 | 28.4 |
| Calibrated Local Adaptive Derivative | Sub-Voxel Gradient | +0.15 | 0.25 | 45.1 |
Miscalibrated segmentation algorithms in micro-CT volumetric analysis routinely misclassify up to twenty percent of total solder joint volume, causing false rejections of compliant BGA assemblies or letting severe internal voids pass into field service.


Budget
Quantifying volumetric error components requires systematic aggregation of instrumental, material, and algorithmic uncertainties. Calibration reduces inter-operator measurement variance. Calculating total measurement uncertainty according to the Guide to the Expression of Uncertainty in Measurement (GUM) establishes defensible pass and fail boundaries for solder void acceptance.
Standard uncertainties derived from physical artifact calibration, focal spot drift, voxel scaling, and threshold selection combine geometrically to form an expanded uncertainty metric.
Combined Measurement Uncertainty Mathematics
Mathematical formulation of total measurement variance integrates standard uncertainties from physical artifact calibration, focal spot movement, and edge detection. Each individual error source contributes a standard uncertainty value u_i weighted by a sensitivity coefficient c_i that reflects how strongly that parameter impacts final void volume calculations.
Summing squared individual variance contributions yields the combined standard uncertainty u_c. Multiplying u_c by a coverage factor k=2 establishes the expanded uncertainty U at a ninety-five percent confidence level, defining the metrological decision interval for qualification testing.
A twenty-kilovolt shift in tube potential alters calculated solder void volume fraction by up to four percent under fixed exposure conditions.
Volumetric Void Uncertainty Parameters
Tabulating standard deviation contributions across each physical process step provides a defensible expanded measurement error bound. Consider a worked example evaluating a lead-free bottom-terminated component solder joint with a nominal fifteen percent void volume fraction. Physical reference sphere uncertainty contributes 0.05 percent, voxel scaling calibration contributes 0.12 percent, focal spot drift contributes 0.18 percent, and local threshold selection contributes 0.22 percent.
Combining these independent variance terms using the root-sum-of-squares method yields a combined standard uncertainty u_c of 0.31 percent. Applying a coverage factor k=2 yields an expanded uncertainty U of 0.62 percent. Void volumes alter solder thermal resistance.
The true solder void volume fraction sits within the interval of 14.38 percent to 15.62 percent with ninety-five percent statistical confidence.
- Traceability Certificate Attachment Secure physical proof of NIST or NPL optical coordinate measurement machine calibration for all internal reference inclusions.
- Scattered Radiation Correction Log Document physical copper filter thickness and algorithmic scatter reduction parameter settings for each scan profile.
- Reconstruction Parameter File Record projection count, filtering kernels, focal spot power settings, and center-of-rotation offset values.
- Uncertainty Budget Calculation Sheet Provide individual variance contributions, sensitivity coefficients, and final expanded measurement uncertainty at k=2.
| Source of Uncertainty | Symbol | Value u_i (%) | Probability Distribution | Sensitivity Coefficient c_i | Uncertainty Contribution u_i c_i (%) |
|---|---|---|---|---|---|
| Physical Artifact Calibration | u_cal | 0.05 | Normal | 1.00 | 0.050 |
| Voxel Scale Magnification | u_vox | 0.12 | Rectangular | 0.86 | 0.103 |
| Focal Spot Spatial Drift | u_spot | 0.18 | Rectangular | 0.58 | 0.104 |
| Local Surface Segmentation | u_seg | 0.22 | Normal | 1.15 | 0.253 |
| Signal Noise Fluctuations | u_noise | 0.09 | Normal | 0.90 | 0.081 |
| Combined Standard Uncertainty u_c = 0.306%; Expanded Uncertainty U (k=2) = 0.612% (absolute void volume fraction). | |||||
Expanded uncertainty determines pass boundary limits. When test specifications enforce a rigid twenty-five percent maximum void volume limit, an assembly exhibiting a measured void volume fraction of twenty-four.six percent falls within the expanded uncertainty band of an imprecise scanner, rendering the pass result statistically unsupportable.
Criterion
Acceptance threshold definition for electronic packaging relies on establishing clear volumetric limits that correlate with thermal and mechanical survival. Traditional two-dimensional transmission X-ray inspection evaluates void area percentages across projected pad regions. Three-dimensional micro-computed tomography measures true volumetric spatial voids, altering how quality standards apply to high-reliability Class 3 electronics under IPC-A-610 and IPC-7093 specifications.
IPC Specification Compatibility
Converting two-dimensional planar projection void areas into three-dimensional volumetric space alters compliance margins for bottom-terminated components. Planar X-ray inspection sums stacked internal voids into a single overlapping shadow, overestimating effective area coverage when micro-voids align vertically along the beam path. Micro-CT resolves depth, isolating individual void locations across the solder joint height.
IPC-7093 limits total voiding under bottom-terminated component thermal pads to twenty-five percent of total joint area, with single voids capped at nine percent. Direct translation of planar area percentages to volumetric space requires caution, as thin planar voids disrupt heat transfer pathways differently than spherical volumetric voids of equivalent total volume.

Line Qualification Audits
Assembly line verification protocols mandate periodic cross-checking between factory floor inspection tools and laboratory micro-computed tomography systems. Factory inline X-ray inspection units run high-speed projection algorithms prone to scatter noise and beam hardening bias. Calibrated micro-CT volumetric datasets serve as the absolute baseline reference to adjust production line automated X-ray inspection thresholds.
Cross-calibration audits identify systematic threshold drift caused by tube aging, detector gain degradation, or solder paste formulation shifts. Comparing production line pass/fail metrics against micro-CT volumetric reference artifacts ensures that assembly facilities maintain true statistical process control across long production runs.
A critical industry question remains whether international standardization bodies will formally transition from two-dimensional X-ray area thresholds to calibrated three-dimensional volumetric limits across Class 3 high-reliability electronics specifications.