Pressure Distribution
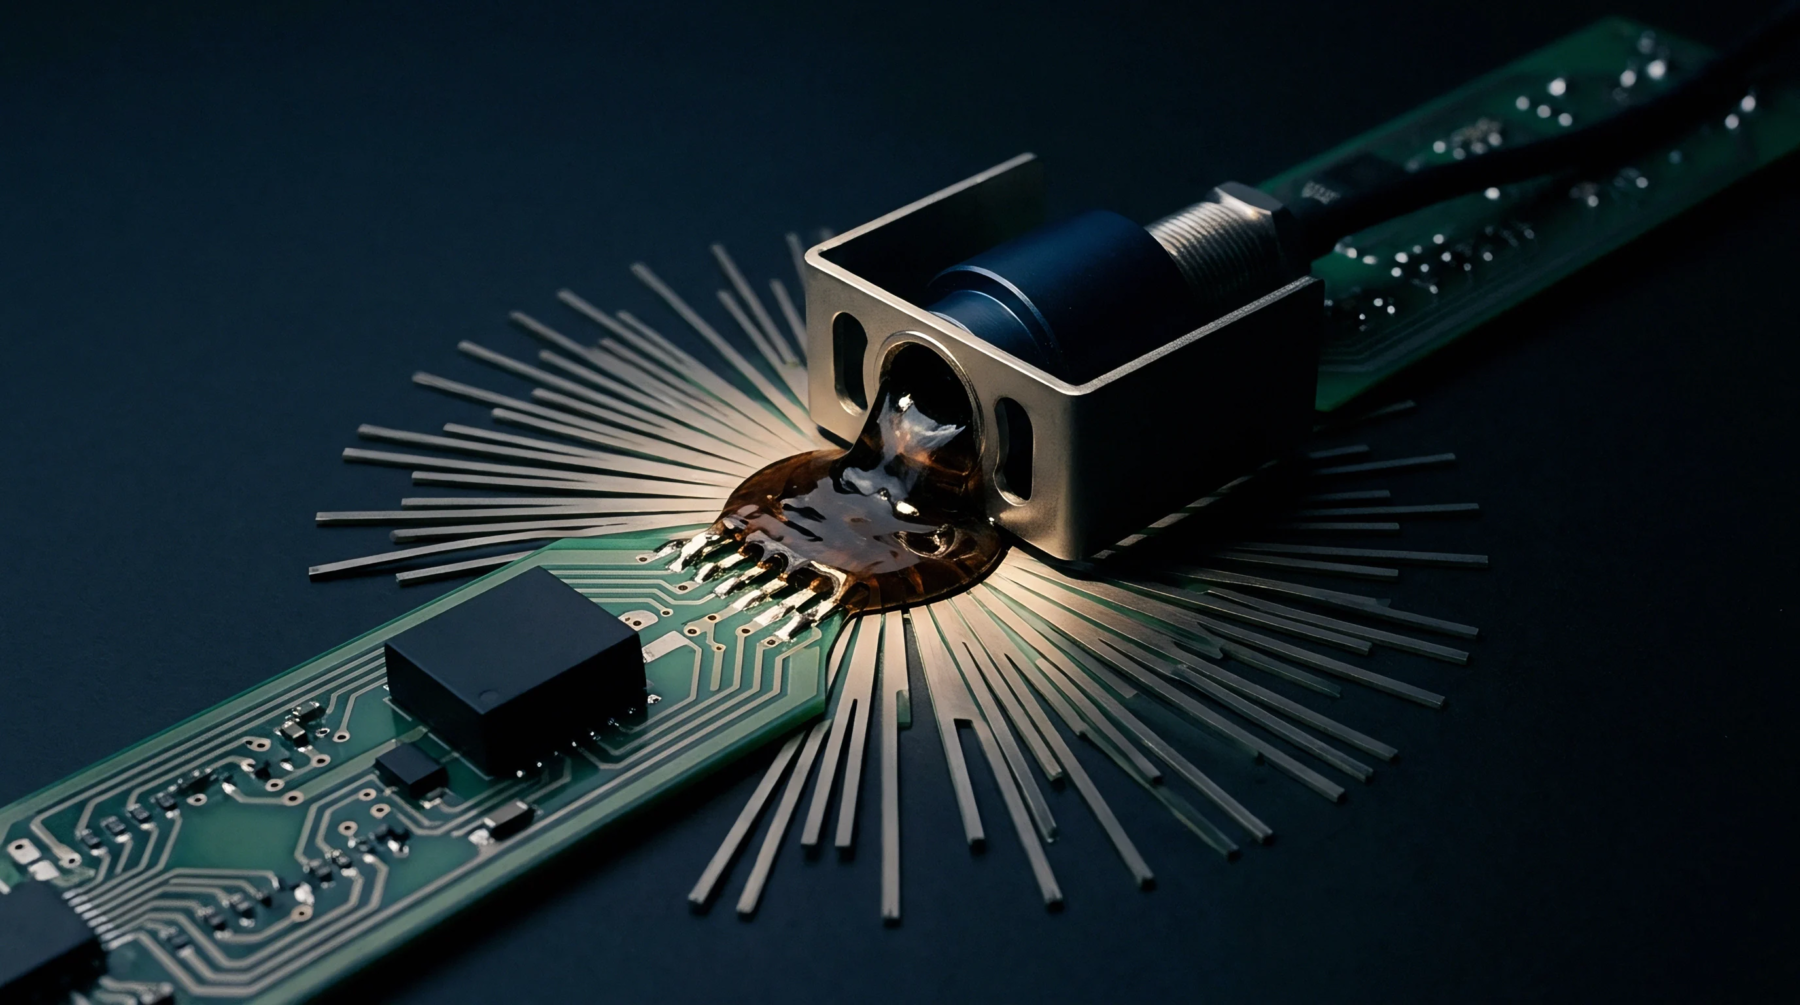
Visualized force data illustrates how mechanical loads concentrate across a circuit board inside a functional or in-circuit test station. Generating a fixture force density map involves identifying every point where a probe or a push finger makes mechanical contact with the laminate. This allows for the optimization of the hardware design to prevent board warping.
Load Analysis
Software tools calculate the force in Newtons per square centimeter across the board area based on spring constants and pin locations. Reviewing a fixture force density map helps prevent the concentration of forces near large ceramic components or sensitive solder balls. When the map shows high intensity hot spots in unsupported regions, additional support pins are placed to redistribute the load.
These adjustments shift the mechanical burden back toward the solid structural frame of the fixture. High density clusters of probes are particularly dangerous on thin substrates where the aggregate force easily reaches dozens of kilograms. By spreading out the probes or balancing them with downward pushers, the engineering team creates a safer mechanical environment for the production units.
Metric Threshold
Peak values on the intensity scale guide the selection of different probe types with lower spring tensions. Reducing the load at specific locations helps protect thin traces from compression.