Determining Statistical Process Capability Limits in Surface Mount Lines
Statistical process capability limits in surface mount lines require gauge R and R validation below ten percent before calculating paste volume and placement indices.

Gauge
Measurement systems on surface mount assembly lines introduce variance into process capability calculations before a single production board enters the line. Inspection optics require precise physical alignment. Automated optical inspection units and 3D solder paste inspection systems deploy camera sensors, laser projectors, and encoder stages that carry measurement error.
Evaluating process capability without isolating measurement system variation causes artificial inflation of process variance, suppressing calculated process capability indices below true operating performance.
Measurement System Analysis per Automotive Industry Action Group guidelines establishes the repeatability and reproducibility bounds of inline optical equipment. Gauge Repeatability and Reproducibility studies assess the combined variation of the measurement instrument and operator or board loading mechanics. When total measurement system variation consumes more than thirty percent of the upper and lower specification limits, capability index calculation yields skewed outcomes.
Precision to tolerance ratios under ten percent maintain calculation integrity across solder paste deposit volume and placement offset metrics.
| Equipment Category | Target Parameter | Precision Requirement | Acceptable R&R Threshold |
|---|---|---|---|
| 3D Solder Paste Inspection | Deposit Height and Volume | ± 2.0 micrometers | < 10% of Tolerance Band |
| Automated Optical Inspection | Placement Offset (X, Y) | ± 5.0 micrometers | < 12% of Tolerance Band |
| Automated Optical Inspection | Rotational Alignment (θ) | ± 0.05 degrees | < 15% of Tolerance Band |
| Inline 3D X-Ray Inspection | BGA Void Percentage | ± 1.5 percent area | < 20% of Tolerance Band |
Optical calibration limits dictate measurement boundaries. Calibration target plates featuring quartz chrome grids establish spatial accuracy across the camera field of view. Board warpage and height variation disrupt optical focus, introducing parallax errors during solder paste volume estimation.
Line qualification protocols isolate measurement system variance using ten repeated scans across five static test panels prior to calculating process capability limits.
Measurement systems maintaining gauge repeatability and reproducibility below ten percent of tolerance prevent capability index degradation.
Calibration errors often mask line stability. Equipment vendors frequently claim optical system drift stems entirely from ambient temperature fluctuations rather than internal camera rail wear.

Volume
Solder paste deposition forms the primary statistical baseline for surface mount interconnect yield. Stencil aperture geometry governs paste release behavior during the printing cycle. Transfer efficiency defines the ratio of deposited solder paste volume to nominal stencil aperture volume.
Theoretical paste volumes calculated from aperture area ratios below 0.66 yield unstable volume distributions characterized by high variance and frequent insufficient solder deposits.
Optical sensors measure paste height. Laser triangulation and structured light projection collect height arrays across every printed pad, multiplying area by average height to derive volumetric data. Process specification limits for solder paste deposition typically span eighty percent to one hundred forty percent of nominal volume.
Narrow apertures reduce transfer efficiency. When paste deposit distributions shift downward, the lower capability limit intersects the minimum solder volume required for wetting, triggering head-in-pillow defects after reflow.

Stencil Aperture Geometry and Deposit Metrics
Aperture sidewall friction dictates solder paste release quality. Electroformed and laser-cut stencils with smooth sidewall topographies achieve consistent transfer efficiency across fine-pitch land patterns. Solder paste powder particle size distribution influences aperture filling.
Type 4 paste particles ranging from twenty to thirty-eight micrometers suit aperture widths down to one hundred twenty micrometers, whereas Type 5 paste particles ranging from fifteen to twenty-five micrometers sustain transfer efficiency in sub-one-hundred-micrometer apertures.
- Aperture Area Ratio defines the ratio of pad area to aperture sidewall area, governing deposit transfer efficiency above the 0.66 critical threshold.
- Transfer Efficiency Percentage measures deposited paste volume relative to stencil aperture volume, establishing central tendency across print runs.
- Squeegee Pressure Window controls paste blade wiping action, maintaining deposit height stability across wide panel formats without scavenging paste from apertures.
- Separation Speed Parameter determines the vertical stencil breakaway rate, preserving deposit edge sharpness and preventing paste bridging between adjacent pads.

Transfer Efficiency Limits across Area Ratios
Process capability calculation for solder paste volume requires continuous tracking of distribution parameters. Solder volume controls joint reliability. High transfer efficiency variance indicates squeegee wear, incorrect separation speed, or paste rheology breakdown caused by extended shear exposure on the stencil foil.
| Aperture Area Ratio | Mean Transfer Efficiency | Standard Deviation (σ) | Calculated Cpk (LSL 70%, USL 140%) |
|---|---|---|---|
| > 0.75 | 102% | 5.2% | 1.92 |
| 0.66 – 0.75 | 94% | 7.8% | 1.03 |
| 0.55 – 0.65 | 81% | 12.4% | 0.30 |
| < 0.55 | 68% | 18.6% | -0.04 |
Aperture sidewall friction dominates print variation when aperture area drops faster than stencil foil thickness.
Drift
Component placement mechanics introduce translational and rotational offset distributions during high-speed assembly line operations. Pick-and-place equipment accuracy relies on vision alignment cameras, linear motor drives, and mechanical nozzle changers. IPC-9850 testing procedures establish baseline placement machine capability using standard glass alignment panels.
Production conditions introduce additional variance drivers, including circuit board dimensional expansion, feeder pitch tolerances, and mechanical nozzle wear.
Board expansion creates placement offsets. Multi-pass reflow processing exposes substrates to thermal cycles that induce localized substrate shrinkage or expansion. Thermal warpage shifts pad locations.
High-density designs featuring 0201 and 01005 passive components mandate placement accuracy capability indices above 1.33 to prevent lead-to-pad misalignment prior to reflow oven entry.

Pick and Place Mechanical Tolerances
Translational offset along X and Y axes follows a bivariate normal distribution when machine calibration remains centered. Rotational deviation introduces non-linear offset components, displacing peripheral leads on large quad flat packages and fine-pitch ball grid arrays. Feeder wear increases placement variance.
Pneumatic tape feeders exhibit higher indexing variance than electronic motor-driven feeders, widening the total variance band of component placement positions.
- Run glass panel verification target sets through the pick-and-place unit to isolate pure machine motion variance from substrate distortion.
- Measure fiducial registration offsets across twenty consecutive circuit board panels using high-resolution optical cameras.
- Calculate mean offset and variance values separately for component pitch groupings ranging from 1.0 millimeter down to 0.3 millimeter.
- Adjust machine vision search windows and thermal compensation tables when calculated capability falls below contractual baseline thresholds.
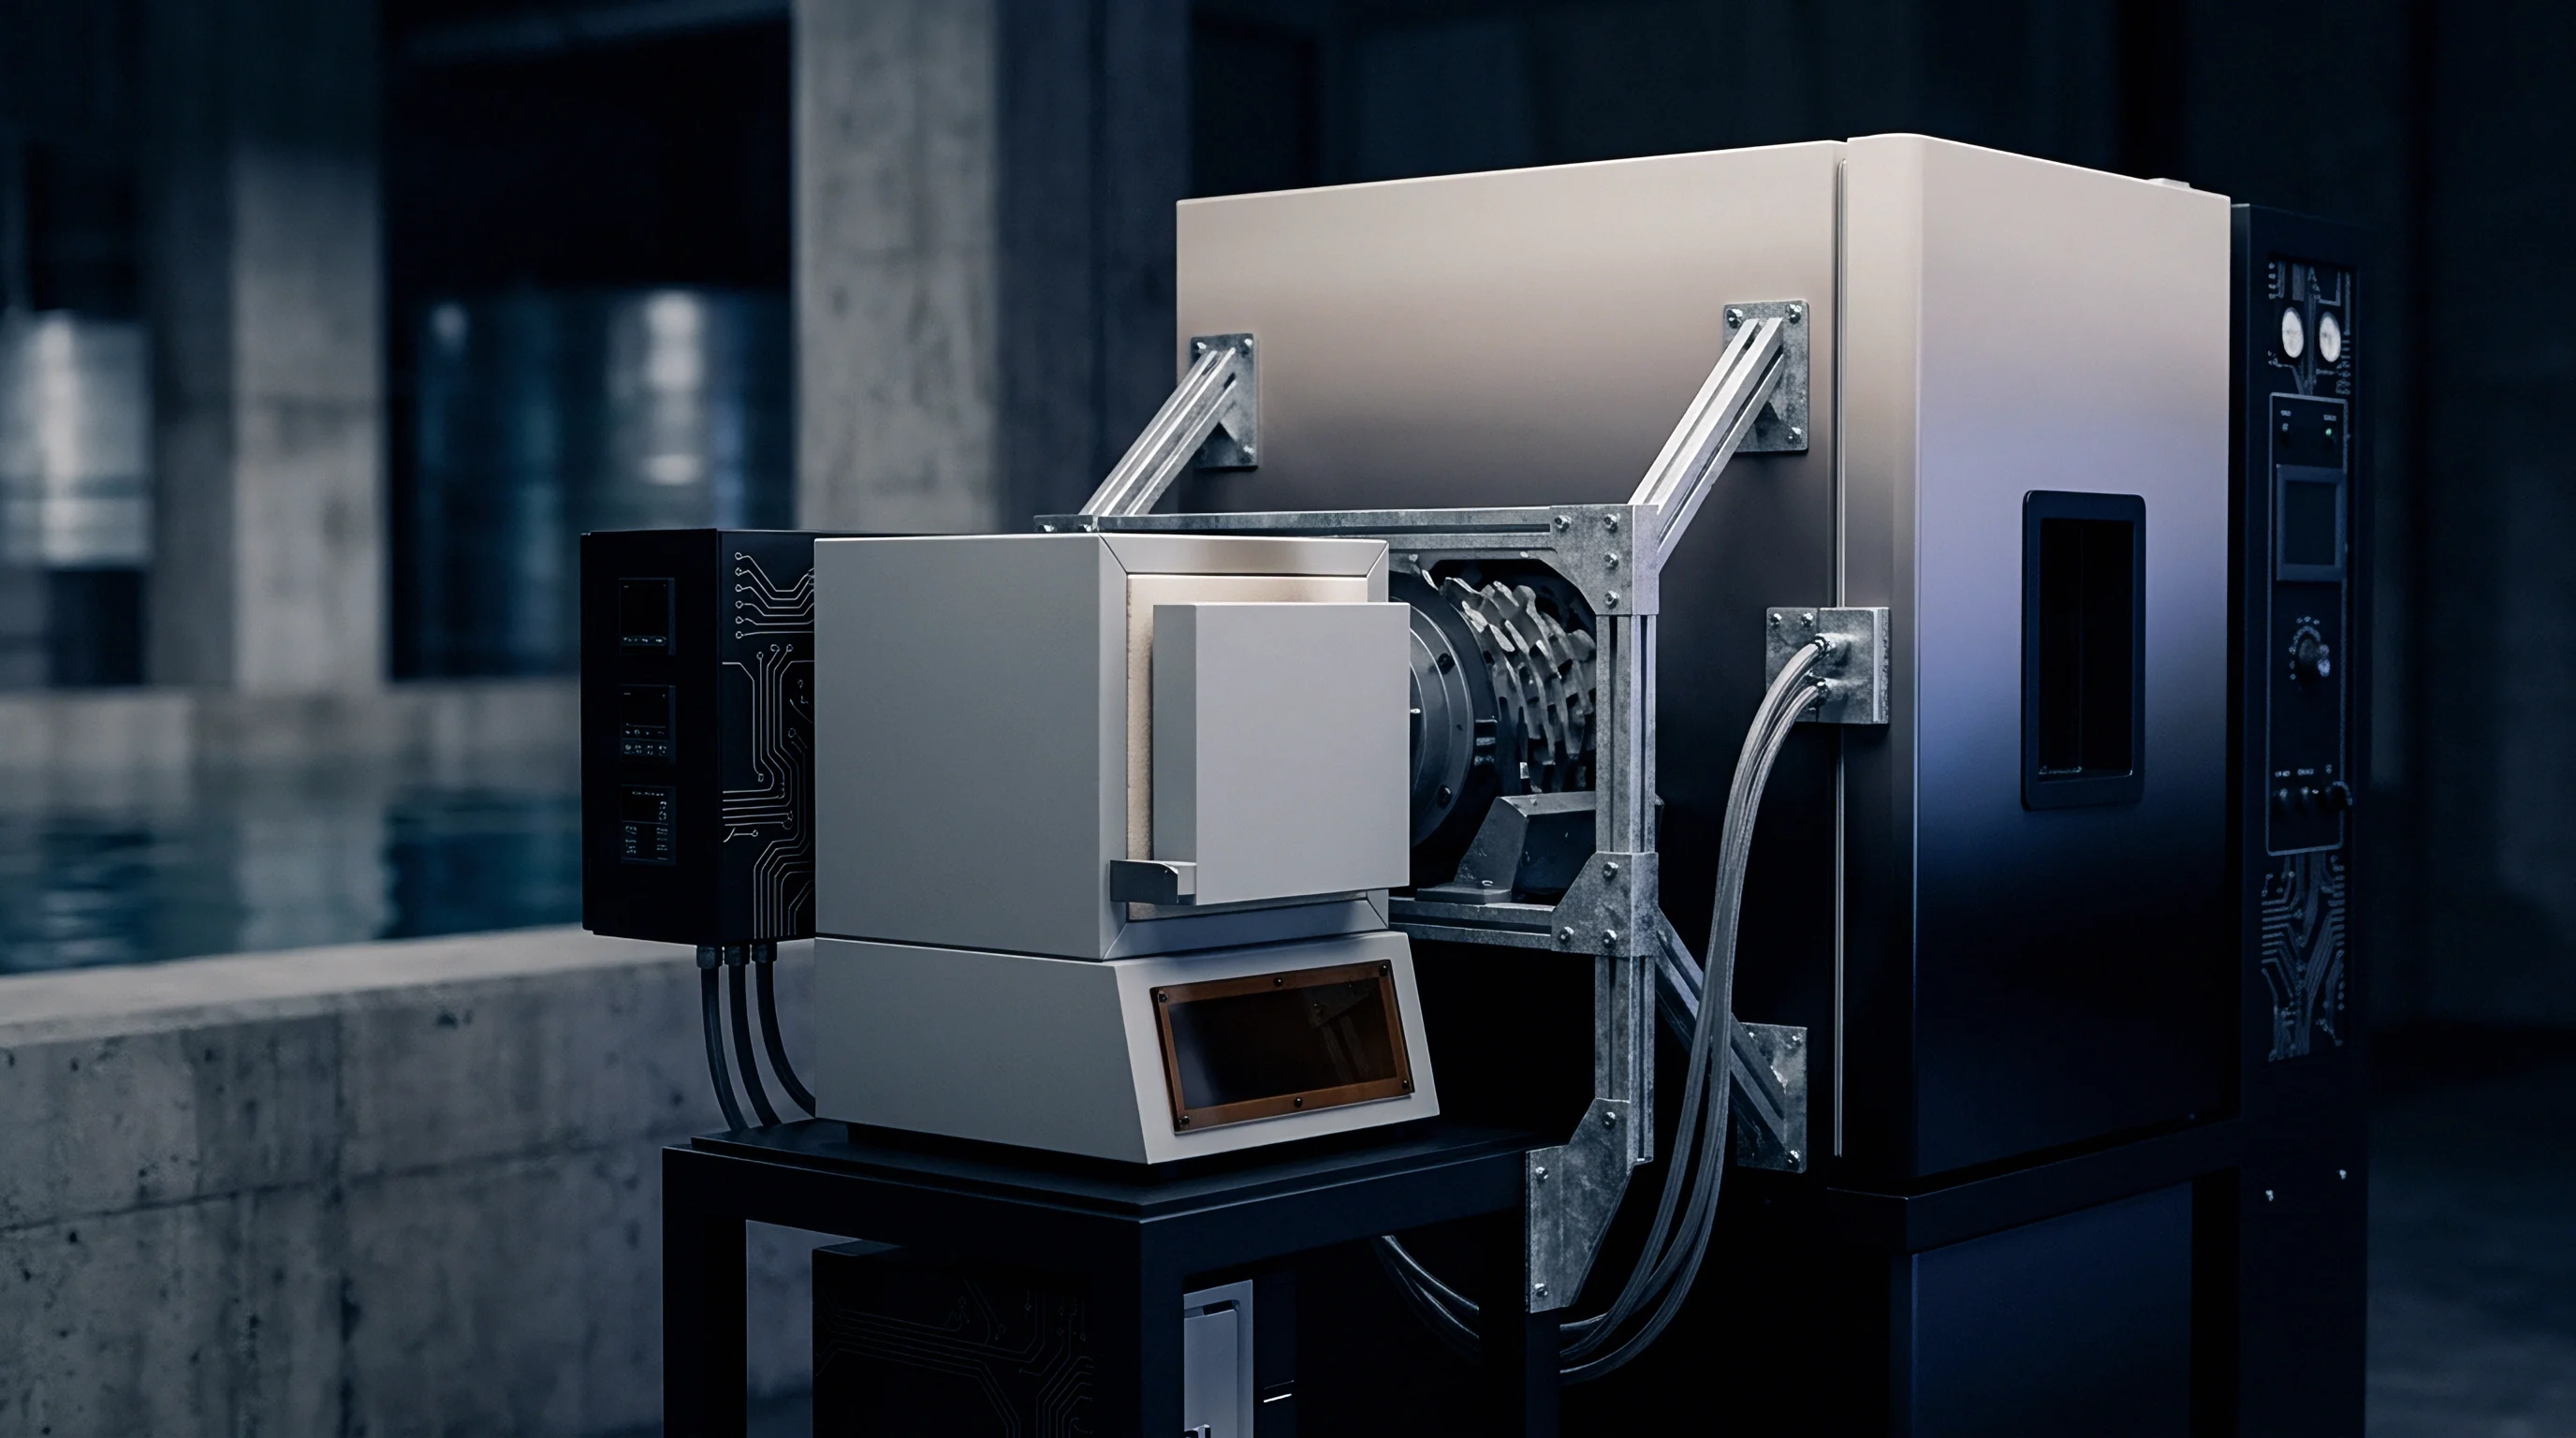
Thermal Warpage and Fiducial Registration
Substrate warpage alters board geometry under thermal load. Synthetic substrate materials experience z-axis expansion and dynamic bow and twist during reflow heating. Local fiducials located adjacent to fine-pitch components mitigate thermal expansion errors by re-orienting local coordinate systems immediately prior to placement execution.
Component pick offset boundaries shrink as land pattern pitch narrows below fine pitch thresholds.
Ignoring placement thermal alignment boundaries results in bridged fine-pitch QFP leads during second-pass reflow, generating high scrap volumes.
Shift
Statistical process capability evaluation relies on data subgrouping strategies that capture short-term within-subgroup variance while isolating long-term process shifts. Rational subgrouping aggregates measurements produced under homogeneous conditions, such as components placed by a single nozzle head during a unified machine cycle. Aggregating data across multiple placement heads or distinct stencil printing squeegee strokes masks individual process shifts, leading to invalid capability estimates.
Subgroup size impacts variance estimates. Sampling five consecutive boards every thirty minutes captures shift-to-shift thermal drift while providing sufficient data points to estimate short-term population variance. Small sample sizes under-represent distribution tails, artificially narrowing calculated control limits and overstating capability metrics.

Subgroup Selection and Rational Subgrouping
Data collection frequency influences process capability calculations. Continuous inspection data gathered by inline 3D solder paste inspection systems generates thousands of pad volume data points per panel. Treating individual pad deposits as independent random samples violates statistical independence assumptions due to localized printing pressure gradients across the stencil surface.
Grouping deposit data by panel average or aperture size class restores statistical independence required for valid standard deviation calculations.
How Does Non-Normality Distort SMT Process Capability?
Solder paste volume distributions frequently exhibit positive skewness bounded by zero deposit volume on the lower end. Skewed distributions distort standard indices. Applying standard Gaussian assumption formulas to skewed paste deposit data yields incorrect lower capability values, overestimating defect probability on the lower specification limit while underestimating upper limit bridge risks.
Box-Cox power transformations and Johnson distribution fits convert skewed SMT process data into normalized metrics, restoring calculation accuracy for non-Gaussian process outputs.
Automated optical inspection systems generate false calls when inspection tolerance bands are set narrower than underlying process capability. High false-call rates force manual inspection override actions, introducing operator fatigue and increasing escape risks for genuine placement defects. Calibrating inspection thresholds to true three-sigma process capability limits balances defect detection sensitivity against false alarm frequency.
Non-normal paste deposit distributions distort standard capability indices toward false optimism.
Process engineers continue to debate whether panel-level subgrouping hides localized thermal gradient variations across wide multi-zone reflow ovens.


Formula
Process capability calculation applies mathematical formulations to evaluate process performance relative to engineering specification limits. Potential process capability, designated as Cp, compares total allowable specification width against process spread measured as six standard deviations. Cp assumes process centering directly mid-way between upper and lower specification limits.
High variance lowers capability readings. Real-world assembly operations demonstrate process mean offset relative to specification centers. The centered capability index, designated as Cpk, adjusts process capability for mean offset by evaluating the distance from the process mean to the nearest specification limit divided by three standard deviations.

Index Derivation and Variance Decomposition
Statistical variance decomposition separates total process variation into within-subgroup variation and between-subgroup variation. Standard capability indices utilize within-subgroup standard deviation derived from average sample ranges or sample standard deviations. Process performance indices, designated as Pp and Ppk, utilize total population standard deviation calculated across all collected process data without subgroup partitioning.
Short-term capability calculations using Cpk reflect machine potential under controlled test conditions. Long-term capability calculations using Ppk account for shift changeovers, paste replenishment cycles, raw material lot variance, and ambient shop floor environment changes. Line qualification requires evaluating both metrics simultaneously.
A substantial spread between calculated Cpk and Ppk values signals unmanaged process instability and ambient environmental drift across production shifts.
Evaluating indices requires specific selection criteria based on production run duration and inspection infrastructure.
- Short Term Capability Index Cpk evaluates within-subgroup variance to verify intrinsic machine accuracy during initial qualification runs.
- Long Term Performance Index Ppk measures overall population variance across extended production runs to capture material and shift changes.
- Upper Capability Boundary Cpu calculates distance from process mean to upper specification limit, monitoring bridging and solder bead risk.
- Lower Capability Boundary Cpl calculates distance from process mean to lower specification limit, tracking insufficient solder and voiding risks.
Worked Calculation for Fine Pitch Component Placement
Consider a fine-pitch component placement accuracy qualification test measuring X-axis offset on a 0.4-millimeter pitch land pattern. Nominal placement offset equals 0.0 micrometers. Upper specification limit USL equals +50.0 micrometers, and lower specification limit LSL equals -50.0 micrometers.
A rational subgroup sample of 250 component placements collected across 50 printed circuit board panels yields a sample mean offset of +6.2 micrometers and a within-subgroup standard deviation of 8.4 micrometers. Total sample standard deviation across all 250 components equals 10.1 micrometers.
Calculating upper and lower capability bounds for Cpk proceeds as follows:
Cpu = (50.0 – 6.2) / (3 8.4) = 43.8 / 25.2 = 1.738
Cpl = (6.2 – (-50.0)) / (3 8.4) = 56.2 / 25.2 = 2.230
Cpk = min(Cpu, Cpl) = 1.738
Calculating the long-term performance index Ppk using total standard deviation yields:
Ppu = (50.0 – 6.2) / (3 10.1) = 43.8 / 30.3 = 1.446
Ppl = (6.2 – (-50.0)) / (3 10.1) = 56.2 / 30.3 = 1.855
Ppk = min(Ppu, Ppl) = 1.446
The delta between Cpk of 1.74 and Ppk of 1.45 highlights systematic variance introduced across panel runs. Sample size selection directly impacts confidence intervals surrounding calculated capability indices. Small sample sizes generate wide confidence bands, increasing the probability of accepting uncapable process lines.
| Capability Metric | Variance Calculation Source | Target Threshold (Standard) | Target Threshold (High Reliability) |
|---|---|---|---|
| Cp | Within Subgroup (σ_within) | ≥ 1.33 | ≥ 1.67 |
| Cpk | Within Subgroup (σ_within) | ≥ 1.33 | ≥ 1.67 |
| Pp | Total Population (σ_total) | ≥ 1.33 | ≥ 1.50 |
| Ppk | Total Population (σ_total) | ≥ 1.33 | ≥ 1.50 |
Calculating the lower ninety-five percent confidence interval bound prevents premature line release when sample counts remain below one hundred readings.

Docket
Commercial assembly contracts translate statistical capability limits into binding operational agreements between buyers and contract manufacturers. Setup errors invalidate process limits. Line changeover validation protocols define exact sampling counts and statistical targets required before committing production runs.
Contracts stipulating capability limits without defining specific subgrouping methods, inspection tools, and specification boundaries create unquantified financial exposure for both operating parties.
Tight limits increase setup duration. Contractual capability thresholds of Cpk 1.67 for critical components, such as micro-BGAs and 0201 passives, demand rigorous stencil design reviews and automated line calibration steps during job setup. Lower minimum capability thresholds of Cpk 1.33 apply to standard discrete components and wide-pitch integrated circuits without jeopardizing first-pass assembly yield.
Contractual Capability Specifications
Clear specifications reduce contract disputes. Manufacturing supply agreements incorporate detailed line qualification addendums specifying acceptable capability limits across stencil printing, component placement, and reflow profile stability. Equipment calibration logs, gauge R&R validation reports, and real-time statistical process control charts form mandatory line release documentation.
Contractual agreements allocate rework costs based on statistical compliance. When a contract manufacturer demonstrates process capability exceeding agreed contractual limits, defect occurrences attributable to raw material defects or substrate warpage transfer financial liability to the component or board supplier. Process capability failures below contractual limits place complete rework, reinspection, and scrap replacement costs on the assembly line operator.
First Article Line Release Mechanics
First article inspection protocols establish production readiness prior to executing volume assembly runs. A full first article release evaluates visual criteria under IPC-A-610 acceptability standards combined with statistical capability verification across automated inspection steps. Line releases require continuous capability tracking through the first production batch to confirm process stability under full operational velocity.
Contracts specifying minimum process capability index limits without stated subgroup sizes default to batch population variance calculations.
IPC-9850 section 5.2 mandates that placement capability verification runs utilize glass calibration panels, shifting verification liability from the board fabricator to the assembly line vendor.