Statistical Process Control for Solder Paste Deposit Heights
3D optical paste height inspection combined with subgroup capability metrics locks print volume stability before reflow defects occur.

Aperture
Stainless steel stencils establish the volumetric foundation of surface mount assembly. Solder paste behaves non-linearly. When the squeegee blade drives Type 4 or Type 5 solder paste across a electro-polished foil, the hydraulic pressure forces the shear-thinning material into cut openings.
Stencil thickness sets baseline volume. Upon substrate separation, the paste column must detach cleanly from aperture walls to maintain height uniformity across the printed array.
Print speed alters deposit height. High squeegee speeds reduce viscosity through shear action, allowing tighter fill inside micro-apertures but increasing the likelihood of squeeze-out under the stencil gasket. Lower speeds increase deposit height retention while exposing the deposit to roll-instability across wide land patterns.
Physical deposit height correlates directly with stencil foil thickness only when the area ratio of the aperture remains above critical threshold values.
Transfer Efficiency and Area Ratio Physics
Geometric dimensions of laser-cut openings determine whether wet paste detaches cleanly during table separation. Area ratio defines the surface area of the aperture opening divided by the surface area of the aperture walls. For rectangular land patterns, this ratio evaluates as aperture width multiplied by length, divided by twice the sum of width and length times foil thickness.
When area ratio drops below 0.66, wall friction overcomes substrate adhesion.
Wet paste collapses during separation. Standard IPC-7525 guidelines mandate an area ratio greater than or equal to 0.66 to maintain a transfer efficiency above 80 percent. Transfer efficiency represents the measured wet deposit volume divided by the theoretical aperture volume, multiplied by one hundred.
Aperture area ratio drives release. When aspect ratio, defined as aperture width divided by foil thickness, falls below 1.5, height variance expands across consecutive print cycles.
- Wall Friction Drag ~ Shearing forces along polished metal aperture walls reduce paste release when aspect ratios fall below target thresholds.
- Hydraulic Fluid Force ~ Squeegee speed increases liquid pressure within the stencil land, driving wet material underneath aperture gaskets.
- Separation Speed Mismatch ~ Rapid vertical separation of the PCB substrate tears the printed paste column, leaving uneven deposit peaks.
- Foil Deflection Distortion ~ Unsupported stencil spans flex under squeegee downward force, expanding wet deposit height near panel centers.
Aperture design dictates transfer stability across high-density layouts. Electro-formed stencils provide smoother wall profiles than standard fiber laser cutting, shifting the acceptable area ratio threshold down to 0.55 for 0.4 mm pitch quad-flat no-lead packages. Nano-coated stencil surfaces modify surface energy, preventing paste flux from wetting stencil wall edges.
This surface treatment preserves height consistency over extended production runs between automated wipe cycles.

Foil Thickness Impact on Wet Volume
Baseline heights track metal sheet gauge, set by electro-polishing and nickel cladding treatments. Standard SMT lines specify stencil foil gauges ranging from 80 microns up to 150 microns. Selecting a 127-micron stencil foil establishes a nominal deposit height baseline of 127 microns, assuming 100 percent transfer efficiency.
On mixed-technology circuit assemblies carrying both 0.8 mm pitch ball grid arrays and 0.4 mm pitch micro-QFNs, uniform foil thickness forces engineering compromises.
Placing apertures closer than three times the foil thickness guarantees paste shearing across adjacent land pads.
Step-down stencils resolve volumetric conflicts across disparate component footprints. Chemically etched or laser-milled step-down pockets reduce foil thickness from 127 microns down to 100 microns in localized zones housing micro-pitch components. The transition zone around a step-down pocket mandates a minimum clearance distance of 0.9 mm per 25 microns of step depth to prevent squeegee blade riding.
Blade riding leaves excessive paste height at step boundaries, causing solder bridging during reflow.
Failure to control aperture wall geometry forces paste release below seventy percent of theoretical volume, generating dry joints during reflow.
Metrology
Automated three-dimensional inspection systems quantify paste deposits immediately following the squeegee pass. Inline Solder Paste Inspection tools measure three-dimensional profiles using optical triangulation methods. Laser triangulation measures peak height.
Board warp distorts laser readings. Modern inspection heads combine laser displacement sensors with structured light projection to eliminate measurement shadows around high-density component arrays.
Calibration targets confirm sensor accuracy. Inspection equipment requires daily height verification using certified step-height standards. Calibration standards feature quartz glass or chromium-coated ceramic blocks with etched step heights verified to within plus or minus 0.5 microns.
Without routine calibration, optical drift introduces false process shifts into statistical control software, triggering unnecessary line stoppages.
Optical Sensor Triangulation Mechanics
Phase-shifting Moiré projection patterns map board surface elevation across thousands of discrete pads per second. Multiple fringe patterns project onto the printed board at precise spatial angles. Dual-camera systems acquire phase-shifted images, calculating absolute Z-axis elevation relative to unprinted substrate copper reference planes.
This differential measurement isolates paste deposit height from local board warpage and panel thickness tolerances.
Z-height calculation depends on substrate reflectivity. Solder mask variations, bare copper oxidation, and silver immersion surface finishes alter optical reflection profiles. Advanced inspection algorithms apply dynamic thresholding to isolate pad boundaries before calculating mean height, peak height, and volumetric displacement.
Mean height represents total deposit volume divided by detected pad area, serving as the core parameter for statistical process control charts.
| Sensor Architecture | Z-Axis Resolution | Inspection Speed | Board Warp Vulnerability | Shadowing Susceptibility |
|---|---|---|---|---|
| Dual-Laser Triangulation | 1.2 µm | 120 cm²/s | Moderate | High on tall components |
| Single Moiré Projection | 0.8 µm | 80 cm²/s | Low | Moderate on dense layouts |
| Dual-Camera 3D Moiré | 0.5 µm | 100 cm²/s | Minimal with active compensation | Very Low |
Gage Repeatability and Reproducibility Validation
Measurement systems require systematic evaluation using master calibration targets before line operators accept height trend data. Gage R&R studies isolate measurement system variability from total process variance. Standard qualification protocols mandate evaluating ten printed panels measured across three operators, repeated three times per panel.
Total Gage R&R variance must consume less than ten percent of the allowable specification tolerance band.
A 100-micron stencil operating at 85 percent transfer efficiency yields a nominal height target of 85 microns with a tolerance window of plus or minus 15 microns.
Gage capability metrics dictate tolerance limit settings. When Gage R&R contribution falls between ten and thirty percent, the measurement system remains acceptable for production, provided upper and lower specification limits shrink by the measurement error margin. If Gage R&R exceeds thirty percent, optical calibration, board clamping fixtures, and lighting intensity parameters demand immediate corrective overhaul.
Equipment vendors frequently maintain that sensor noise remains below two microns, though uncompensated board flexure on thin substrates distorts true deposit Z-height measurements by ten times that figure.
Chart
Statistical monitoring relies on subgroup averages and range statistics to detect process shifts before soldering faults occur. Subgroup size alters chart sensitivity. Standard statistical process control setups deploy X-bar and R control charts to monitor mean height and height range across consecutive production panels.
Subgroups typically comprise five measured points per board across critical fine-pitch component footprints.
Control limits reflect natural process variation. Upper Control Limits and Lower Control Limits derive from historical process capability data during qualified baseline runs. These limits sit inside engineering specification limits, establishing an early warning zone.
When subgroup averages drift toward control limits, operators make squeegee pressure or speed adjustments before deposit heights breach customer drawing tolerances.
Subgroup Selection and Control Limit Mathematics
Sampling five sequential printed circuit assemblies every shift establishes the standard error of the mean for height distribution tracking. Individual sample readings inside a subgroup represent discrete pad height measurements across specified component footprints. The subgroup mean X-bar averages these five values, while subgroup range R tracks the difference between the maximum and minimum measured height within that sample group.
Grand mean calculation aggregates subgroup data. The overall mean X-double-bar averages subgroup means across 25 baseline runs. Upper Control Limit UCL equals X-double-bar plus the quantity factor A2 multiplied by average range R-bar.
Lower Control Limit LCL equals X-double-bar minus factor A2 multiplied by R-bar. For a subgroup sample size of five, factor A2 equals 0.577, establishing three-sigma control boundaries around the grand process mean.
Worked Capability Calculation for Fine Pitch Land Patterns
Consider an assembly line processing 100-micron pitch QFN components using a 127-micron stencil. Engineering specifications set the target nominal height at 125 microns, with a Lower Specification Limit LSL of 95 microns and an Upper Specification Limit USL of 155 microns. Inspection data collected across 25 subgroups of five boards yields a grand mean X-double-bar of 124.6 microns, with an average range R-bar of 12.8 microns.
Calculated process parameters confirm control boundary placement:
- Pooled sample standard deviation sigma = R-bar divided by d2 (where d2 = 2.326 for n=5): 12.8 / 2.326 = 5.50 microns.
- Upper Control Limit UCL = 124.6 + (0.577 12.8) = 132.0 microns.
- Lower Control Limit LCL = 124.6 – (0.577 12.8) = 117.2 microns.
- Process Capability Index Cp = (USL – LSL) / (6 sigma) = (155 – 95) / (6 5.50) = 60 / 33.0 = 1.82.
- Process Capability Index Cpk = minimum of or = minimum of or = minimum of or = 1.79.
Process capability metrics exceeding 1.67 demonstrate high capability, allowing the line to run with minimal risk of producing height-related reflow defects. When Cpk drops below 1.33, line supervisors hold production to check squeegee wear and stencil cleanliness.
Why Do Nominal Height Limits Fail Fine Pitch Components?
Component lead pitch shrinkage compresses allowable volumetric windows faster than standard printing tolerances shrink. Passive 0201 chip components and 0.4 mm pitch micro-BGA devices exhibit zero tolerance for height variance. A height excess of 20 microns on a 0.8 mm pitch BGA pad remains harmless, whereas that same 20-micron excess on a 0.4 mm pitch land creates solder bridges across adjacent array balls during reflow.
| Metric | Mathematical Definition | Subgroup Sample Constraint | Class 2 Minimum Threshold | Class 3 High-Reliability Target |
|---|---|---|---|---|
| Cp | (USL – LSL) / 6-sigma | Minimum 20 subgroups of n=5 | 1.33 | 1.67 |
| Cpk | min / 3-sigma | Stable process state required | 1.33 | 1.67 |
| Ppk | min / 3-sigma_total | Includes shift-to-shift variance | 1.25 | 1.50 |
Establishing control limits requires strict adherence to sequential calculation steps across running shifts.
- Measure paste deposit height across five designated test locations on five consecutive boards per shift to establish baseline subgroup data.
- Compute the arithmetic mean and range for each subgroup of five boards.
- Calculate the grand mean across twenty-five completed subgroups to establish the central process line.
- Multiply the average range by factor A2 to define upper and lower control bounds for subgroup means.
- Verify that no single subgroup mean falls beyond the three-sigma control boundaries before authorizing line operation.
IPC-7521 section 4.2 dictates that control limits undergo recomputation whenever paste lot chemistry or squeegee blade durometer changes, preventing invalid capability reporting.
Whether automated inspection algorithms can isolate localized board flexing from true paste height degradation across large panel arrays remains a subject of ongoing debate.
Joint
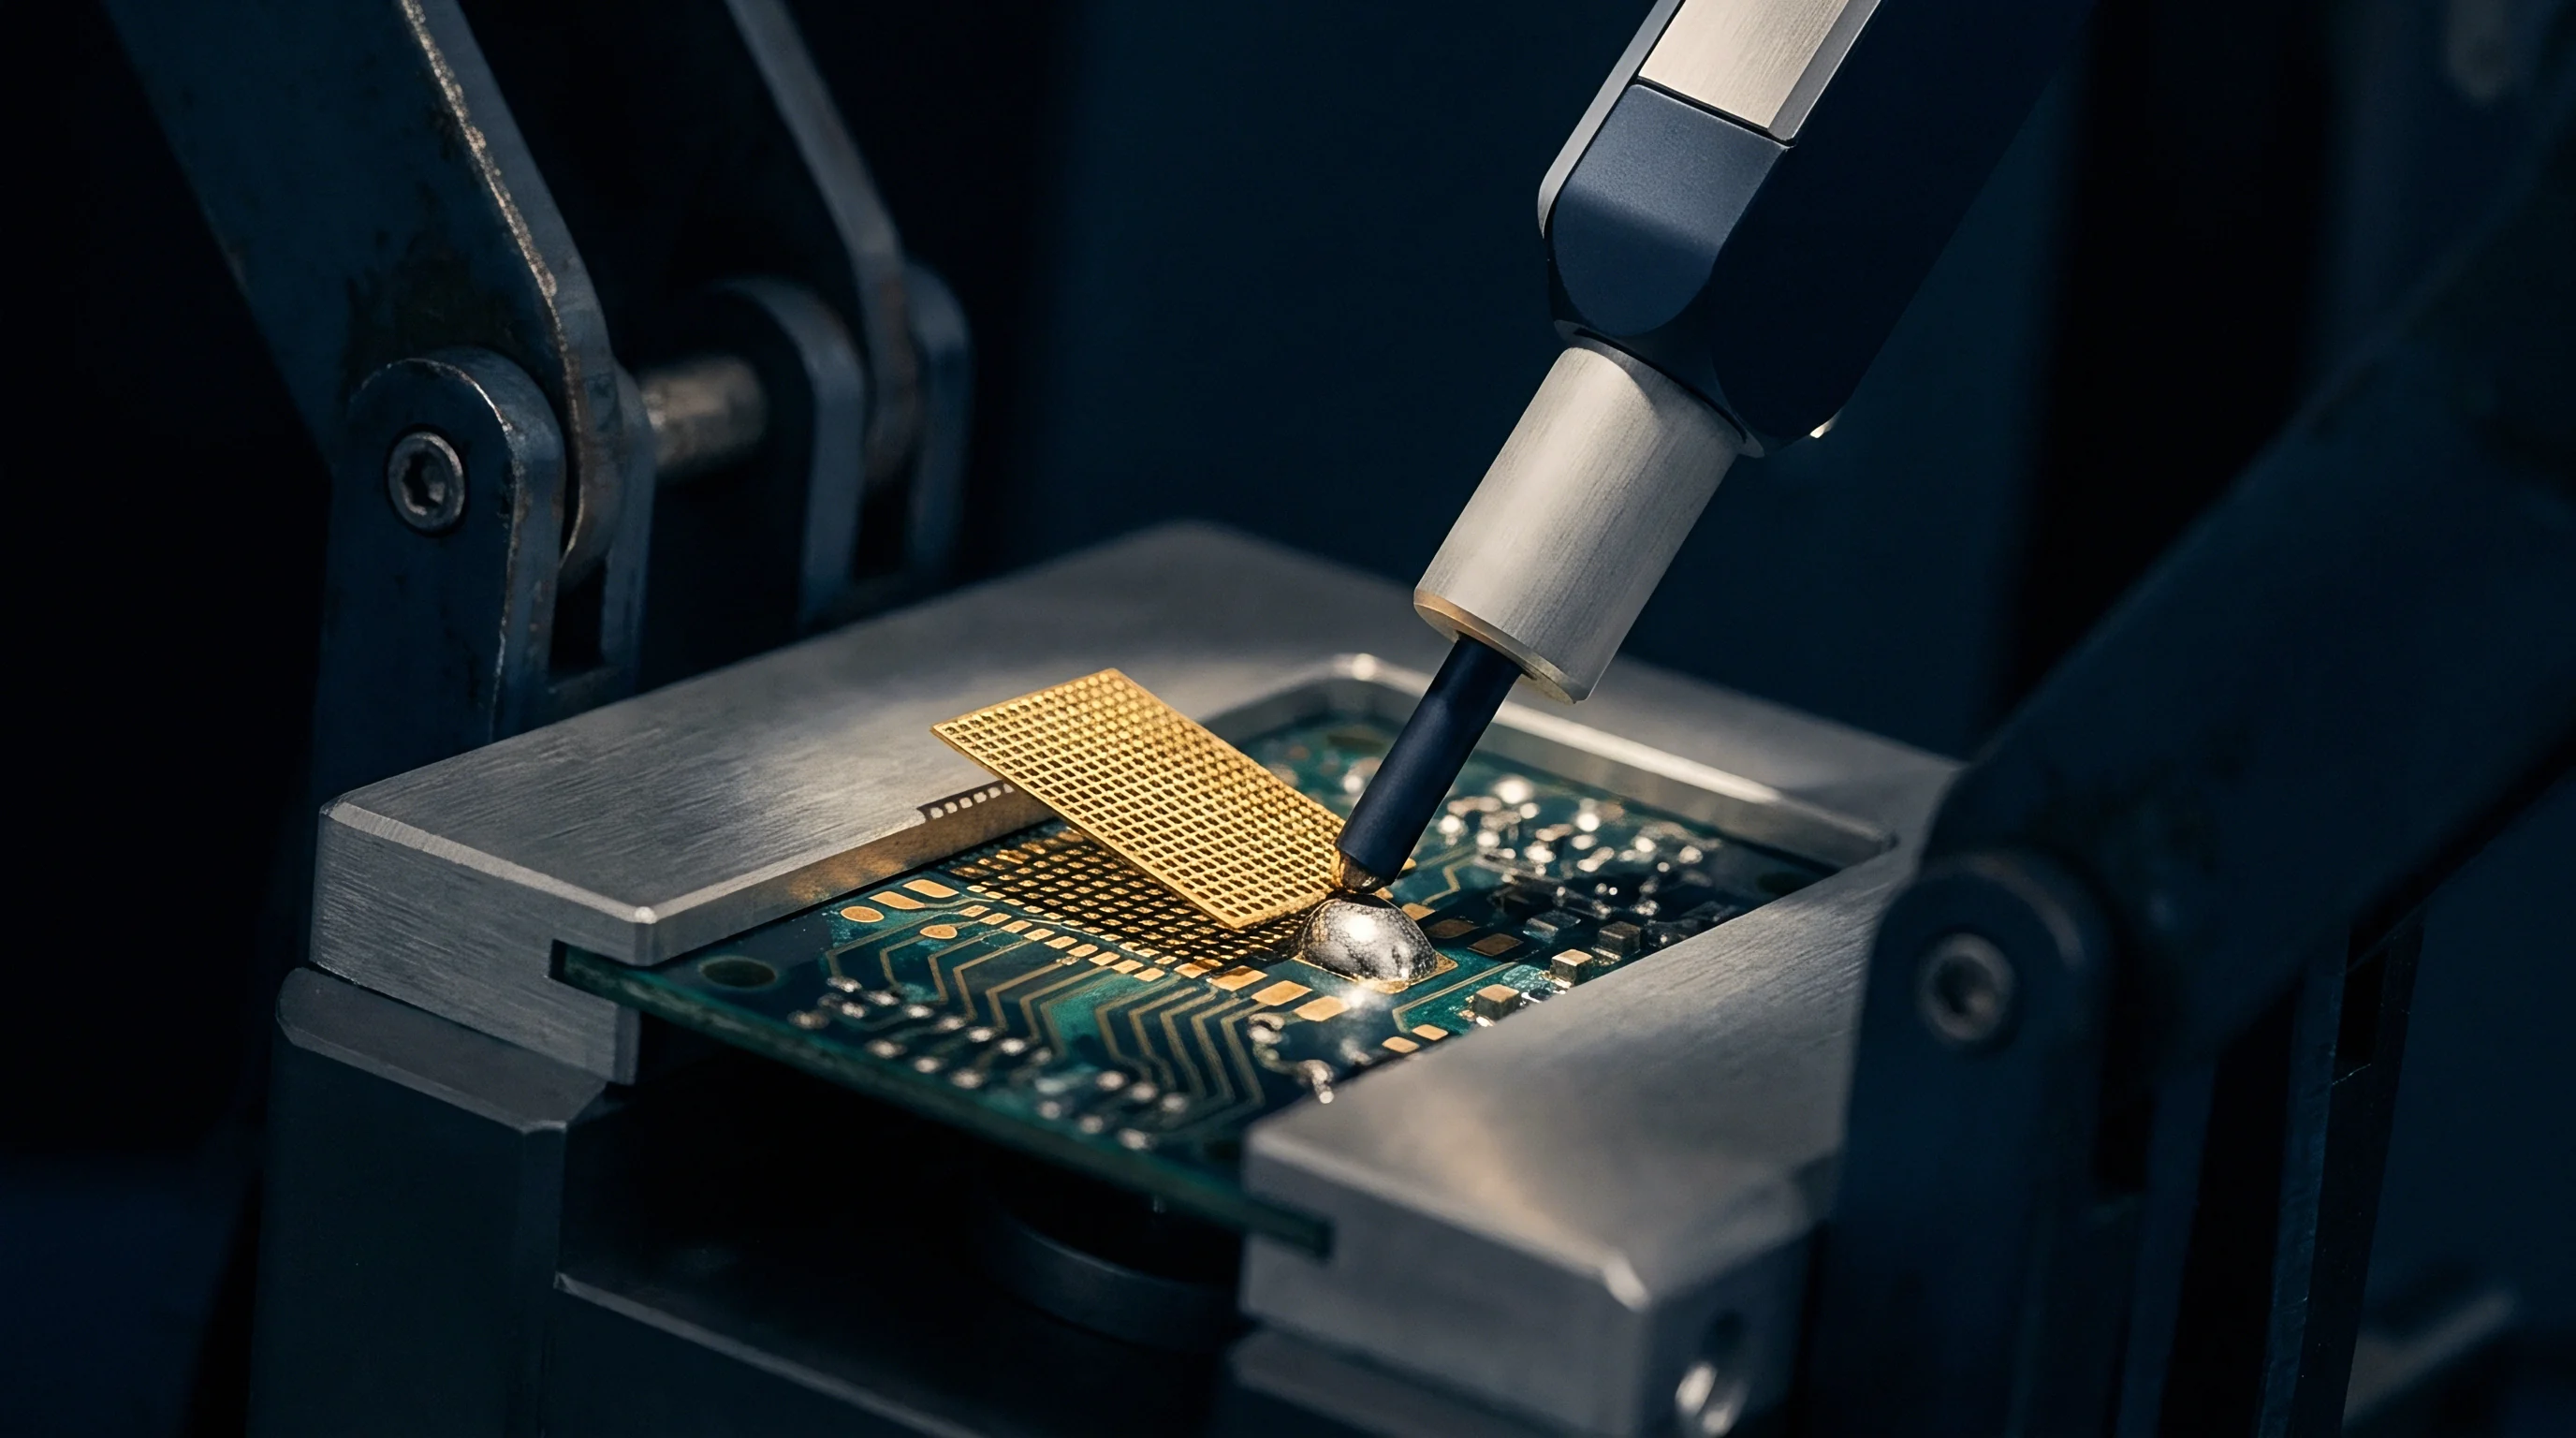
Solder interconnect formation directly mirrors the geometric precision of the wet deposit prior to oven entry. Thermal reflow transforms paste deposits into solid metallic bonds. Excess volume causes bridging.
Low volume leaves open circuits. As height variance expands, molten surface tension dynamics shift across component land patterns during the liquidus phase, producing predictable structural defect modes.
Thermal profiles interact with deposit mass. A deposit carrying insufficient height reaches liquidus temperature faster than an adjacent deposit carrying full nominal volume. This thermal delta causes unequal wetting times on multi-pin component terminations, pulling components out of alignment before the oven heating zone completes total alloy reflow.
Tombstoning Mechanics Driven by Height Variance
Imbalance in wet volume between twin chip-scale component lands creates asymmetric surface tension forces during alloy melting. As symmetric passive chip components enter the reflow zone, solder paste melting on one pad earlier than the opposing pad exerts rotational torque. If deposit height on Pad A exceeds deposit height on Pad B by more than 20 percent, the vertical surface tension vector on Pad A lifts the un-wetted end of the component off Pad B.
Asymmetric deposits cause component tilting. The lifting moment acts around the component pivot point, locking the chip into a vertical position known as tombstoning. Controlling height delta across paired passive land patterns to within 8 microns eliminates surface tension imbalances, preserving component alignment throughout reflow heating.

Bridging and Voiding Escalation Limits
Excessive deposit thickness pushes liquid metal into adjacent pad geometries while insufficient thickness leaves entrapped flux volatiles under bottom-terminated components. Excess height causes solder bridges. Micro-pitch QFN leads spaced 200 microns apart bridge when printed deposit height exceeds 140 microns on a 127-micron stencil.
As solder melts, excess volume exceeds pad surface tension containment limits, slumping across solder mask webs.
- Excessive Peak Height ~ Reduces clearance between lead and pad, causing molten alloy to overflow into adjacent channels during wetting.
- Insufficient Height Profile ~ Leaves insufficient solder volume to fill component termination gaps, generating weak mechanical intermetallic bonds.
- Differential Deposit Volume ~ Induces unequal wetting torque across passive chip terminations, lifting one side off the pad during liquidus phase.
- Trapped Flux Pocket ~ Prevents volatile outgassing under large quad-flat no-lead pads when wet deposit height exceeds perimeter gas release channels.
Void formation under bottom-terminated components accelerates when low deposit height restricts flux volatile escape paths. During preheat, paste flux vehicles vaporize. If deposit height drops below 75 microns on large ground pads, the component body settles against the board surface, sealing perimeter outgassing channels.
Entrapped gas bubbles form large voids inside the primary thermal pad, breaching IPC-A-610 Class 3 void limits of 15 percent total area.
Wet paste height dictates the physical clearance available for flux volatile escape prior to alloy solidification.
Keeping deposit height tightly centered on stencil foil thickness preserves uniform wetting torque across chip components while preventing alloy bridging on micro-pitch pads.
Clause
Commercial purchase orders transform process parameters into binding line-release criteria and warranty obligations. Technical quotes must clearly define paste height control boundaries alongside placement speed metrics. Rework costs erode contract margins.
When contract electronics manufacturers omit statistical height verification records from shipment lots, buyers forfeit engineering defense against latent field interconnect failures.
First article inspection prevents scrap. Contracting terms specify that line changeover sign-offs require fully documented SPI statistical capability reports matching approved stencil drawings. Purchasing contracts must incorporate clear failure accountability rules for out-of-spec paste deposit heights detected at incoming audit.

Line Release and First Article Sign-off Specifications
Initial production approval mandates verified Cpk metrics exceeding 1.33 across all critical passive and active footprints. First-article inspection procedures require processing a five-board pilot run through paste printing and SPI measurement. The contract manufacturer must submit real-time X-bar and R charts showing height distributions across all designated critical-to-quality pads prior to loading components into feeder banks.
| Component Footprint | Stencil Foil Gauge | Target Height Window | Cpk Target | Defect Risk Beyond Tolerance |
|---|---|---|---|---|
| 0201 Passive (0603 metric) | 100 µm | 80 µm to 110 µm | 1.67 | Tombstoning above 115 µm |
| 0.4 mm Pitch QFN | 100 µm | 75 µm to 105 µm | 1.33 | Solder bridging below 0.35 mm spacing |
| 0.8 mm Pitch BGA | 127 µm | 105 µm to 140 µm | 1.33 | Head-in-pillow below 90 µm deposit |

Cost Allocation for Out-of-Spec Rework
Purchasing agreements define financial liability when paste height drift forces assembly lines into unrecorded manual touch-up cycles. Manual solder iron intervention destroys joint metallurgy, introducing brittle intermetallic layers. Standard buyer clauses assign total rework cost, component replacement expense, and scrap panel liabilities directly to the assembler whenever SPI inspection logs reveal un-remediated out-of-control height conditions on production runs.
Section 5.3 of standard IPC-A-610 assembly contracts assigns financial responsibility for lot rejections directly to contract manufacturers who fail to supply signed statistical print height records.