Characterizing Microscopic Copper Surface Profiles for High Voltage Laminates
High-voltage copper characterization uses 3D spatial parameters to cap local peak roughness below two micrometers, preventing field enhancement breakdown.
Peak
Microscopic irregularities residing along electrodeposited conductive foils concentrate high-voltage stress within printed circuit board substrates. Modern power electronics operating above 800 volts DC impose extreme electrostatic gradient forces across thin laminate dielectrics. When copper surfaces exhibit coarse physical teeth, the geometric boundaries between conductive traces and resin matrices become local stress concentrators.
These localized regions trigger early dielectric degradation long before the bulk electrical field reaches nominal withstand limits.
Asperity Geometry and Field Enhancement
Electrostatic lines of force compress around narrow surface protrusions, causing localized field strength to surpass the bulk nominal calculation. This phenomenon follows classical electrostatic field intensification, where the enhancement multiplier scales inversely with the tip radius of microscopic copper projections. A sharp dendrite with a tip radius under 200 nanometers generates localized potential gradients three to five times higher than a smooth planar conductor.
Microscopic peaks act as electric field emitters.
Dielectric breakdown destroys the polymer matrix. Sharp copper dendrites concentrate electric flux. In high-potential multi-layer laminates, this field concentration forces electron injection directly into the resin matrix at moderate working voltages.
Surrounding epoxy-glass interfaces experience accelerated bond scission, charge accumulation, and localized thermal ionization. Specifying mean roughness values alone fails to protect high-potential designs because peak height and tip curvature govern dielectric withstand capacity.
Partial discharge inception voltage drops by 32 percent when peak surface roughness Rz increases from 1.5 to 5.8 micrometers under a 3.0 kV AC stress frequency of 50 hertz.

Foil Manufacturing Classifications and Micro-Structure
Standard electrodeposition processes generate drum-side smooth surfaces and solution-side matte finishes with prominent dendrites. Chemical baths and current densities dictate whether the resulting copper micro-structure takes the form of coarse standard profile, treated low profile, or ultra-low profile configurations. Standard electrodeposited foil features deep mechanical anchors designed for high-peel mechanical applications, but these deep anchors degrade high-voltage insulation margins.
Ultra-low profile foils maintain surface roughness Rz below 1.5 micrometers while preserving narrow peak height distribution spread. Vacuum-deposited and electro-polished options drop micro-topography amplitude further, yielding surface topologies approaching rolled annealed foils. Smooth foil lowers field intensification.
Reducing the micro-topography peak height shifts peak electrical fields back toward nominal theoretical values, preserving the original dielectric clearance calculations embedded within the layout design.
| Foil Topography Profile | Ten-Point Mean Roughness Rz (μm) | Areal Peak Roughness Sa (μm) | Average Peak Radius r_p (nm) | Field Enhancement Factor (β) | Baseline PDIV at 100 μm Core (V peak) |
|---|---|---|---|---|---|
| Standard Electrodeposited (STD ED) | 5.8 to 8.5 | 0.85 to 1.20 | 150 to 280 | 3.4 to 4.8 | 1420 |
| Very Low Profile (VLP) | 2.8 to 4.2 | 0.45 to 0.65 | 320 to 500 | 2.1 to 2.9 | 1850 |
| Hyper Very Low Profile (HVLP) | 1.5 to 2.4 | 0.22 to 0.38 | 650 to 950 | 1.4 to 1.8 | 2240 |
| Ultra Low Profile (ULP) | 0.8 to 1.3 | 0.12 to 0.19 | 1100 to 1800 | 1.1 to 1.3 | 2580 |
| Data measured across 100-micrometer FR-4 cores at 25 degrees Celsius, 45 percent relative humidity, applying 50 Hz AC potential per IPC-TM-650 Method 2.5.5.1. | |||||
Foil manufacturers frequently claim that standard low-profile foils fulfill high-voltage dielectric criteria based solely on generic peel-strength data sheets. Their sales literature highlights mechanical adhesion values while omitting the maximum single-peak height metrics that dictate actual dielectric insulation breakdown limits.

Etch
Chemical treatment sequences alter copper foil surfaces prior to lamination to establish mechanical interlocking with resin matrices. Traditional oxide treatments create long needle-like crystalline structures that increase surface area dramatically. While these oxide structures maximize shear resistance under mechanical stress, they create an aggressive tooth pattern that compromises high-potential insulation barriers.
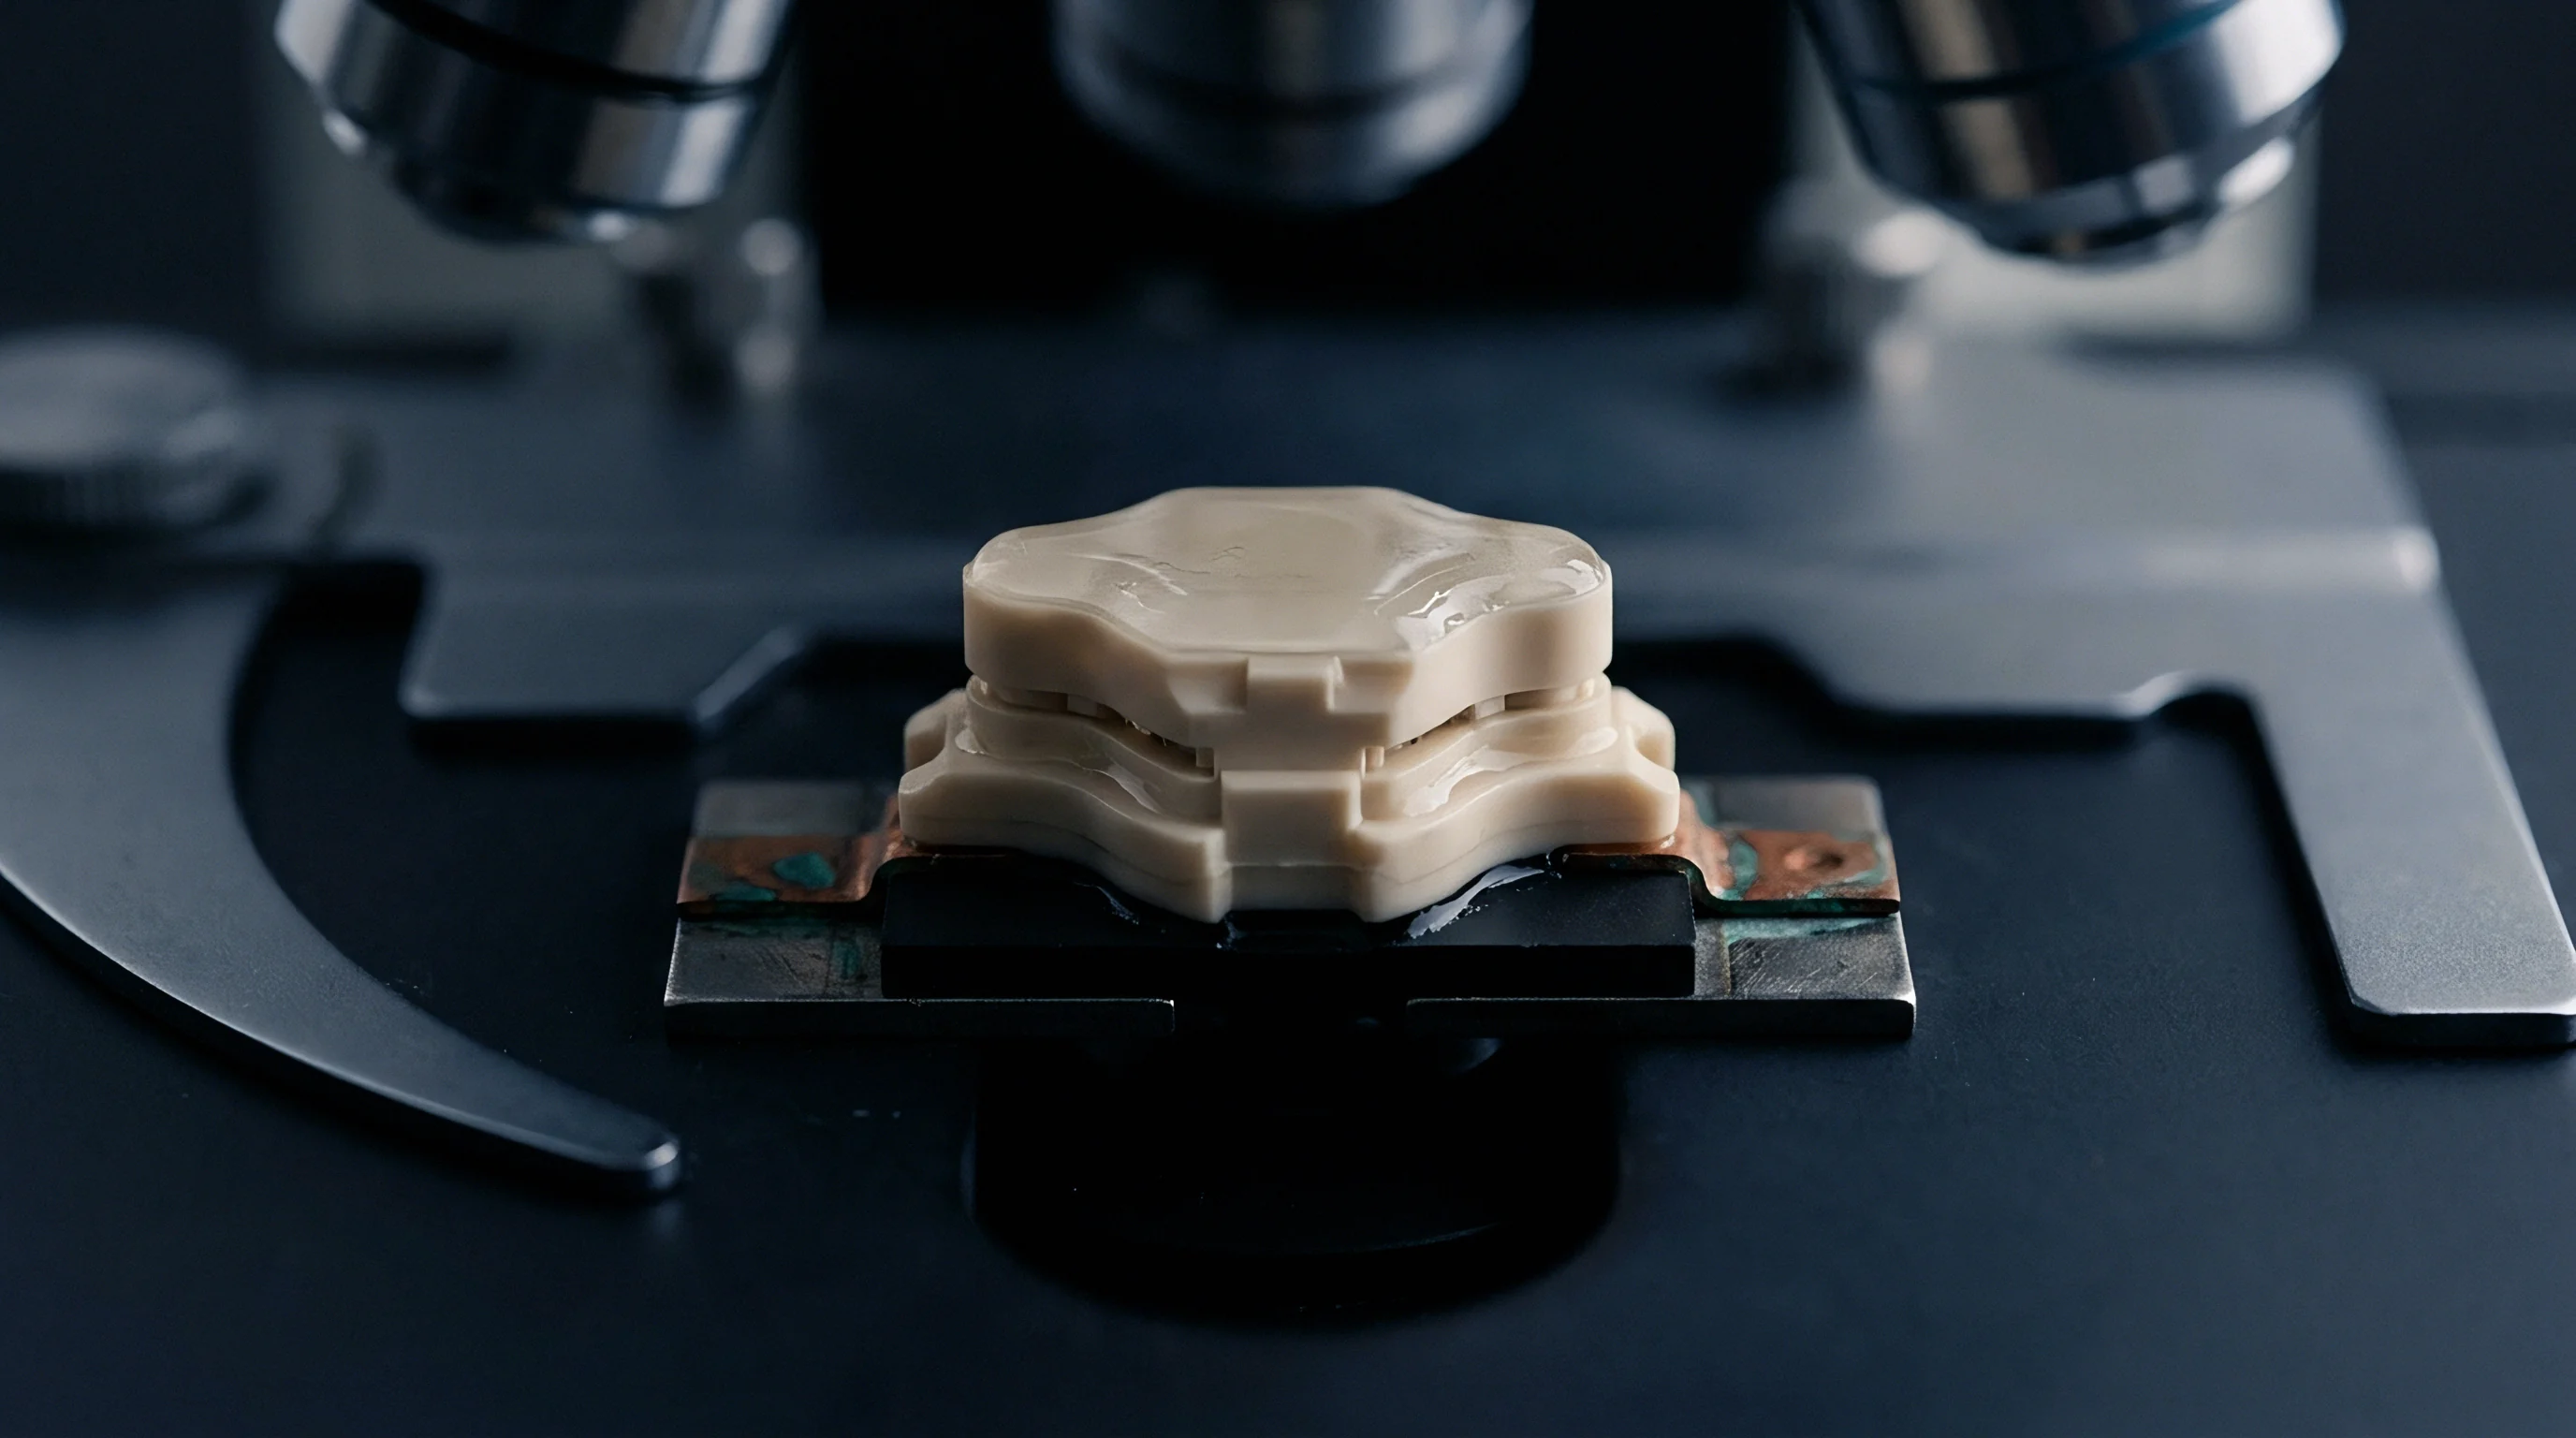
Adhesion Enhancement and Micro-Teeth Mechanics
Pre-preg resin flows around copper projections during press cycles, creating a physical anchor against delamination shear forces. The mechanical strength of this interface relies on physical interlocking, where epoxy penetrates deep micro-cavities. Resin infiltration fills mechanical voids.
When laminates experience thermal shock or bending stress, deep teeth prevent boundary separation and pad lifting.
Alternative oxide processes and silane-based micro-etches replace long crystalline structures with controlled chemical topography. Hydrogen peroxide-sulfuric acid micro-etching removes targeted metal grain boundaries, yielding shallow, rounded micro-cavities. These rounded cavities maintain acceptable peel performance while eliminating the razor-sharp conductive asperities responsible for field concentration.
Micro-roughness reduces creepage distance.
Deep chemical micro-etching elevates mechanical bond strength while diminishing dielectric breakdown endurance.
Peel Strength against Electrical Breakdown Arithmetic
Evaluating a 500-volt power conversion substrate reveals the direct trade-off between mechanical joint integrity and dielectric endurance. Take a 500-volt DC power stage laminate lot with an 18-micrometer copper foil pressed onto a 180-micrometer FR-4 core containing a baseline dielectric breakdown strength of 40 kV/mm. The nominal dielectric withstand capacity of this 180-micrometer core calculates to 7.2 kV DC under ideal planar field conditions.
Processing the foil through a coarse chemical etch removes 2.5 micrometers of metal, producing a surface profile with an average peak-to-valley height Rz of 5.2 micrometers and an average peak tip radius r_p of 220 nanometers. Under these parameters, the localized electric field enhancement factor beta calculates to:
beta = 1 + (Rz / (2 r_p)) = 1 + (5.2 / (2 0.22)) = 12.8
This high field enhancement factor reduces the effective dielectric breakdown threshold of the interface layer. Peak local field stress reaches the critical 40 kV/mm dielectric breakdown limit of FR-4 epoxy at an applied voltage of only 562 volts DC, leaving a minimal safety margin above the 500-volt working potential. Mechanical peel testing on this substrate yields a strong adhesion rating of 1.15 N/mm.
Substituting a controlled micro-etch sequence limits metal removal to 0.6 micrometers, producing an Rz of 1.2 micrometers and a broader peak tip radius r_p of 850 nanometers. Recalculating the field enhancement factor yields:
beta = 1 + (1.2 / (2 0.85)) = 1.7
With beta reduced to 1.7, the local breakdown voltage threshold rises to 4.23 kV DC across the same 180-micrometer core. Operating the 500-volt system against a 4.23 kV failure threshold establishes an effective baseline security factor. Mechanical peel strength drops modestly to 0.82 N/mm, which remains well within the IPC-4101 minimum acceptance limit of 0.70 N/mm for high-reliability rigid laminates.
Optimizing chemical micro-etch depth to the minimum threshold required for IPC peel compliance preserves dielectric withstand margins without risking mechanical delamination during solder refill cycles.


Breakdown
Dielectric failure in high-potential laminates initiates through localized partial discharges occurring at micro-scale copper projections. Continuous voltage stress drives electron field emission from sharp metallic peaks into adjacent micro-voids in the resin. Over time, these localized discharge events convert solid epoxy into carbonized conductive paths, weakening the surrounding insulation structure.
Partial Discharge and Corona Inception Mechanics
Sustained high potential across thin dielectric barriers energizes microscopic gas voids adjacent to sharp metal profiles. When the local electric field across an internal void exceeds the ionization threshold of air or trapped volatiles, electron avalanche breakdown occurs. Localized electrostatic potential initiates internal corona.
Each partial discharge event bombards the surrounding polymer chain with high-energy ions, degrading the epoxy matrix via chemical scission.
Partial discharge inception voltage (PDIV) marks the absolute threshold where sustained micro-arcing begins. Because partial discharges occur deep inside the solid dielectric interface without causing immediate short circuits, they escape standard high-potential factory screening tests. Continuous operation above the PDIV level leads to cumulative insulation damage, culminating in sudden field failure after hundreds of operating hours.
Progressive Treeing and Weibull Life Expectancy
Electrical stress channels branch through polymer matrices over operational life, driven by continuous charge injection. These microscopic channels form tree-like hollow structures that propagate along stress field gradients toward opposing conductors. High voltage stress accelerates dielectric aging.
As tree structures extend, the remaining un-damaged dielectric barrier narrows, escalating field stress across the surviving material.
- Sharp copper asperities emit electrons into adjacent polymer cavities under high potential gradients.
- Localized partial discharges break molecular bonds in epoxy resins, creating gaseous micro-voids.
- High-voltage stress forces conductive carbon residue to deposit along internal void walls.
- Microscopic electrical trees extend radially from the copper interface along dielectric stress paths.
- Unbranched carbon channels bridge the remaining insulating core, producing catastrophic punch-through shorting.
Dielectric punch-through causes sudden shorting. Weibull life-distribution analysis demonstrates that laminates featuring high copper roughness exhibit a broader shape parameter beta and a dramatically reduced scale parameter alpha under voltage endurance testing. A coarse surface profile shifts the failure curve to the left, shortening total operating life under continuous voltage stress.
IPC-TM-650 Method 2.5.6.1 mandates testing breakdown voltage under oil, masking air-interface partial discharges that cause field failures in unencapsulated high-voltage assemblies.
Selecting coarse copper foils to satisfy extreme mechanical peel requirements shortens the operational life of high-voltage power laminates through accelerated partial discharge treeing, leading to unexpected field returns and catastrophic system loss.

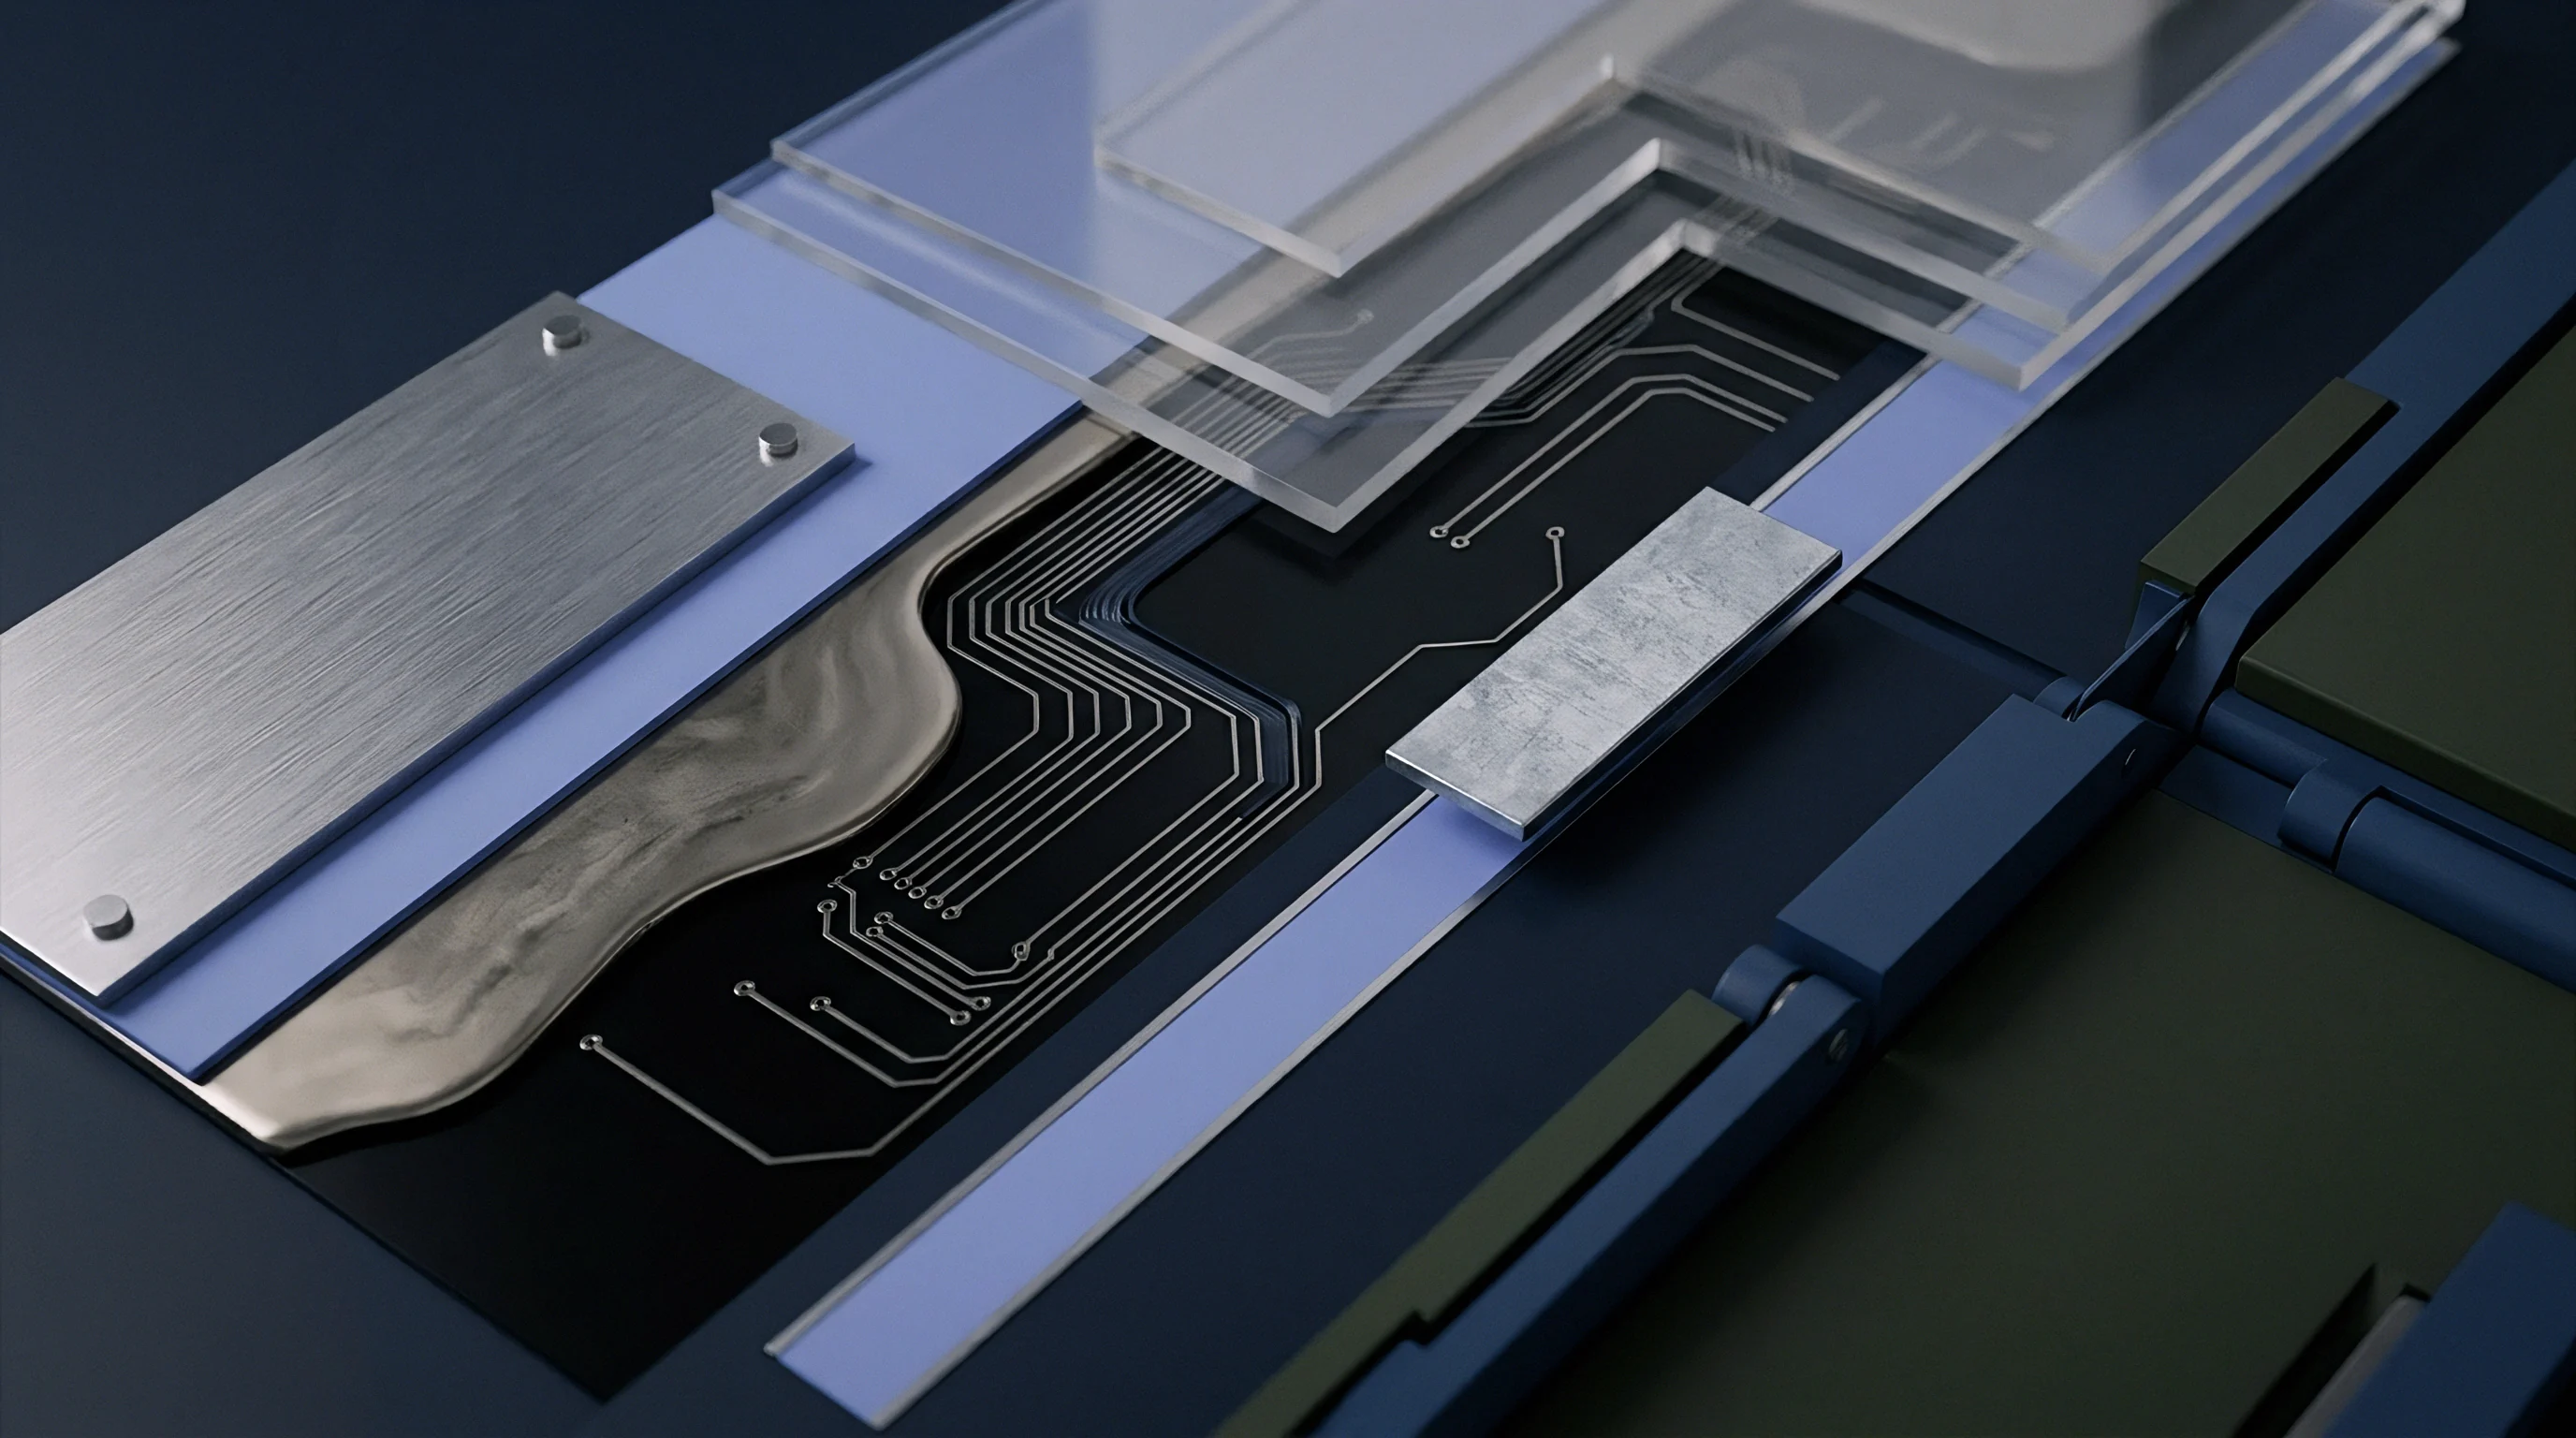
Metrology
Assessing high-potential printed circuit foils demands spatial profile metrics rather than single-line surface averages. Traditional profilometry measures roughness along a single line, missing isolated sharp peaks that act as primary sites for electron emission. Modern high-voltage dielectric qualification relies on full three-dimensional spatial parameters captured across representative surface areas.

How Does Spatial Surface Volume Correlate with Voltage Breakdown?
Three-dimensional surface mapping captures peak height distributions and valley depths across a full sampling area. Area-based parameters account for the volumetric concentration of sharp features that single-line profilometry ignores. Optical interferometry measures profile height.
Peak height determines local stress. Defining surface quality through spatial volume parameter sets enables accurate modeling of localized electric field intensity.
Surface parameters determine field concentration. Spatial peak height Sz identifies the absolute distance between the tallest peak and deepest valley within the measured field of view. Root-mean-square surface slope Sdq quantifies the average steepness of microscopic features, directly indicating peak tip sharpness.
High Sdq values combined with elevated Sz metrics reliably indicate severe local electric field intensification.
| Metrology Method | Lateral Resolution | Vertical Resolution | Field of View / Trace | Primary Output Parameters | Field-Emission Predictive Value |
|---|---|---|---|---|---|
| Contact Stylus Profilometry | 2.0 μm to 5.0 μm | 10.0 nm | 12.5 mm line trace | Ra, Rz, Rq | Poor (misses localized peaks) |
| White Light Interferometry (WLI) | 0.5 μm to 1.1 μm | 0.1 nm | 0.8 mm x 0.8 mm area | Sa, Sz, Sdq, Sdr | High (captures spatial peak density) |
| Laser Scanning Confocal (LSCM) | 0.2 μm to 0.4 μm | 1.0 nm | 0.4 mm x 0.4 mm area | Sa, Sz, Ssk, Spk | High (resolves deep micro-cavities) |
| Atomic Force Microscopy (AFM) | 1.0 nm to 5.0 nm | 0.05 nm | 50 μm x 50 μm area | Tip radius r_p, Local slope | Extreme (maps individual dendrites) |
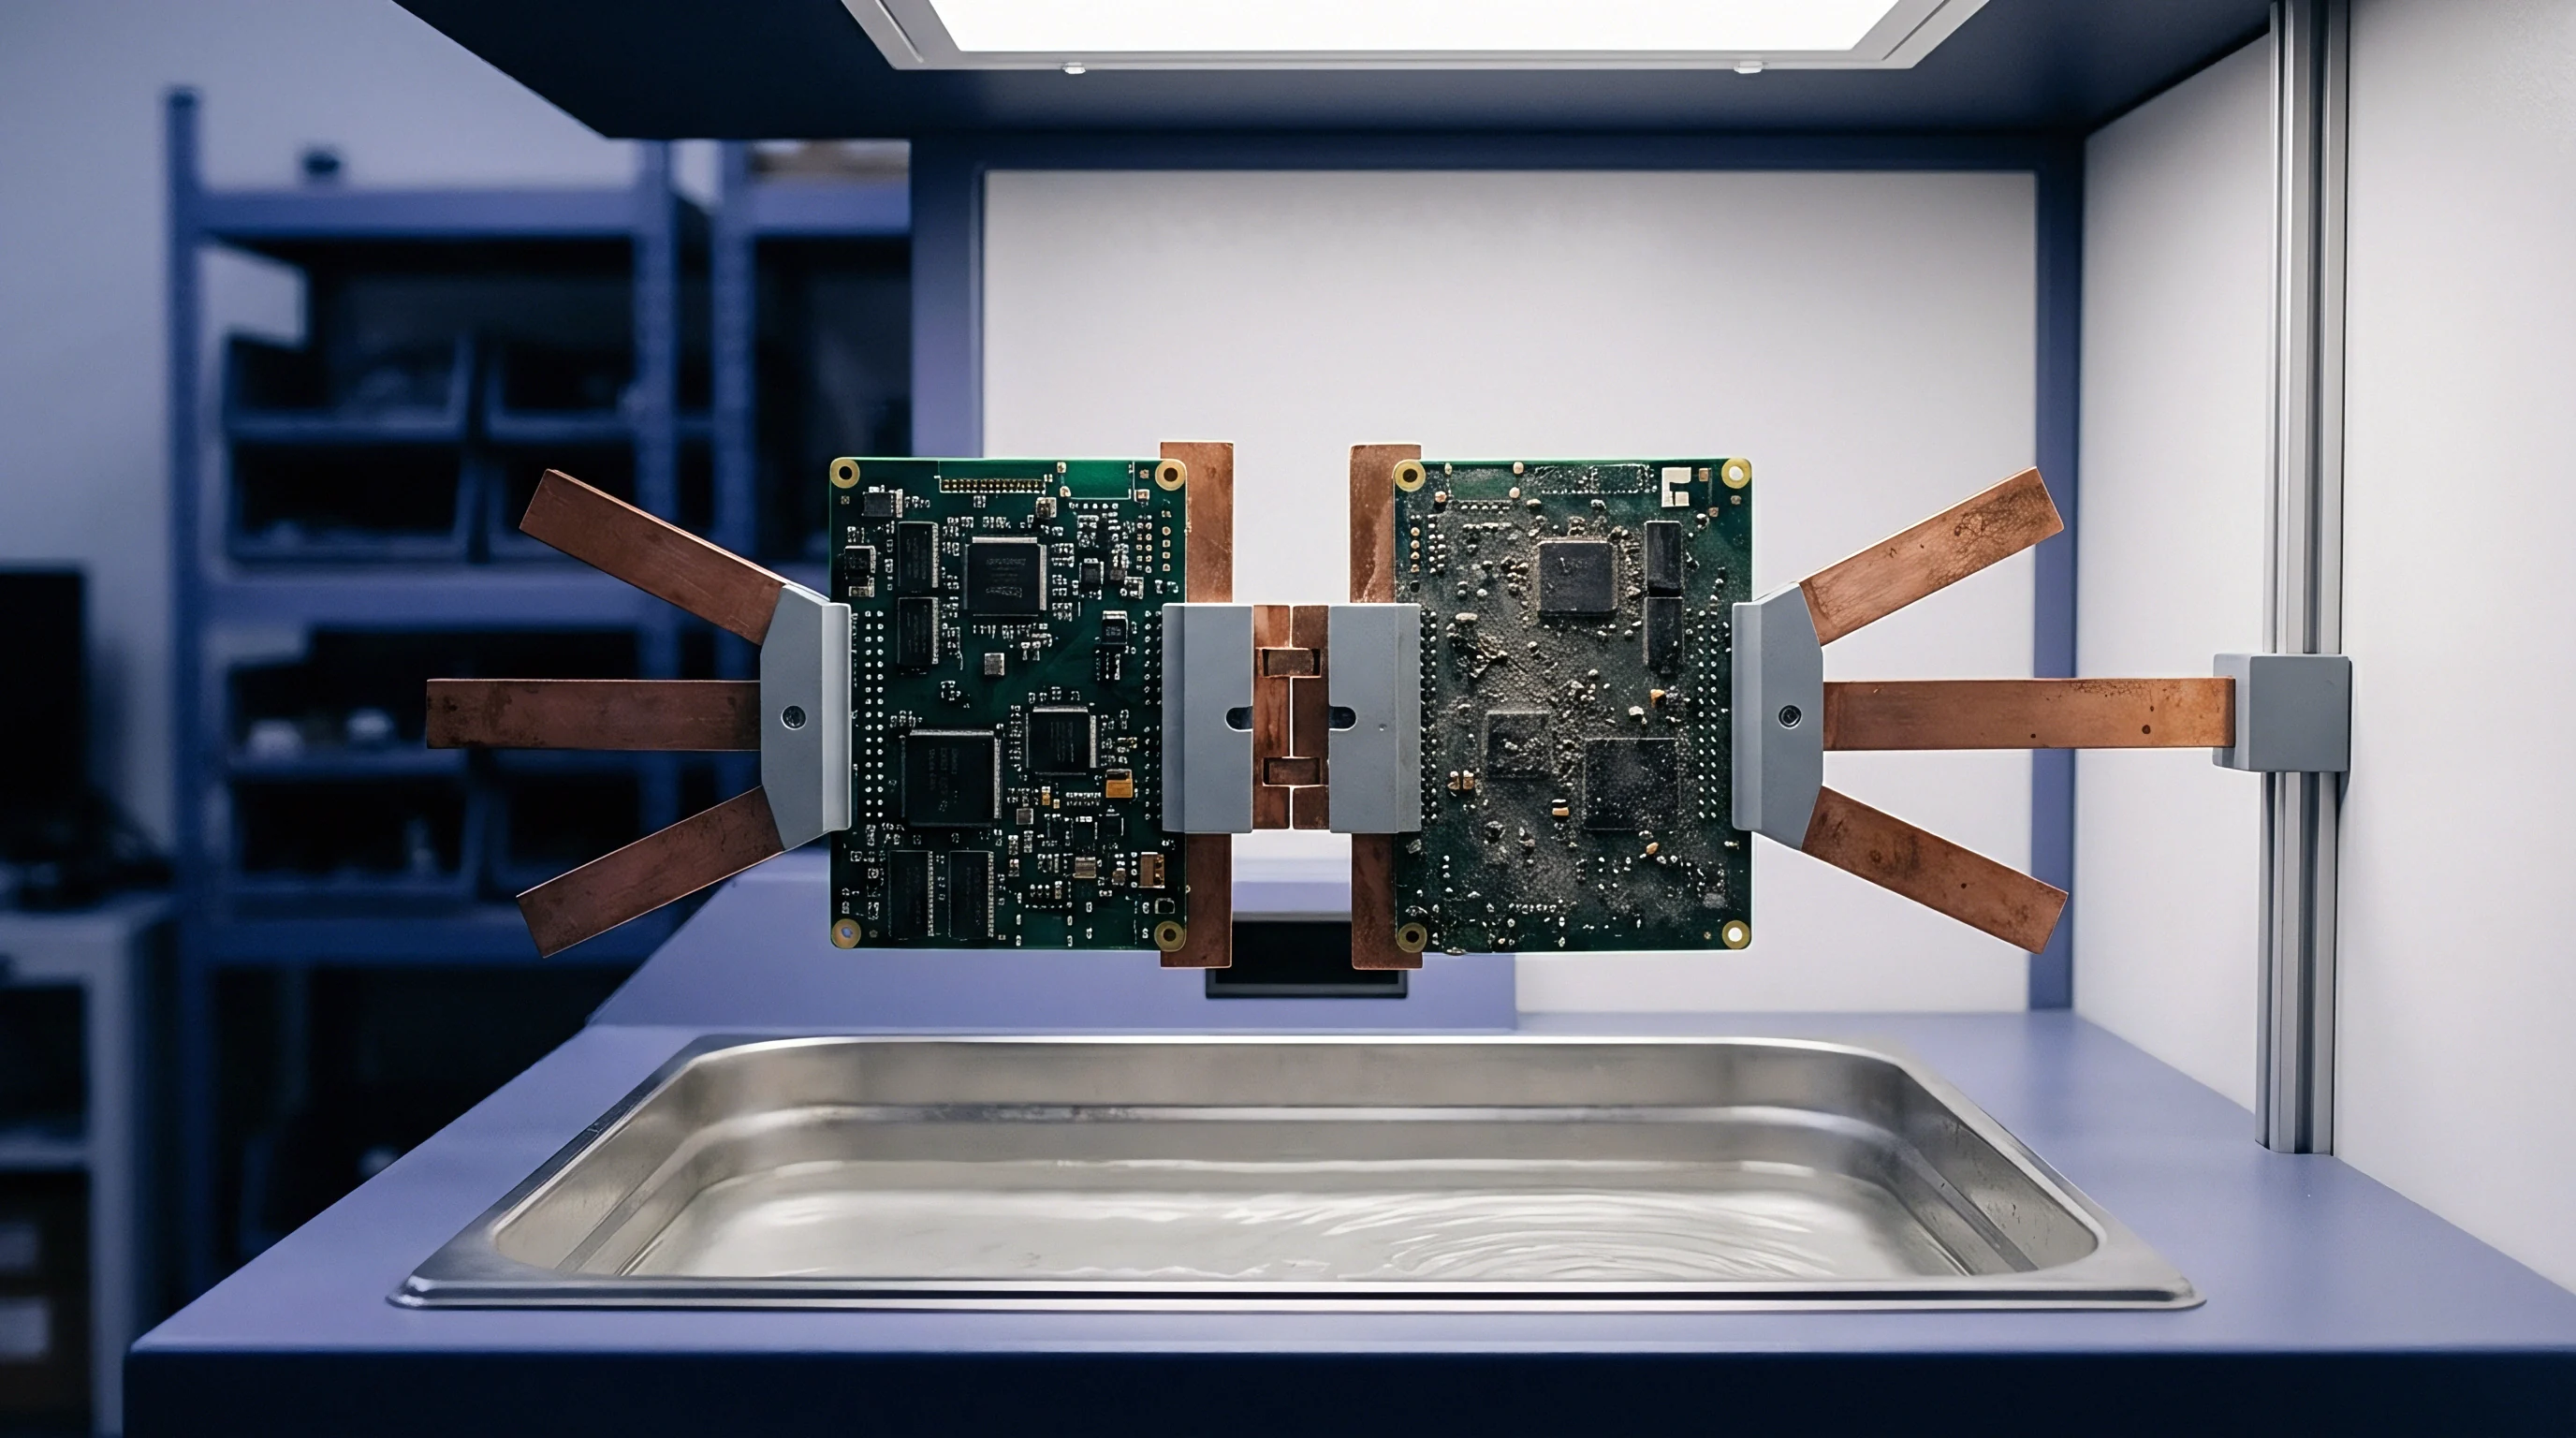
Limitations of Two-Dimensional Line Parameters
Linear profilometer stylus sweeps frequently bypass the tallest local asperities on treated foil surfaces. Stylus tips with radii larger than two micrometers fail to drop into narrow valleys or resolve sharp peak radii under 500 nanometers. Profilometry trace lines miss spatial peaks.
Relying on 2D Ra measurements creates a false sense of security, as two foils with identical Ra numbers can exhibit dramatically different peak densities and field enhancement factors.
- Stylus tip mechanical filtering masks sharp dendrite tips having radii smaller than the physical diamond stylus point.
- Single-line trace positioning fails to intersect isolated maximum peak height anomalies across the foil surface area.
- Average roughness math Ra mathematically dampens the statistical significance of occasional severe peak outliers.
- Two-dimensional line profiles omit surface slope gradient information necessary to calculate localized electrostatic enhancement.
- Spatial Maximum Peak Height Sz establishes the absolute peak-to-valley clearance boundary within a defined measurement area.
- Root-Mean-Square Surface Slope Sdq calculates average local surface steepness to predict electric field intensification factors.
- Surface Area Development Ratio Sdr measures additional surface area provided by micro-topography relative to a flat plane.
- Reduced Peak Height Spk isolates top surface peak structures that directly penetrate surrounding dielectric insulation matrices.
Single-line profilometer traces miss isolated microscopic copper teeth that concentrate high-voltage electric fields.
Whether non-destructive optical interferometry can entirely replace destructive cross-sectional scanning electron microscopy for validating high-voltage copper interface profiles across volume production batches remains an open operational question.

Acceptance
Material qualification protocols for high-power substrate procurement mandate rigorous cross-sectional verification and baseline electrical stress testing. Receiving raw laminate materials without verified copper surface metrics exposes downstream operations to hidden insulation defects. A robust quality file demands certified spatial surface parameter reports alongside standard breakdown strength certificates.
Qualification Dossier Requirements for High Voltage Foils
Technical files accompanying raw core shipments contain verified spatial roughness datasets alongside bulk breakdown proofs. Procurement agreements must stipulate maximum allowable Sz and Sdq limits tailored to the working voltage class of the end product. Material test reports citing only Ra values fail to demonstrate regulatory compliance for high-voltage automotive or industrial power conversions.
Batch acceptance testing mandates pulling cross-sectional micro- coupons for metallographic examination. High-resolution scanning electron microscopy confirms that micro-etch treatment profiles maintain uniform peak geometry without localized dendrite spikes. Coupling physical coupon microsections with partial discharge inception testing establishes an audit trail that proves dielectric compliance before boards enter production assembly.

Guard-Banding Specifications against Profile Tolerances
High-voltage substrate specifications set minimum dielectric thickness limits higher than bulk nominal values to absorb local roughness variability. Designers must subtract maximum peak roughness Sz from nominal core thickness when performing clearance and breakdown calculations. A core specified at 100 micrometers nominal thickness containing a foil profile with an Sz of 8 micrometers provides an effective dielectric barrier of only 92 micrometers.
Contractual procurement specifications incorporate guard-banding factors that penalize coarse profile copper foils by mandating thicker dielectric cores. IPC-4101 specification sheets provide baseline mechanical standards, but high-voltage applications enforce secondary master purchase specifications that restrict surface profile metrics beyond generic industry baselines.
IPC-4101 Clause 3.8.4 mandates minimum sheet peel strength compliance while permitting suppliers to supply alternate copper profile classifications unless explicit maximum spatial roughness limits are written directly into the master purchase order.