Characterizing Sub-Milliohm Current Density Distribution Anomalies across Ultra-Fine Pitch Multi-Chiplet Substrates
Sub-milliohm substrate resistance shifts trigger severe current crowding across microbump arrays, demanding high-precision thermal and magnetic screen metrology.


Grid
Ultra-fine pitch multi-chiplet architectures rely on power delivery networks fabricated within glass, silicon, or organic interposers to route hundreds of amperes at operating voltages below one volt. Delivering transient current across thousands of microbumps spaced at pitches under 30 micrometers requires total DC loop resistance to remain strictly in the sub-milliohm domain. When localized path resistance drifts by even 0.2 milliohms, current flow departs from finite element models, creating localized current density spikes that accelerate physical degradation.

Power Delivery Interconnect Physics
Modern high-performance computing chiplets route power rails through dedicated redistribution layers and high-density vertical interconnects. Target impedance profiles for these multi-chiplet power grids often demand AC and DC loop resistances below 150 micro-ohms from the voltage regulator module down to the silicon die pads. A single copper pillar at a nominal pitch of 25 micrometers carries up to 350 milliamperes under peak compute loads.
Maintaining uniform distribution across a parallel array of 10,000 microbumps depends on identical trace geometry, clean interfacial metallurgy, and consistent planarization across the substrate.
Anomalous current distribution occurs when structural micro-defects or material variations alter localized electrical impedance along specific paths. A minor increase in parasitic resistance along one route forces current into adjacent interconnects. This redistribution pushes localized current density past the electromigration threshold of copper and tin-based solders, setting off thermal feedback loops that compound structural decay.
Substrate Interposer Stack Geometry
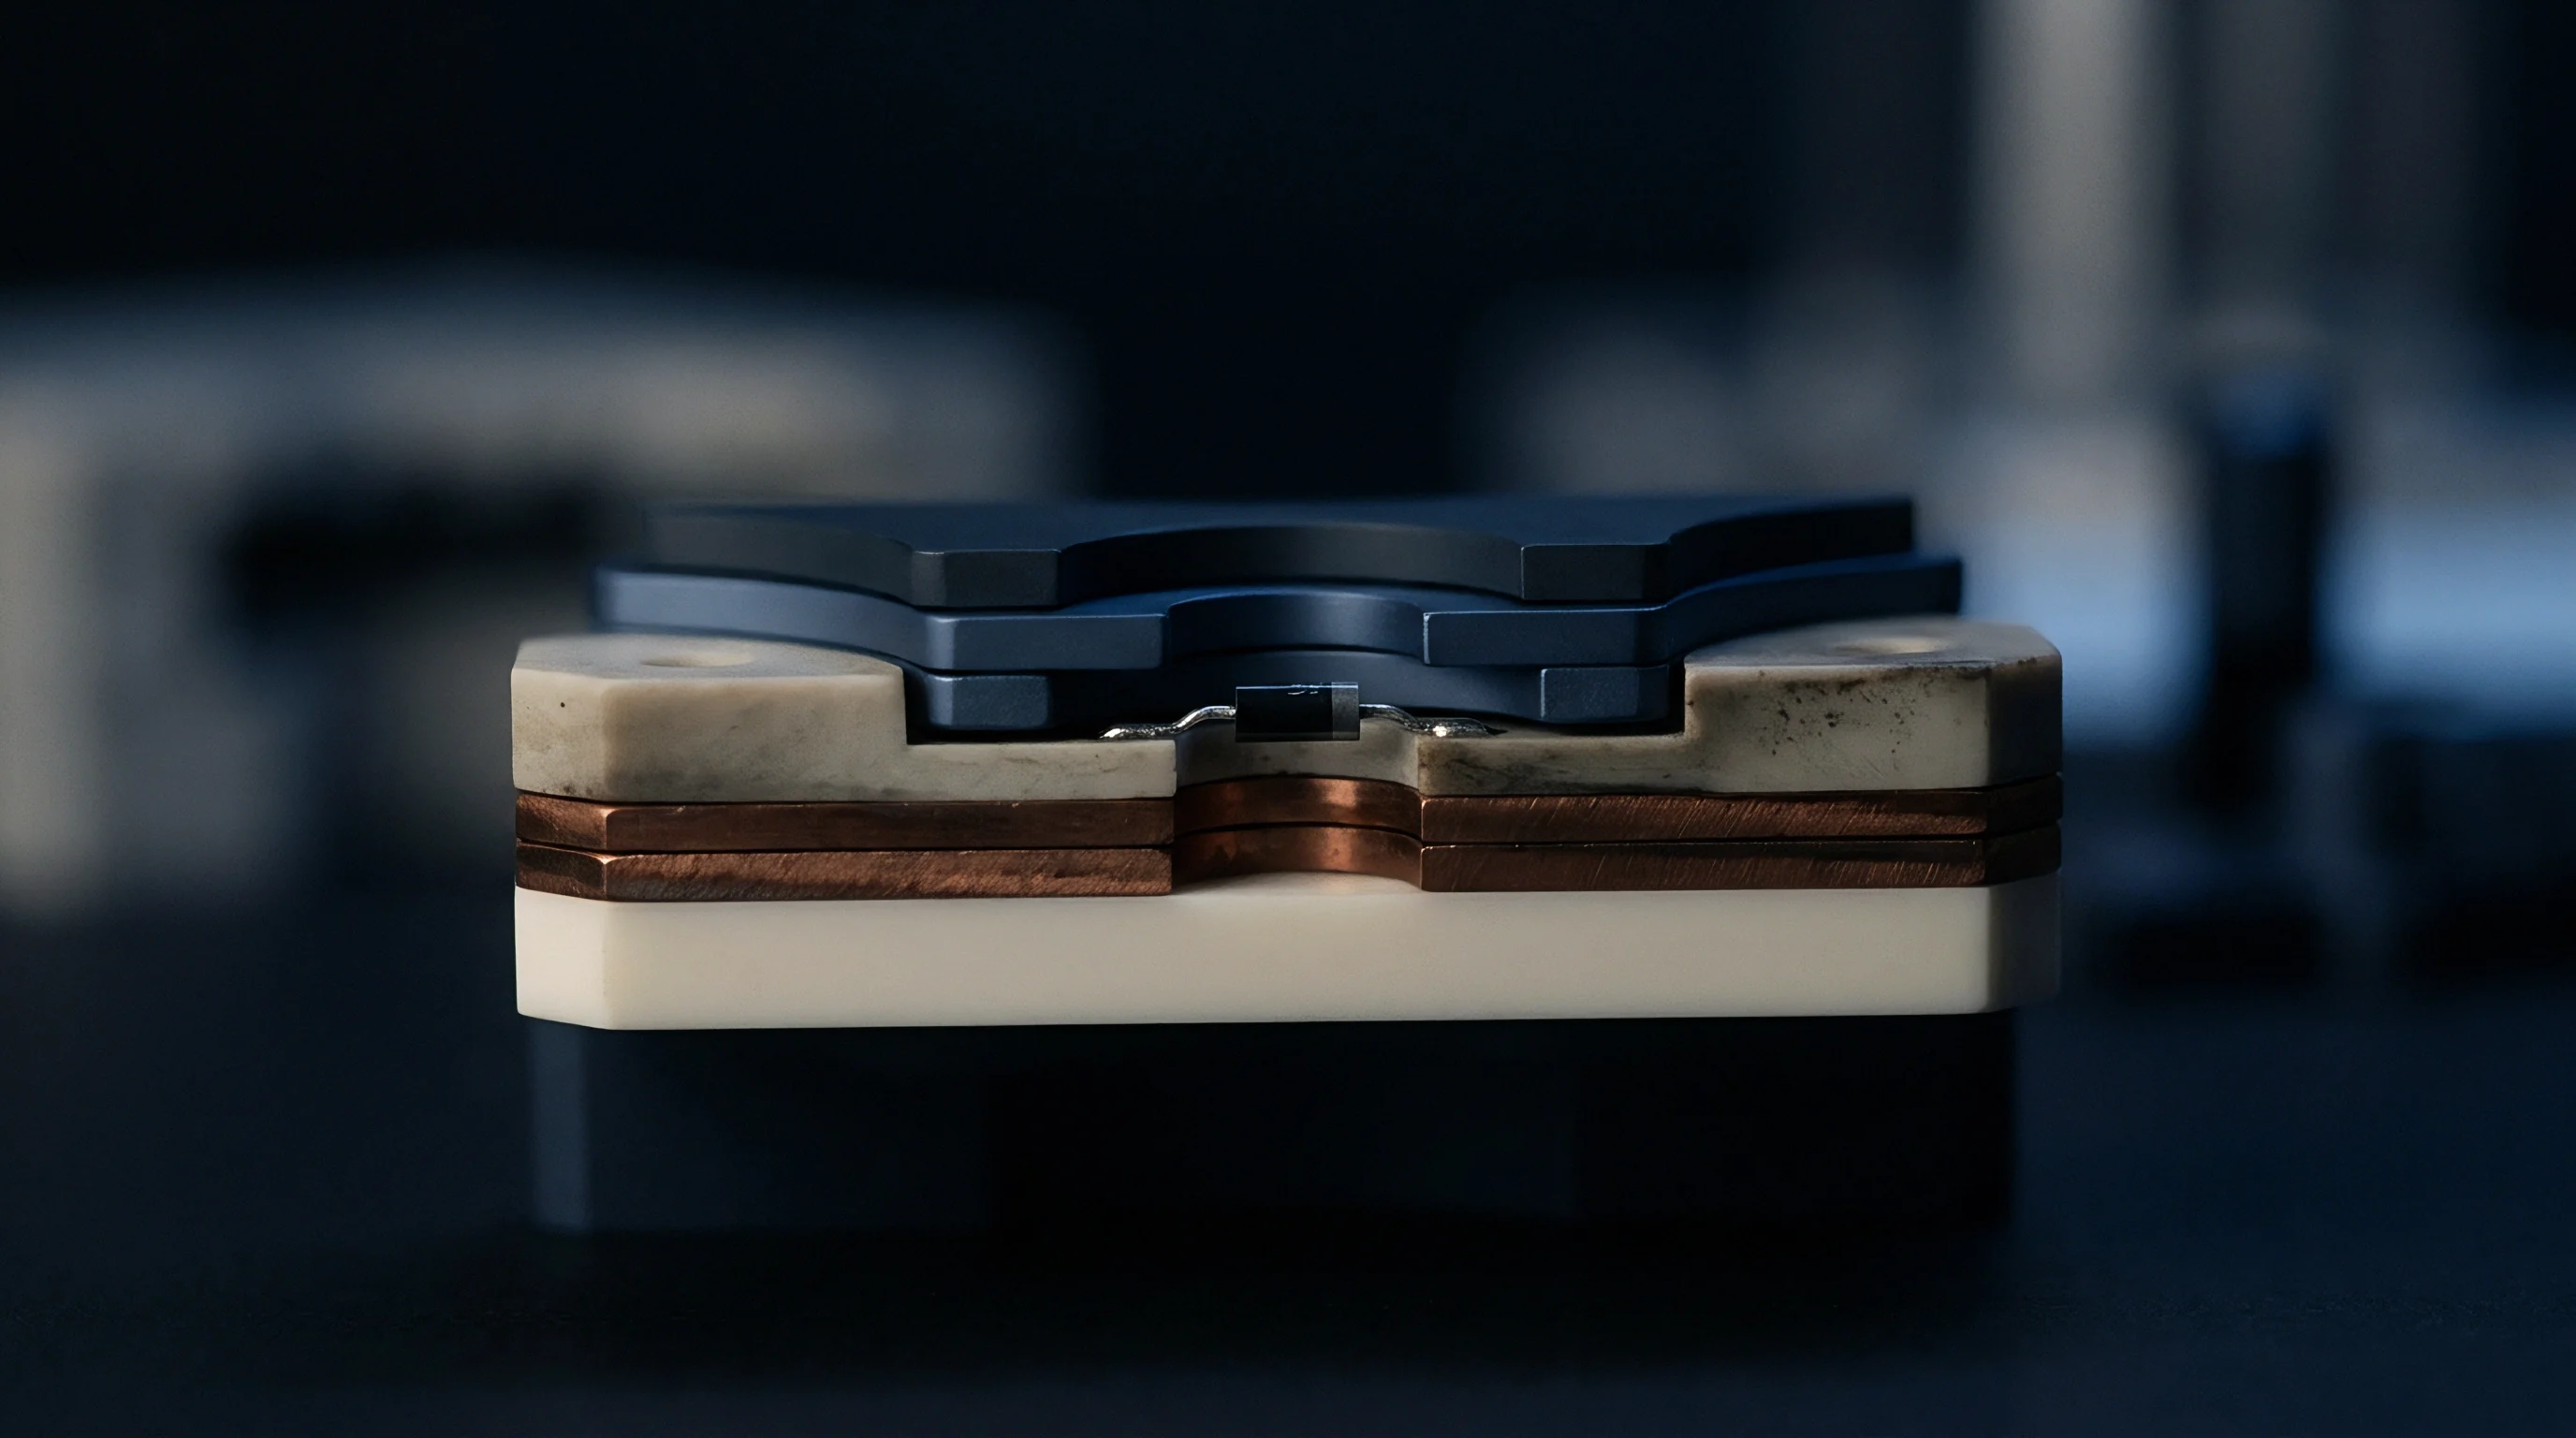
Substrate architectures rely on stacked dielectric layers paired with high-aspect-ratio through-silicon vias or through-glass vias to bridge power planes across packaging levels. Dimensional variations in layer thickness or via diameter directly alter local current capacity. Variations of plus or minus 0.5 micrometers on trace widths noticeably shift resistance values within sub-milliohm networks.
Impedance non-uniformities across redistribution layers disrupt current sharing among parallel interconnect nodes. When current concentrates into a smaller subset of microbumps, localized ohmic heating raises operating temperatures by tens of degrees Celsius above adjacent regions. This thermal imbalance destabilizes threshold voltages in neighboring compute cores and degrades signal integrity across fine-pitch data links.
Substrate test escapes involving sub-milliohm anomalies push costs directly into field failures, where replacing a multi-chiplet assembly can run up to thirty times the original substrate manufacturing expense.
Crowding
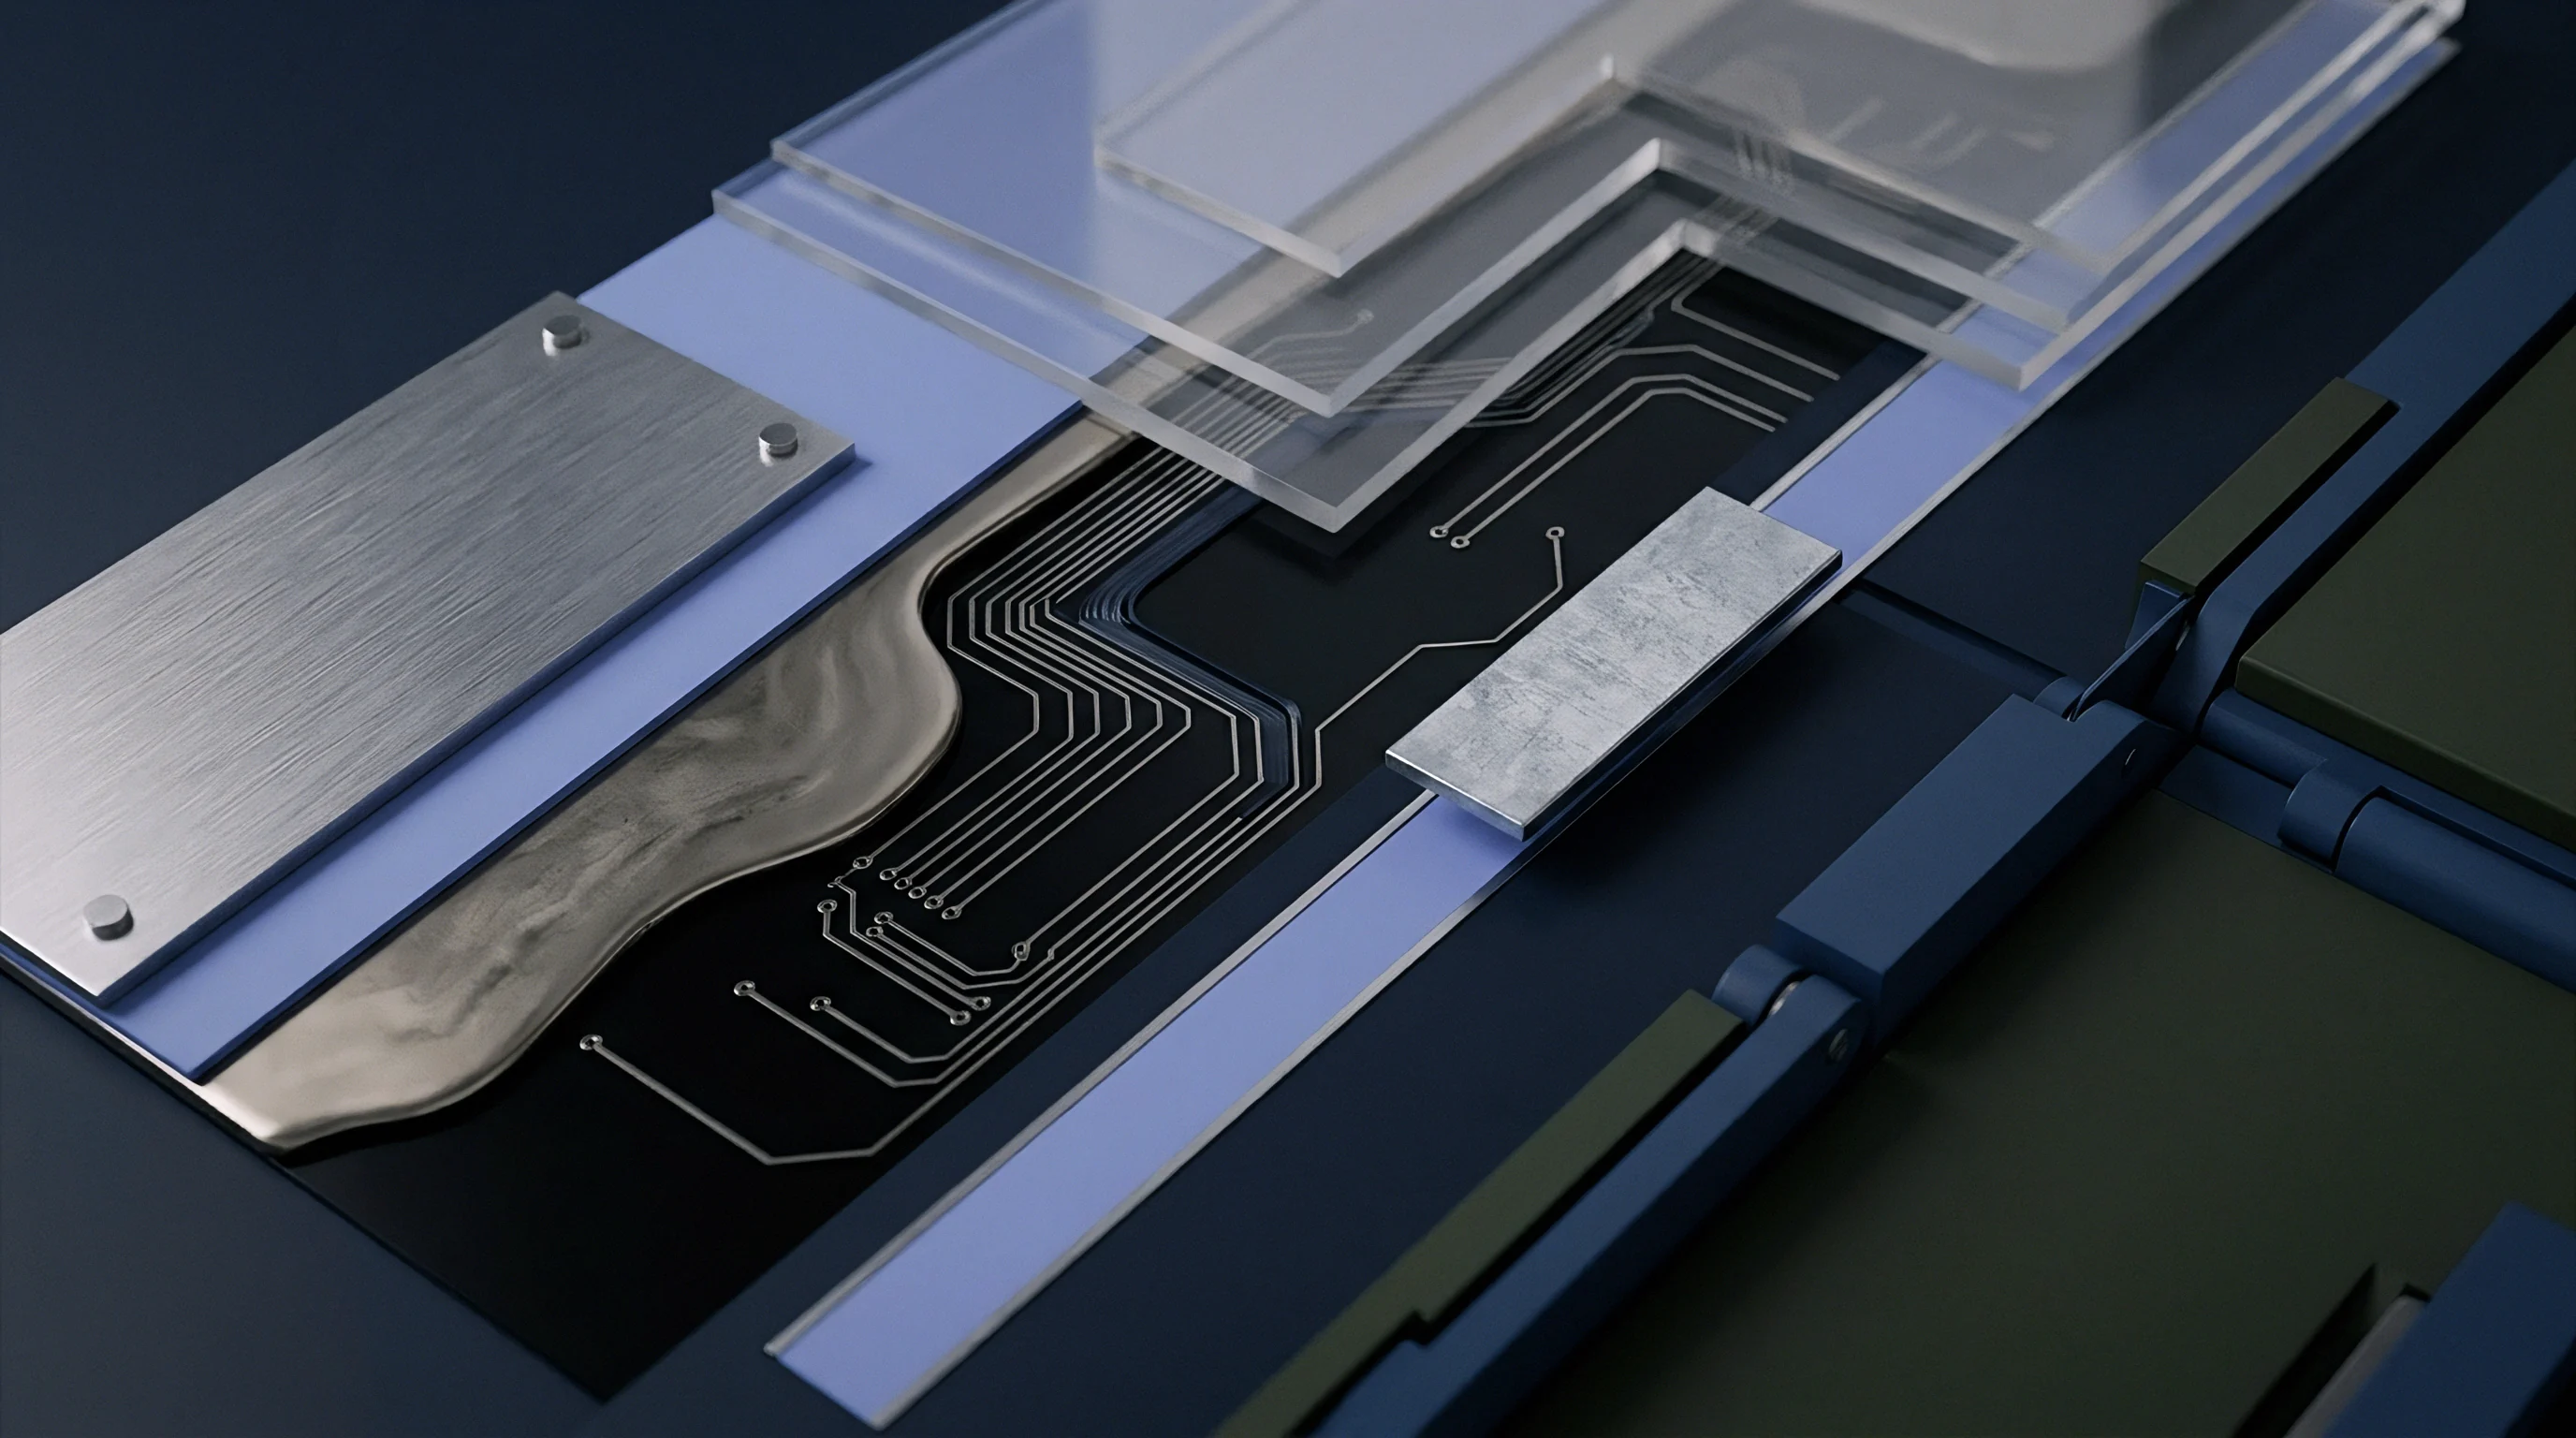
Localized spikes in current density generate distinct structural failure modes inside ultra-fine pitch interconnect arrays. Current crowding concentrates electron flow along the leading edge of microbump contact zones, accelerating metal migration and atomic displacement. Isolating these sub-milliohm anomalies requires identifying the primary material defects driving current concentration.

Microstructural Failure Mechanisms
Structural defects within microbump interfaces develop during electroplating, reflow, or thermal bonding processes. Intermetallic compound growth produces brittle, high-resistance phases between solder cap and copper pillar interfaces. Kirkendall void formation develops along intermetallic boundaries under high-temperature operation, severely constricting the physical cross-sectional area available for conduction.
- Electromigration Atom Voiding driven by momentum transfer between conducting electrons and metal lattice ions creates structural voids at high current density entry points.
- Intermetallic Compound Phase Shifts form high-resistivity ternary phases that reduce total cross-sectional conductivity across the solder joint.
- Sub-Surface Micro-Cracking originates from thermal expansion mismatches between dielectric layers and copper planes, restricting lateral current dispersion.
- Delamination At Passivation Interfaces detaches power planes from substrate vias, forcing current through adjacent high-resistance alternative paths.
Micro-voiding reduces effective contact surface area, multiplying localized current density even when total current stays within nominal operating limits. As localized resistance rises by fractions of a milliohm, current shifts into surrounding parallel interconnects, triggering secondary current crowding events in neighboring joints.
A 0.4 milliohm resistance delta across a 45 micrometer copper pillar array increases localized power dissipation by 1.2 watts per square millimeter at 35 amperes continuous load.

Electromigration Threshold Acceleration
High current density accelerates metal transport according to Black’s equation, where atomic drift velocity scales exponentially with temperature and directly with current density squared. When localized anomalies elevate current density past 10^6 amperes per square centimeter, vacancy flux creates macroscopic voids within hundreds of operating hours. These voids further reduce conductor cross-sections, escalating current density until open-circuit conditions or thermal runaway occur.
| Failure Mode | Physical Root Cause | Typical Impedance Shift (µΩ) | Current Density Impact |
|---|---|---|---|
| Micro-voiding at pillar cap | Electroplating contaminant entrapment | 120 to 350 | +180% at void perimeter |
| Asymmetrical IMC growth | Non-uniform thermal reflow gradient | 200 to 600 | +85% along copper interface |
| Via sidewall thinning | Deep reactive ion etch non-uniformity | 150 to 450 | +220% at via necking zone |
| Passivation interface crack | Coefficient of thermal expansion mismatch | 300 to 1100 | +340% in adjacent vias |
Sub-milliohm resistance shifts are sometimes evaluated as acceptable processing variations within published manufacturing tolerances, on the premise that parallel interconnect redundancy safely absorbs minor current imbalances during standard operation.


Mapping
Detecting sub-milliohm anomalies embedded within multi-layer substrates requires specialized non-destructive metrology tools capable of resolving micro-ampere current shifts and micro-kelvin thermal differentials. Standard two-point and four-point resistance meters lack the spatial resolution and sensitivity needed to isolate buried resistance shifts inside complex power distribution networks.

High-Resolution Metrology Regimes
Lock-in Thermography applies an alternating current excitation signal to the power distribution network while tracking infrared emissions with a synchronized thermal camera. By averaging thermal signatures over thousands of excitation cycles, Lock-in Thermography resolves temperature changes down to tens of micro-kelvins, pinpointing localized power dissipation caused by sub-milliohm current shunts.
Scanning Superconducting Quantum Interference Device Microscopy detects minute magnetic flux variations generated by current flowing through substrate planes. Because magnetic fields penetrate dielectric layers without attenuation, magnetic field imaging maps internal current density vectors directly. Reconstructing current distributions from magnetic vector maps reveals sub-surface current crowding prior to physical thermal manifestation.
Non-compliance with IPC-9252 Class 3 sub-surface continuity thresholds voids the substrate batch warranty certificate automatically.
Is Magnetic Field Imaging Effective for Buried Layer Anomalies?
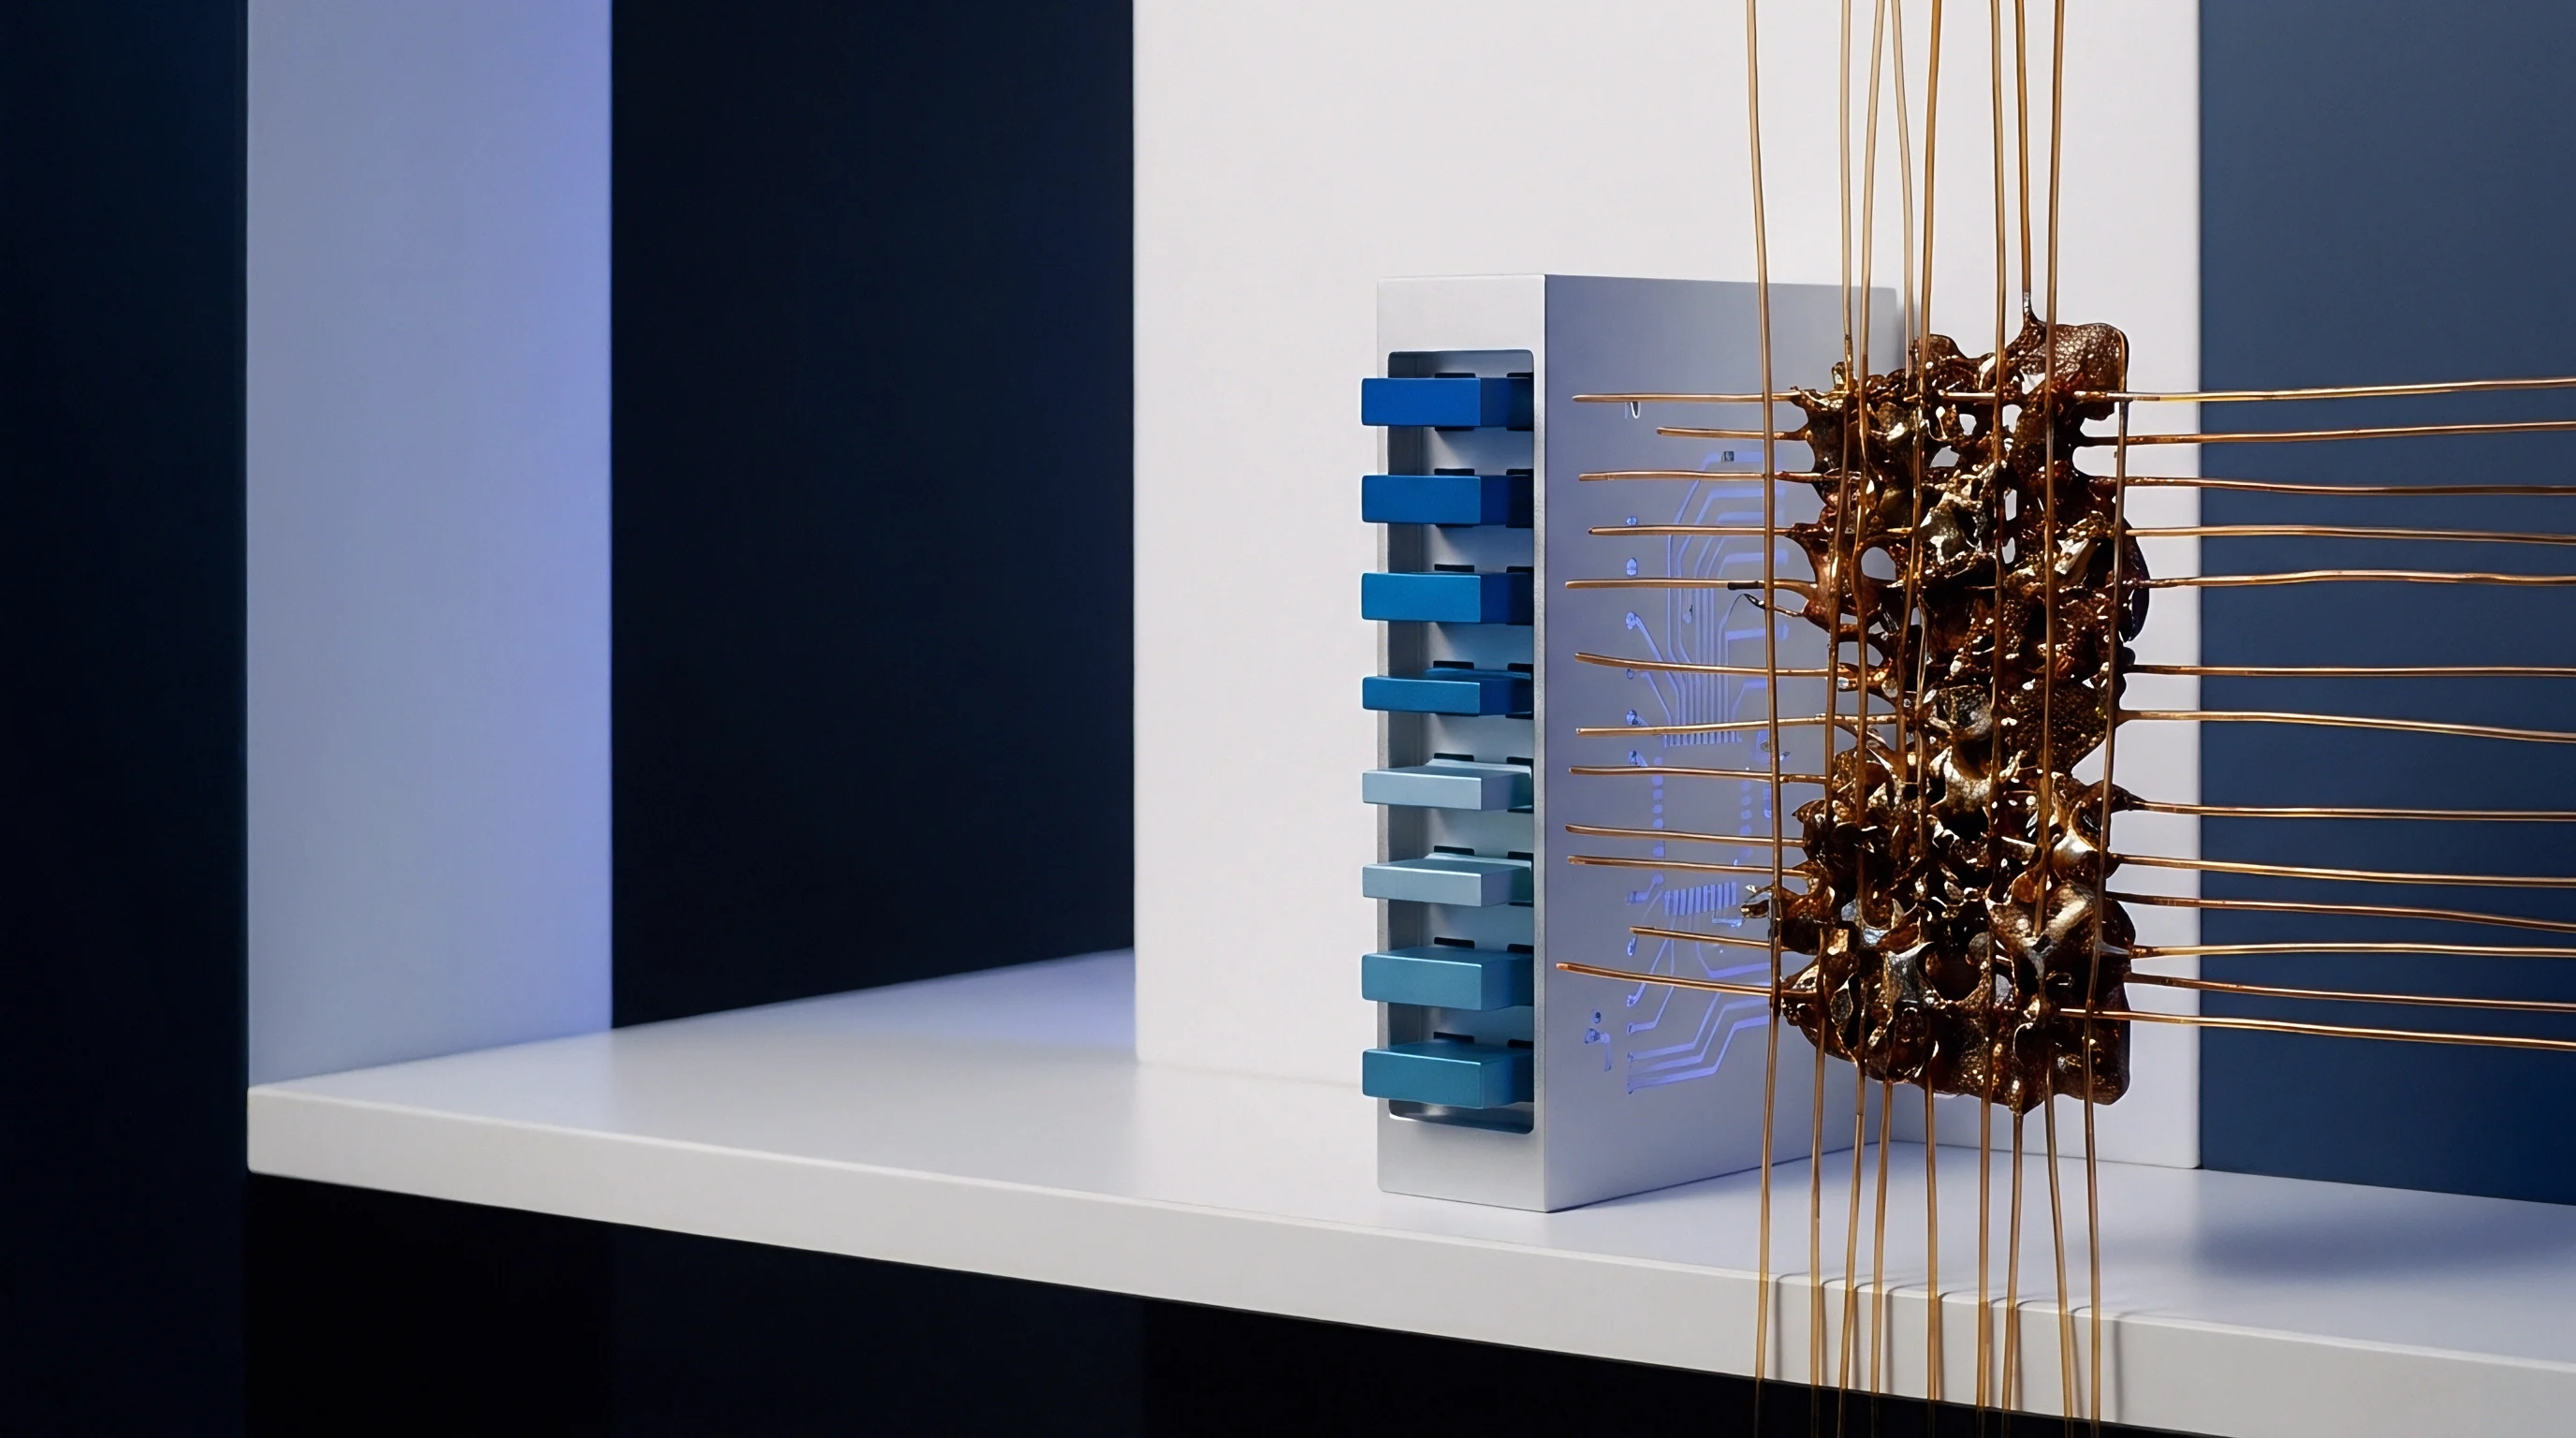
Magnetic field imaging isolates internal current distribution non-uniformities within buried substrate layers up to 200 micrometers deep. Spatial resolution degrades as standoff distance between sensor head and buried conductor increases. High-frequency AC magnetic field imaging improves spatial resolution down to 3 micrometers, enabling line-by-line reconstruction of individual power planes in 2.5D silicon interposers.
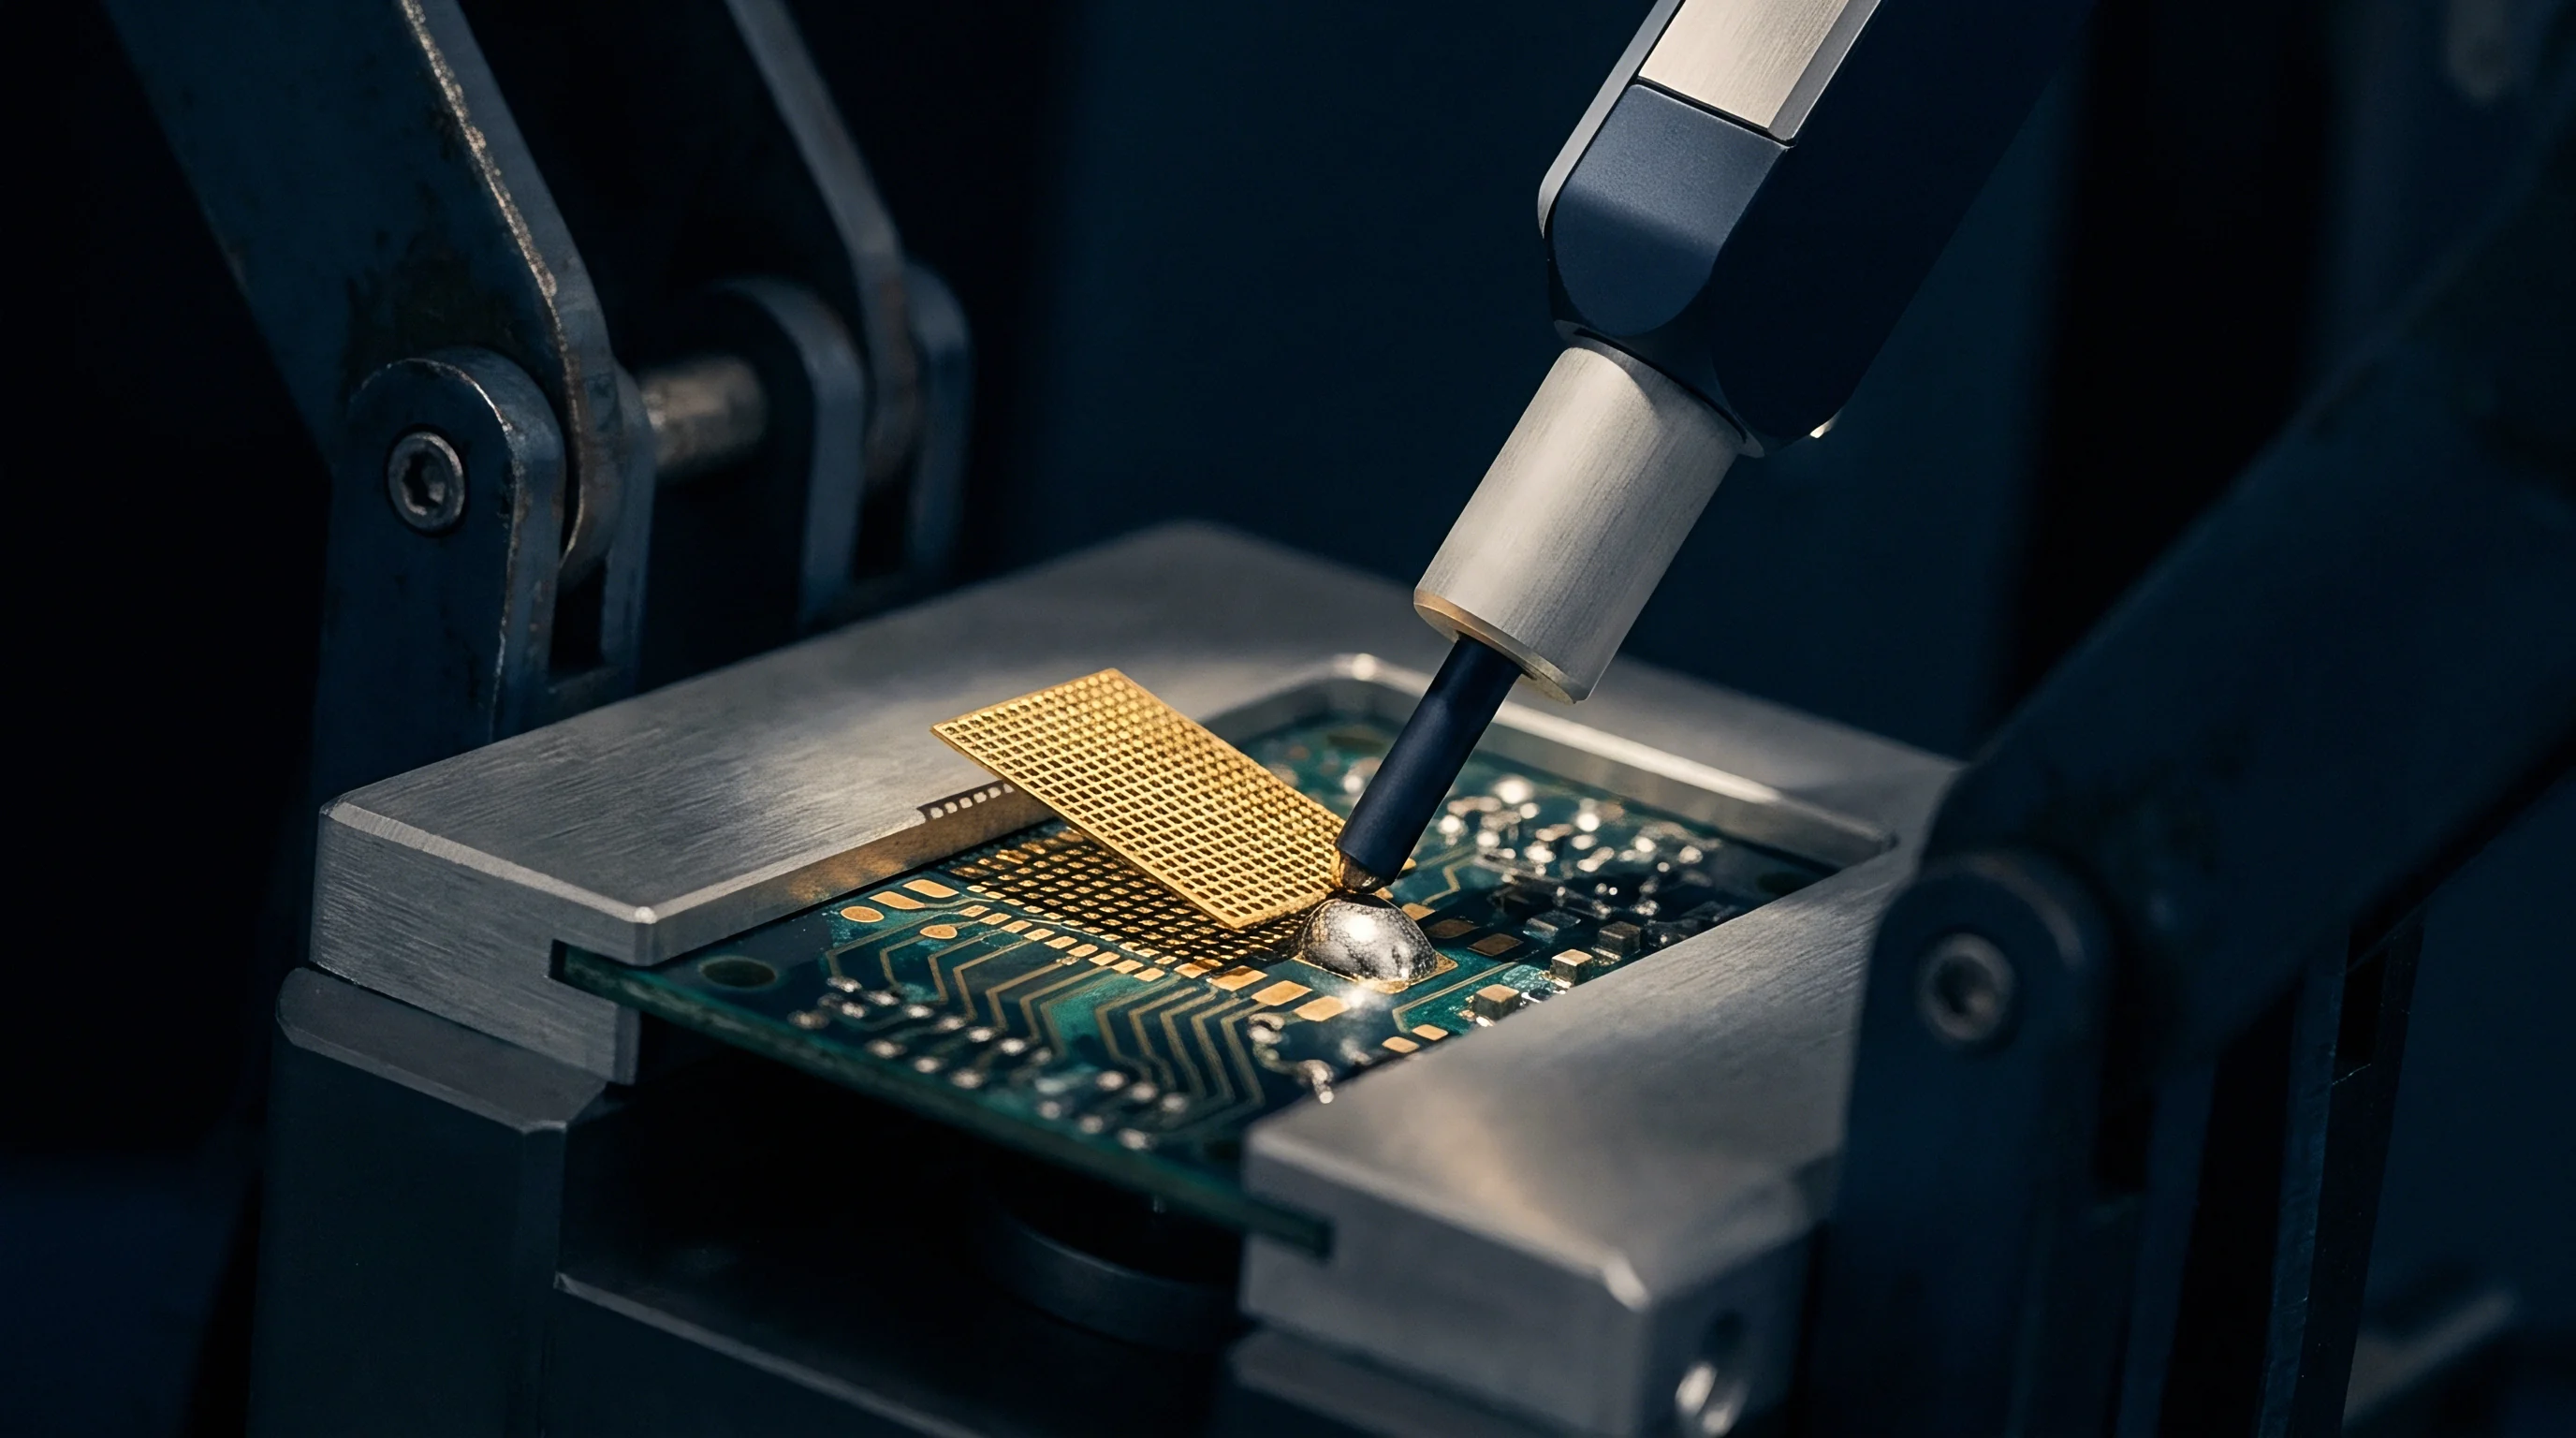
Differential AC Four-Point Kelvin Arrays utilize fine-pitch spring-loaded probe pins arranged in precise contact topologies. Applying low-frequency AC currents through outer probe pairs while measuring differential voltage across inner probe pairs eliminates contact resistance interference. Lock-in amplifiers extract real and imaginary impedance components, providing sub-milliohm resistance measurements across individual microbump pads.
Combining high-precision voltage sensing with automated contact positioning enables rapid screening of substrate panels prior to chiplet assembly. Coupling thermal, magnetic, and electrical mapping profiles yields a dynamic model of substrate current distribution under varied load conditions.
Whether automated magnetic field mapping can scale to match panel-level high-volume manufacturing throughput without compromising sub-milliohm signal resolution remains unresolved within production test environments.
Gradient
Quantifying current density distribution across multi-chiplet power planes requires finite element modeling paired with high-density parasitic extraction. Mapping potential field gradients exposes localized high-resistance regions that disrupt current flow uniformity. FEA calculations convert measured voltage drops into precise three-dimensional current density vectors across complex conductor geometry.
FE-PDN Extraction and Guard Banding
Finite element power delivery network extraction discretizes sub-micron interposer structures into three-dimensional resistive, inductive, and capacitive mesh networks. Calculating current density gradients involves solving Laplace equations for electrical potential across millions of nodal points under simulated transient load spikes. Guard-banding thresholds set maximum allowable localized current density boundaries based on microbump metallic composition and long-term operating thermal targets.
Deviations in potential field gradients signal localized geometry changes or material degradation. Calculating the gradient magnitude across adjacent nodes highlights structural irregularities that traditional continuity tests overlook entirely.
Interconnects carrying asymmetrical current densities fail prematurely along thermal gradients rather than absolute voltage drops.

Worked Calculation of Resistance Deviation
Assumptions for a representative multi-chiplet power plane calculation: an array of 4,000 copper pillars operates in parallel to supply 80 amperes DC; nominal pillar resistance equals 1.20 milliohm per pillar, yielding a combined nominal array resistance of 0.30 micro-ohms. A structural defect affects a cluster of 200 adjacent pillars, increasing their individual resistance by 0.35 milliohms due to micro-voiding.
- Calculate nominal parallel array conductance: 3,800 pillars at 1.20 milliohms yield 3,166.67 Siemens; 200 defective pillars at 1.55 milliohms yield 129.03 Siemens.
- Sum combined array conductance to derive total network conductance: 3,166.67 + 129.03 = 3,295.70 Siemens.
- Invert total conductance to yield modified total array resistance: 0.3034 micro-ohms, representing an overall array resistance shift of only 3.4 nano-ohms.
- Determine nominal pillar current: total voltage drop equals 80 amperes divided by 3,295.70 Siemens, yielding 24.27 millivolts across the array.
- Calculate current through nominal pillars: 24.27 millivolts divided by 1.20 milliohms equals 20.23 milliamperes per pillar.
- Calculate current through defective pillars: 24.27 millivolts divided by 1.55 milliohms equals 15.66 milliamperes per pillar.
- Calculate redistributed current shifted into neighboring nominal pillars: 914 milliamperes total current shifts into healthy pillars, raising localized current density by 2.2 percent across adjacent cluster borders.
This calculation shows how an overall array resistance shift of merely 3.4 nano-ohms causes significant internal current redistribution, driving localized failure without triggering gross panel-level resistance limits.
| Metrology Method | Resistance Sensitivity | Spatial Resolution | Measurement Cycle Time |
|---|---|---|---|
| Lock-in Thermography | 0.05 milliohm | 5 micrometers | 45 to 120 seconds per die area |
| Scanning SQUID Microscopy | 0.01 milliohm | 1.5 micrometers | 180 to 600 seconds per die area |
| AC Four-Point Probe Array | 0.10 milliohm | 15 micrometers | 0.5 to 2 seconds per contact site |
| Pulse-Transient IR Sensing | 0.20 milliohm | 12 micrometers | 1.5 to 5 seconds per site |
Current flow always tracks the path of least electrical resistance regardless of designer intentions or trace routing symmetrical layouts.


Tolerance
Production screening must catch subtle sub-milliohm anomalies before substrates reach high-value chiplet integration lines. Standard open-short testing fails to catch current crowding risks because damaged or voided interconnects preserve electrical continuity under zero-load conditions. Establishing rigorous stress screening protocols filters out marginal substrates while protecting long-term component reliability.

Accelerated Stress Screening Protocols
High-Temperature Operating Life screening exposes populated or bare substrates to elevated thermal conditions alongside continuous current bias. Thermal cycling under JESD22-A104 standard conditions accelerates fatigue in microbump joints, expanding sub-surface micro-cracks and driving measurable resistance shifts along compromised paths.
Power cycling protocols apply cyclic high-current pulses to simulate transient operational workloads. The resulting rapid thermal expansion induces cyclical mechanical stress on interposer power planes, turning dormant micro-voids into high-resistance anomalies measurable during subsequent low-level signal testing.
Infrared thermography misses sub-surface current shunts buried beneath active silicon layers.

Acceptance Thresholds and Screening Limits
Establishing effective screening limits requires balancing fault coverage against yield loss from false rejections. Screening limits defined strictly around total DC resistance miss localized internal anomalies. Defining acceptable drift thresholds based on differential delta resistance across symmetric probe pairs provides far better defect detection.
- Differential Resistance Variation across symmetrical power pins must not exceed 0.15 milliohms under nominal test probe contact pressure.
- Thermal Dissipation Gradient Shift monitored during pulsed DC excitation must remain under 0.8 degrees Celsius per watt across adjacent power quad zones.
- Post-Thermal Cycling Drift in total power network impedance must not exceed 2 percent after 500 cycles between minus 40 and plus 125 degrees Celsius.
- Transient Voltage Drop Delta during 10 ampere per microsecond current step excitation must stay within 5 millivolts of baseline simulation models.
According to IPC-9252 Section 5.3.2, bare board electrical testing for Class 3 high-reliability applications requires continuity verification at current levels sufficient to stress fine-pitch interconnect structures, rejecting any component exhibiting localized resistance variations greater than 10 percent from designed nominal values.

Filing
Demonstrating product quality and compliance across cross-border multi-chiplet supply chains requires rigorous documentation attached to every production batch. Test reports and technical dossiers serve as legal proof of delivery, verifying that shipped substrates meet sub-milliohm current distribution specifications. Inadequate compliance records expose buyers to substantial financial liability, field recall expenses, and customs import blockages.

Technical Dossier Requirements
A complete technical dossier bridges manufacturing quality control records with end-market compliance requirements. Substrate lots destined for high-reliability computing markets require full metrology trace logs, thermal imaging raw data, and statistical process control charts tracking resistance distribution across every panel.
Regulatory frameworks such as EU RoHS and REACH mandate precise material composition declarations for every homogeneous layer within substrate packaging. Because electroplating baths and microbump solders utilize specialized alloys to optimize mechanical and electrical characteristics, documentation must confirm restricted substance limits alongside electrical performance parameters.
| Metric / Parameter | Standard Screening Only | Enhanced Metrology Screening | Commercial Impact |
|---|---|---|---|
| Substrate Bare Board Test Yield | 98.5% | 94.2% | Immediate yield drop of 4.3% |
| Sub-Milliohm Escape Rate | 1.8% of shipped lots | 0.03% of shipped lots | 60-fold reduction in field defects |
| Packaging Scrap Cost Per Defect | $12,500 per assembly | $12,500 per assembly | Saved integrated chiplet scrap |
| Warranty Reserve Allocation | 4.5% of total revenue | 0.8% of total revenue | 3.7% direct margin recovery |
Substrate batch release criteria require signing off on both electrical continuity metrics and current density uniformity models. When a returned batch exhibits field failures linked to current crowding, customer warranty claims depend entirely on technical file audit trails proving whether defect thresholds were breached during factory release testing. Quantifying sub-milliohm impedance stability across panel arrays establishes the objective evidence necessary to secure insurance coverage, satisfy importer safety directives, and protect gross commercial margins across high-density packaging launches.