Quantifying Electrical Escape Rates across Heterogeneous Substrate Interconnect Assemblies
Quantifying electrical escape rates across heterogeneous interconnects demands stage-by-stage access modeling to prevent latent micro-opens reaching the field.


Joint
Silicon interposers and organic multi-chip modules concentrate thermo-mechanical strain at micro-scale electrical interfaces. In heterogeneous assemblies, physical interconnect density increases while contact pad dimensions shrink below 40 micrometers. This spatial compression elevates the structural vulnerability of micro-bumps, redistribution layer vias, and hybrid copper bonds.
Interconnect failures in these assemblies originate primarily from thermal expansion mismatch, intermetallic growth, and localized mechanical stress during reflow and operational thermal cycling.

Interconnect Failure Modes in Micro-Scale Substrates
Heterogeneous integration relies on physical bridges carrying currents through geometries measured in single-digit micrometers. Silicon CTE measures 2.6 ppm per Kelvin. Organic substrate CTE reaches 15 ppm Kelvin.
This mismatch generates severe shear stress across peripheral micro-bumps during thermal excursions. Micro-bump pitch collapses to 40 micrometers. At this dimension, solder volume per connection drops below 100 cubic micrometers, making the joint susceptible to complete voiding from minor processing variations.
High resistance opens evade simple digital vectors. Partial voiding leaves a narrow metallic neck intact, permitting room-temperature low-frequency continuity tests to pass while failing under dynamic operational loads or thermal strain.
- Micro-Bump Voiding incomplete wetting during reflow leaves trapped flux or vacuum pockets that restrict conductive cross-section without causing complete open circuits at ambient bench temperature.
- Redistribution Layer Micro-Cracks thermal cycling propagates fatigue fractures across sub-10 micrometer copper traces adjacent to micro-via bases under repeated thermal expansion differential.
- Intermetallic Phase Shifts excessive thermal exposure transforms ductile copper-tin bonds into brittle crystalline structures susceptible to micro-fracture under structural shock.
- Dielectric Sub-Surface Leakage moisture absorption combined with high bias voltages drives copper filament migration across narrow spacing gaps within multi-layer organic substrates.
High ambient temperature measurements frequently obscure micro-void defects by thermal expansion of metal interfaces.
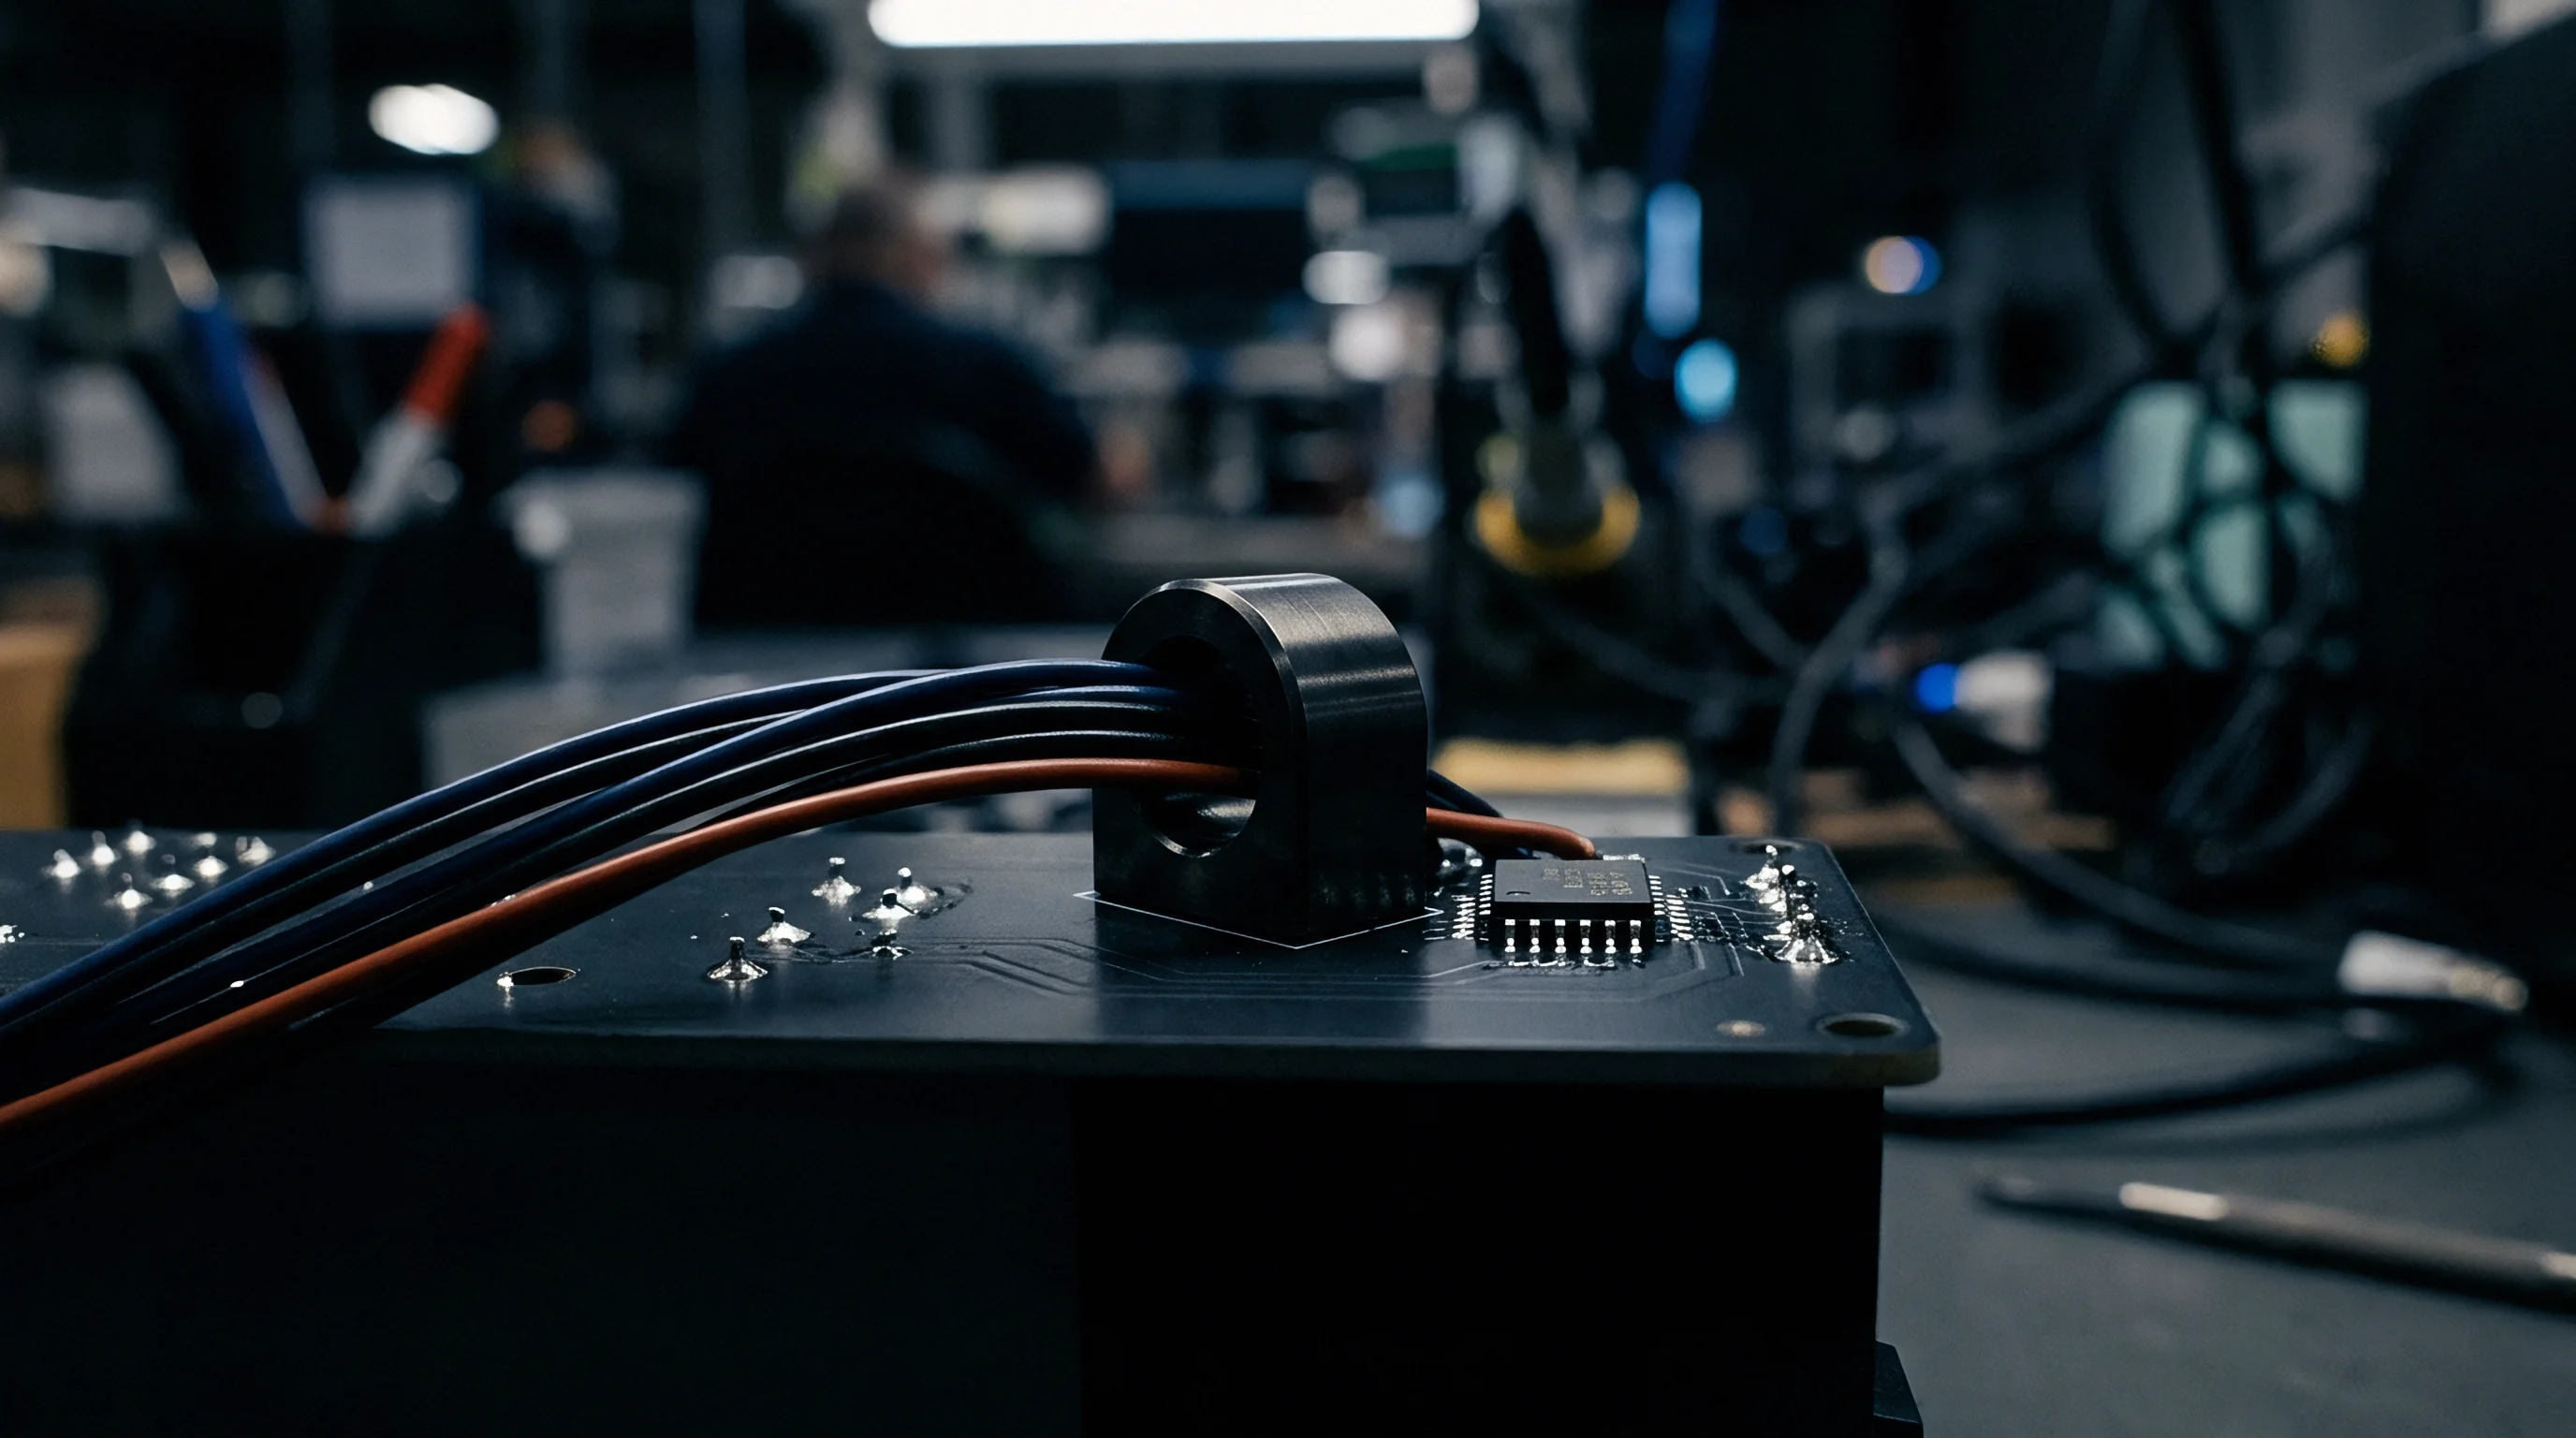
Thermo-Mechanical Strain and Interface Degradation
Thermal expansion mismatches between monocrystalline silicon and glass-reinforced organic substrates generate shear stresses across peripheral contacts. The localized stress field peaks at the outermost die corners, driving creep deformation in solder joints. Over operational life, this deformation initiates micro-void aggregation along the intermetallic compound interface.
As micro-voids coalesce into planar cracks, the cross-sectional area of the conductive path drops, creating localized current crowding. Current crowding accelerates electromigration, transforming a minor structural anomaly into a catastrophic open circuit. Micro-bump pitch collapse increases susceptibility to bridge shorts driven by lateral solder squeezing during die placement.
Substrate suppliers routinely assert that room-temperature continuity passes demonstrate structural integrity, attributing field failures entirely to downstream assembly reflow profiles.


Reach
Test coverage across complex multi-die packages depends on the physical and digital access paths built into the substrate layout. Advanced packaging architectures enclose thousands of die-to-die nets inside encapsulated substrate layers, rendering conventional bed-of-nails and flying probe access mechanically unfeasible. Quantifying electrical escape rates demands establishing explicit physical and functional access metrics for every net across the substrate topology.

Electrical Access Constraints on Fine-Pitch Substrates
Physical probing mechanisms hit hard mechanically imposed limits when pad pitches collapse below 50 micrometers. Flying probe needles exert mechanical forces that damage fragile low-k dielectric layers beneath micro-bump pads. Probing accuracy drops significantly on un-bumped pad arrays due to mechanical drift and probe tip wear.
Capacitive probing damages fragile micro-bump pads.
Optical systems cannot inspect covered hybrid bonds. Automated optical inspection verifies outer surface features but fails to evaluate internal substrate layer connections or buried micro-vias. Test access must shift from physical contact to embedded digital architecture.
| Test Regime | Physical Access Limit | Target Defect Class | Escape Rate Exposure |
|---|---|---|---|
| Flying Probe Capacitance | 50 µm pad pitch | Gross open, net-to-net short | High-resistance opens, soft bridges |
| IEEE 1149.10 Serial Scan | Zero physical access required | Digital logic net continuity | Analog parametric drift, power rail impedance |
| Built-In Self-Test (BIST) Core | Internal die logic access | At-speed functional timing faults | Inter-die cross-talk, substrate leakage |
| Active High-Speed RF Probe | 100 µm dedicated test point | Impedance mismatch, signal attenuation | DC static micro-opens under thermal strain |

Boundary Scan Integration for Buried Interfaces
High-speed serial scan architectures eliminate physical contact probes by routing test vectors through internal register chains. IEEE 1149.10 expands test bandwidth across high-density interconnects by replacing parallel boundary scan chains with high-speed serial standards. Incorporating boundary scan registers into every chiplet allows structural net verification across interposer channels without dedicated test pads.
Boundary scan registers eliminate physical pin access. Coverage gaps persist on non-scan nets, including power distribution networks, analog sensory interfaces, and high-speed differential pairs where boundary scan cells introduce unacceptable capacitive loading.
- Nodal Density Evaluation verification of physical test pad availability against layout density rules determines whether flying probe needles can make unassisted contact.
- Boundary Register Allocation inclusion of IEEE 1149.10 high-speed serial test structures within die netlists enables structural testing of buried interposer connections.
- Threshold Resistance Calibration setting parametric continuity limits below 5 ohms prevents high-resistance micro-opens from passing standard continuity checks.
- Optical Isolation Cross-Check automated X-ray inspection supplements electrical vectors by confirming solder volume on blind micro-bumps.
IPC-9252 Class 3 testing mandates 100 percent continuity and isolation verification with parametric threshold limits locked into the customer procurement file.
Standard IPC-9252 Class 3 purchase terms shift financial liability for non-detected latent micro-opens back to the substrate fabricator when netlist parametric thresholds are explicitly documented in the engineering contract.


Arithmetic
Escape rate quantification requires modeling defect generation probabilities against stage-by-stage detection efficiencies. Achieving an accurate escape calculation depends on identifying the precise baseline fault universe of the target substrate manufacturing process. Standard yield metrics fail to capture escape potential because they aggregate total pass rates without categorizing un-tested fault classes.

Quantitative Escape Rate Calculation for Heterogeneous Substrates
Evaluating defect flow through sequential test screens relies on exact fault population accounting at every assembly step. Consider a high-density heterogeneous substrate lot comprising 10,000 completed multi-chip assemblies. Each assembly integrates 50,000 micro-scale interconnect nodes across a combination of silicon interposers and organic package layers.
Historical yield data establishes an inherent defect generation density (D0) of 2 parts per million (PPM) per interconnect node across the fabrication process.
The baseline defect population (Ndefects) per assembly is derived from total node count (Nnodes) and defect density:
Ndefects = Nnodes × D0 = 50,000 × (2 × 10-6) = 0.1 defects per assembly
Across the entire 10,000 unit batch, the incoming defect universe totals 1,000 defective interconnect points distributed across approximately 950 defective assemblies, assuming Poisson distribution of faults. The substrate batch undergoes a three-stage test process:
Stage 1 comprises Flying Probe Continuity Testing. The physical access limitation permits probing of only 85 percent of all nets (A1 = 0.85). Within accessible nets, probe parametric threshold setting catches gross opens and hard shorts with 95 percent efficiency (E1 = 0.95), but misses high-resistance micro-opens (R > 10 Ω).
Fault coverage for Stage 1 (C1) is calculated as access multiplied by efficiency:
C1 = A1 × E1 = 0.85 × 0.95 = 0.8075 (80.75%)
Stage 1 removes 807 defective units, leaving a residual defect pool of 193 defective nodes entering Stage 2.
Stage 2 applies IEEE 1149.10 Boundary Scan across all internal digital chiplet nets. Boundary scan accesses 90 percent of the remaining un-tested digital nets (A2 = 0.90) with structural test efficiency of 98 percent (E2 = 0.98). Coverage for Stage 2 (C2) on the remaining fault population equals:
C2 = A2 × E2 = 0.90 × 0.98 = 0.882 (88.2%)
Stage 2 detects and rejects an additional 170 defective units (193 × 0.882). The residual defect pool entering Stage 3 drops to 23 defective interconnect nodes.
Stage 3 applies Functional At-Speed Testing at final assembly package test. Functional testing reaches remaining un-tested nets through system-level emulation (A3 = 0.70) but exhibits lower structural detection efficiency (E3 = 0.60) for latent, dynamic high-resistance micro-opens. Functional test coverage (C3) equals:
C3 = A3 × E3 = 0.70 × 0.60 = 0.42 (42%)
Stage 3 detects 10 defective units (23 × 0.42). The final un-caught residual defect pool totals 13 units.
Cumulative test coverage (Ctotal) across all three sequential stages is calculated by multiplying survival probabilities across stages:
Ctotal = 1 –
Ctotal = 1 – = 1 – = 0.9868 (98.68%)
- Determine the baseline defect density per interconnect feature from substrate lot yield data.
- Multiply the feature count per assembly by the defect density to find the incoming defective unit population.
- Calculate Stage 1 defect detection yields using physical probe coverage metrics.
- Subtract detected defects from the population to establish the residual defect pool entering Stage 2.
- Apply boundary scan fault coverage percentages to the residual defect pool.
- Model Stage 3 functional testing detection probability against dynamic high-resistance defects.
- Sum the residual undetected defects across all stages to establish the final escape rate in parts per million.
A multi-stage test line achieving 98 percent cumulative coverage leaves 200 defective parts per million undetected in a substrate population with a 1 percent initial defect rate.
The final electrical escape rate (Erate) in defective parts per million (DPM) shipped to the customer is derived from un-caught defects divided by total lot size:
Erate = left( frac1310,000 right) × 1,000,000 = 1,300 DPM
The resulting field exposure of thirteen escaped defective units out of a 10,000-unit release represents the lower bound of customer-side failure risk under nominal operating stress.

Stress
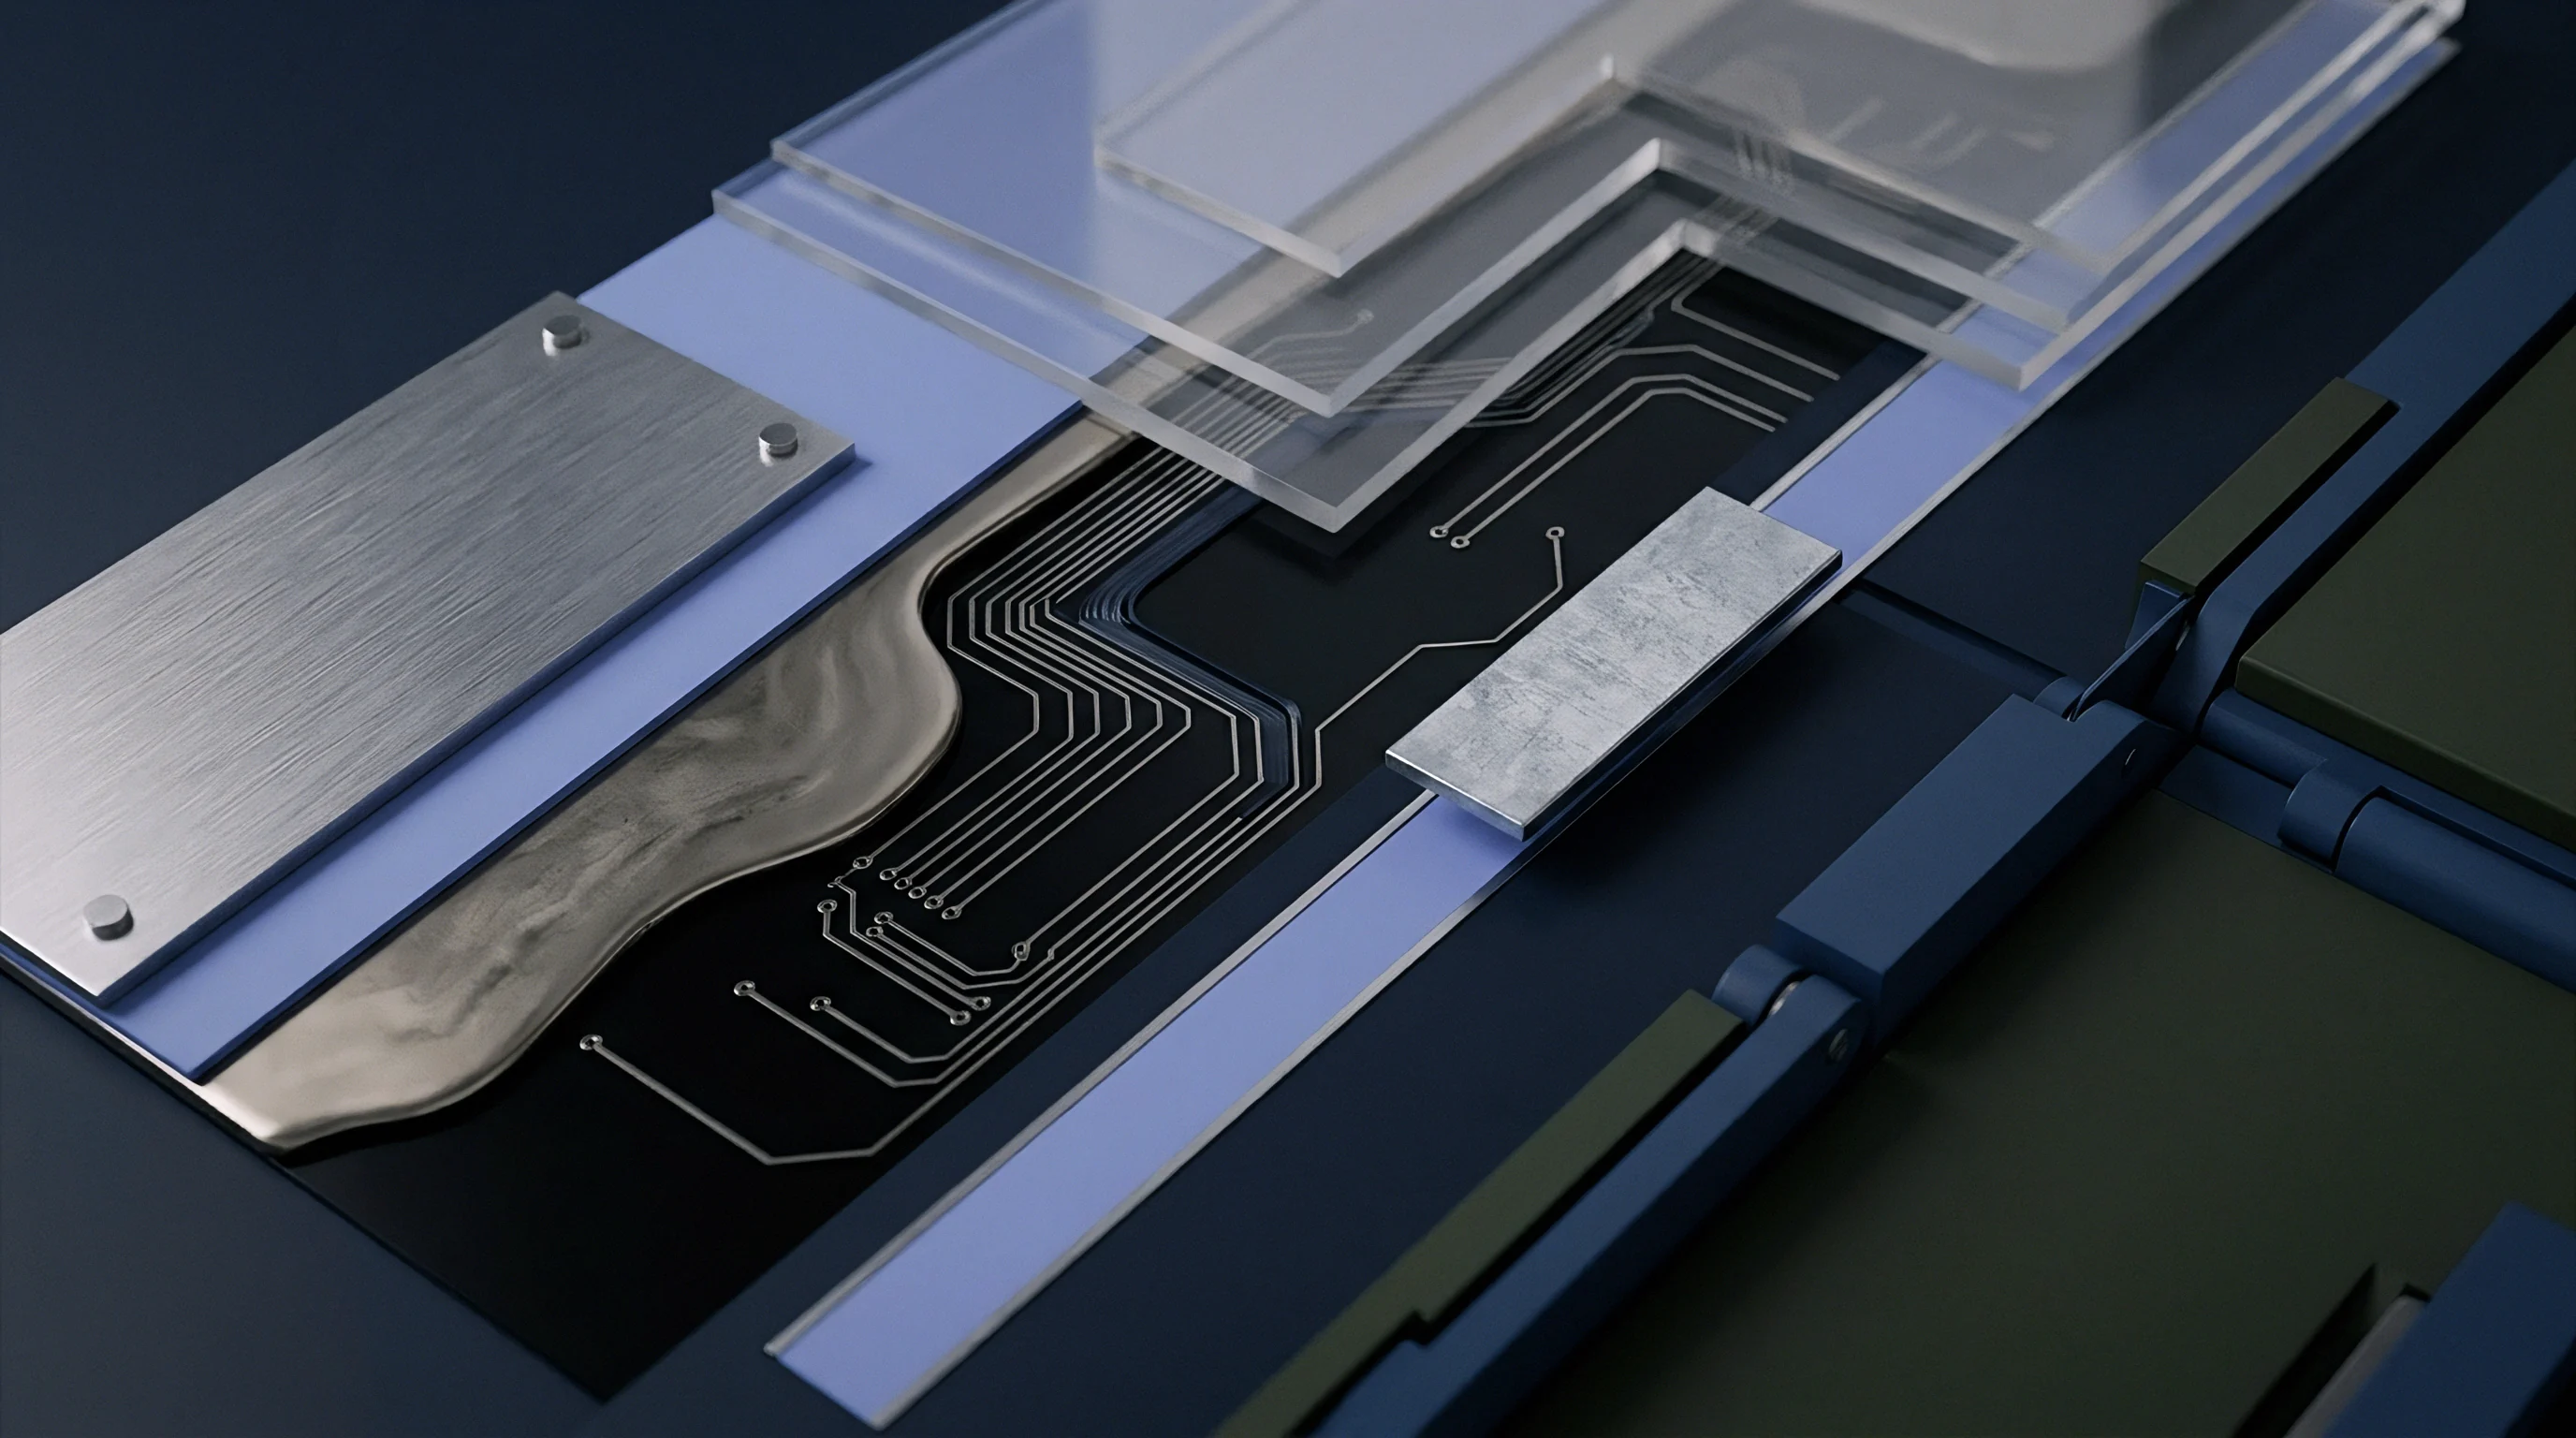
Environmental acceleration forces latent physical interconnect flaws to cross measurable electrical detection thresholds. Infant mortality defects, including micro-voids, micro-cracks, and localized intermetallic brittleness, remain electrically silent under static bench continuity testing. Accelerated stress screening exposes assemblies to controlled thermal, mechanical, and climatic loads to precipitate structural degradation into clear electrical opens or shorts prior to batch release.

Which Stress Profiles Accelerate Interconnect Creep Safely?
Temperature cycling profiles for organic interposers require balance between thermo-mechanical strain loading and thermal destruction of polymer dielectrics. High ramp rate thermal cycling introduces acute shear stresses at micro-bump boundaries. JESD22-A104 Condition G specifies thermal cycling between -40 degrees Celsius and +125 degrees Celsius with ramp rates exceeding 15 degrees Celsius per minute.
Latent voids expand during thermal cycling screens. Screen acceleration factors obey Arrhenius relations. Activation energies for intermetallic copper-tin diffusion (Ea = 0.9 eV) dictate that elevated temperature dwell times accelerate structural conversion, while lower temperature extremes maximize mechanical shear stress across substrate interfaces.
| Stress Test Method | Standard Reference | Target Failure Mechanism | Activation Energy (eV) | Screen Yield Fallout |
|---|---|---|---|---|
| Highly Accelerated Stress (HAST) | JESD22-A110 | Dielectric moisture leakage, dendrite growth | 1.1 eV | 0.12% per 96 hours |
| Thermal Shock Cycling (Condition G) | JESD22-A104 | Micro-bump shear fatigue, RDL micro-cracking | 0.85 eV | 0.45% per 500 cycles |
| High Temperature Operating Life (HTOL) | JESD22-A108 | Electromigration, intermetallic phase shift | 0.90 eV | 0.08% per 168 hours |
| Dynamic Temperature Vibration | IEC 60068-2-53 | Joint crack propagation, delamination | 0.75 eV | 0.22% per 24 hours |
| Methods Note: Activation energy values reflect empirical failure mode acceleration across organic flip-chip substrates per JESD47 qualification frameworks. | ||||

Screen Optimization and Consumption of Product Remaining Life
Over-screening assemblies consumes usable thermal-fatigue margins prior to field deployment. Screen engineering requires establishing stress durations that capture the infant mortality population without driving healthy interconnect joints into fatigue wear-out. Thermal dwell times consume active device life.
Applying Coffin-Manson strain-fatigue relationships allows engineers to calculate the precise percentage of life consumed during screening. Screening profiles that exceed 10 percent of total lifetime fatigue capacity degrade field reliability performance, increasing field return rates under operational thermal cycling.
- Baseline Strain Mapping installing strain gauges across substrate corners during early thermal cycling prevents structural overload of delicate silicon-to-package interfaces.
- Activation Energy Calculation identifying dominant failure mechanisms sets empirical acceleration factors for elevated temperature dwell times.
- Dwell Time Truncation stopping thermal exposure as soon as the infant mortality curve levels off preserves solder joint fatigue capacity for field operation.
- Parametric Drift Verification monitoring interconnect resistance in real time during thermal cycling catches intermittent micro-opens that re-close at room temperature.
The industry unresolved question remains whether non-destructive acoustic microscopy can replace destructive micro-sectioning to validate micro-bump creep damage following extended thermal screening.


Ledger
Financial exposure from un-caught micro-interconnect defects scales exponentially as assemblies move from factory floor to field installation. Substrate defects caught at the unpopulated wafer stage incur minimal scrap loss. Encapsulated scrap forfeits total substrate value.
Uncaught escape defects trigger severe commercial penalties. When an escaped defect survives module encapsulation, board-level integration, and final assembly testing, the resulting field failure costs include component scrap, freight, failure analysis overhead, and customer warranty compensation.

Commercial Cost Escalation of Escape Defects
Escalating scrap costs dictate that electrical screening occurs at the earliest feasible substrate manufacturing stage. A defective micro-via identified at bare interposer test represents a scrap loss equal to the unpopulated interposer cost, typically under twenty dollars. Allowing that same defect to escape into a fully populated multi-chip module containing high-value graphics, memory, and processing chiplets raises the scrap value beyond several thousand dollars per assembly.
Customer return agreements regularly stipulate full landed-cost chargebacks, compounding direct financial loss with contractual penalty fees.

Conformity Dossiers and Trade Liability
Technical filings supporting regulatory declarations pair chemical substance reports with verified structural reliability records. Market surveillance authorities evaluating compliance under regional safety and electromagnetic standards inspect technical dossiers for proof of systematic quality control. EN IEC 63000 mandates technical documentation demonstrating restricted substance compliance and manufacturing consistency.
Evidence of high electrical escape rates invalidates conformity declarations by establishing failure of operational quality assurance controls, exposing importers to sales suspensions, mandatory product recalls, and customs enforcement holds.
Catching an electrical anomaly at the unpopulated interposer stage costs a fraction of resolving the same defect after module encapsulation.
A test protocol that relies on end-of-line functional testing without dedicated substrate continuity verification guarantees that package scrap costs will exceed warranty reserves.