Vector Network Analyzer Calibration for Power Rail Impedance Testing
Calibrated two-port shunt-through VNA measurements require cable shield choke isolation and de-embedded fixture planes to resolve milliohm rail impedance accurately.
Topology
An uncalibrated transmission reading of 0.002 ohms on a 0.8-volt core rail reliably reports 0.045 ohms when ground return loop currents circulate through the coaxial shields. Reading signal transmission across a low-impedance shunt path leaves every microvolt vulnerable to raw channel cross-talk and port mismatches. Rail characterization below one ohm demands a two-port shunt-through configuration rather than single-port reflection.
Single-port reflection converts S11 reflection coefficients directly into load impedance through the standard termination formula. When the measured rail impedance drops below one ohm, the reflection coefficient approaches unity with a numerical magnitude around minus 0.999. In this regime, minor phase detector noise, directivity errors, and directional coupler drift induce massive swings in calculated rail resistance.
A two-port shunt-through connection places the rail under test in parallel between the source port and the receiver port. Signal transmission through S21 scales linearly with rail impedance at milliohm values.
Raw transmission logs without shield loop suppression turn microsecond switching transients into false board failure reports at incoming inspection.
The mathematical transformation from scattering parameters to rail impedance assumes a pristine fifty-ohm source and load environment. The equation converts transmission parameters directly:
Z_rail = 25 S21 / (1 – S21)
When the rail impedance sits below one ohm, S21 remains much smaller than unity, simplifying the transfer function to twenty-five times S21. That mathematical elegance conceals physical layout constraints. Series trace resistance, cable loss, and port return loss alter the assumed twenty-five-ohm scaling factor across wide frequency sweeps.
S-Parameter Conversion to Rail Impedance
Direct mathematical reduction of two-port scattering matrices extracts both magnitude and phase across wideband sweeps. When the port impedances deviate from fifty ohms nominal, the extracted shunt impedance drifts by an equivalent percentage. Receiver compression sets the upper measurement boundary, whereas receiver noise floor and cross-talk dictate the lowest detectable milliohm threshold.
High-side injection from Port 1 drives current across the target plane while the high-impedance receiver at Port 2 senses the resulting voltage drop.
Uncalibrated receiver non-linearities and source power levelling errors directly skew the extracted real and imaginary parts. Injecting zero decibels referenced to one milliwatt into a one-milliohm rail produces transmitted power levels near minus seventy-four decibels referenced to one milliwatt. At these microscopic signal amplitudes, small source impedance deviations shift the phase response, causing inductors to register as negative resistances.
| Measurement Regime | Impedance Range | Dominant Error Mechanism | Frequency Upper Limit | Calibration Standard |
|---|---|---|---|---|
| Single-Port S11 Reflection | 5 ohms to 1000 ohms | Directivity error and bridge phase drift | 6 GHz | Short-Open-Load |
| Two-Port Series-Through S21 | 100 ohms to 50 kiloohms | Series fixture capacitance and port shunt loss | 3 GHz | Thru-Match |
| Two-Port Shunt-Through S21 | 0.1 milliohms to 10 ohms | Cable shield braid loop currents and contact inductance | 1 GHz | Short-Open-Load-Thru with isolation |
| Active Probe Shunt-Through | 10 milliohms to 50 ohms | Probe tip ground loop and active amplifier noise | 3 GHz | Planar substrate calibration array |
Reflection Thresholds in Low Impedance Regimes
Directivity errors in directional bridges destroy single-port accuracy on low-impedance power planes. Couplers achieve forty decibels of raw directivity in exceptional designs. That finite isolation allows incident signal leakage into the reflected signal receiver, generating an apparent impedance floor around one hundred milliohms.
The two-port transmission method sidesteps bridge directivity limits by monitoring transmitted voltage directly with the tuned receiver of Port 2.
System designers encounter significant validation escapes when uncalibrated fixtures introduce spurious resonances:
- Directivity leakage vectors alter raw reflection measurements by swamping microvolt reflection signals with reflected source residuals.
- Receiver dynamic range truncation occurs when rail impedance drops below instrument noise floors, transforming phase angles into random scatter.
- Coupling capacitor parasitics inject series resonance dips below three hundred kilohertz, masking real distribution plane resistance.
- Mismatched port terminations create standing waves along semi-rigid coaxial feeds, producing periodic ripple in the calculated inductance curves.
Relying on raw two-port S-parameters without mathematical transformation and baseline calibration plane alignment corrupts the calculated impedance curves, leading procurement teams to approve power rails whose transient impedance excursions cause unexpected processor lockups during factory qualification trials.
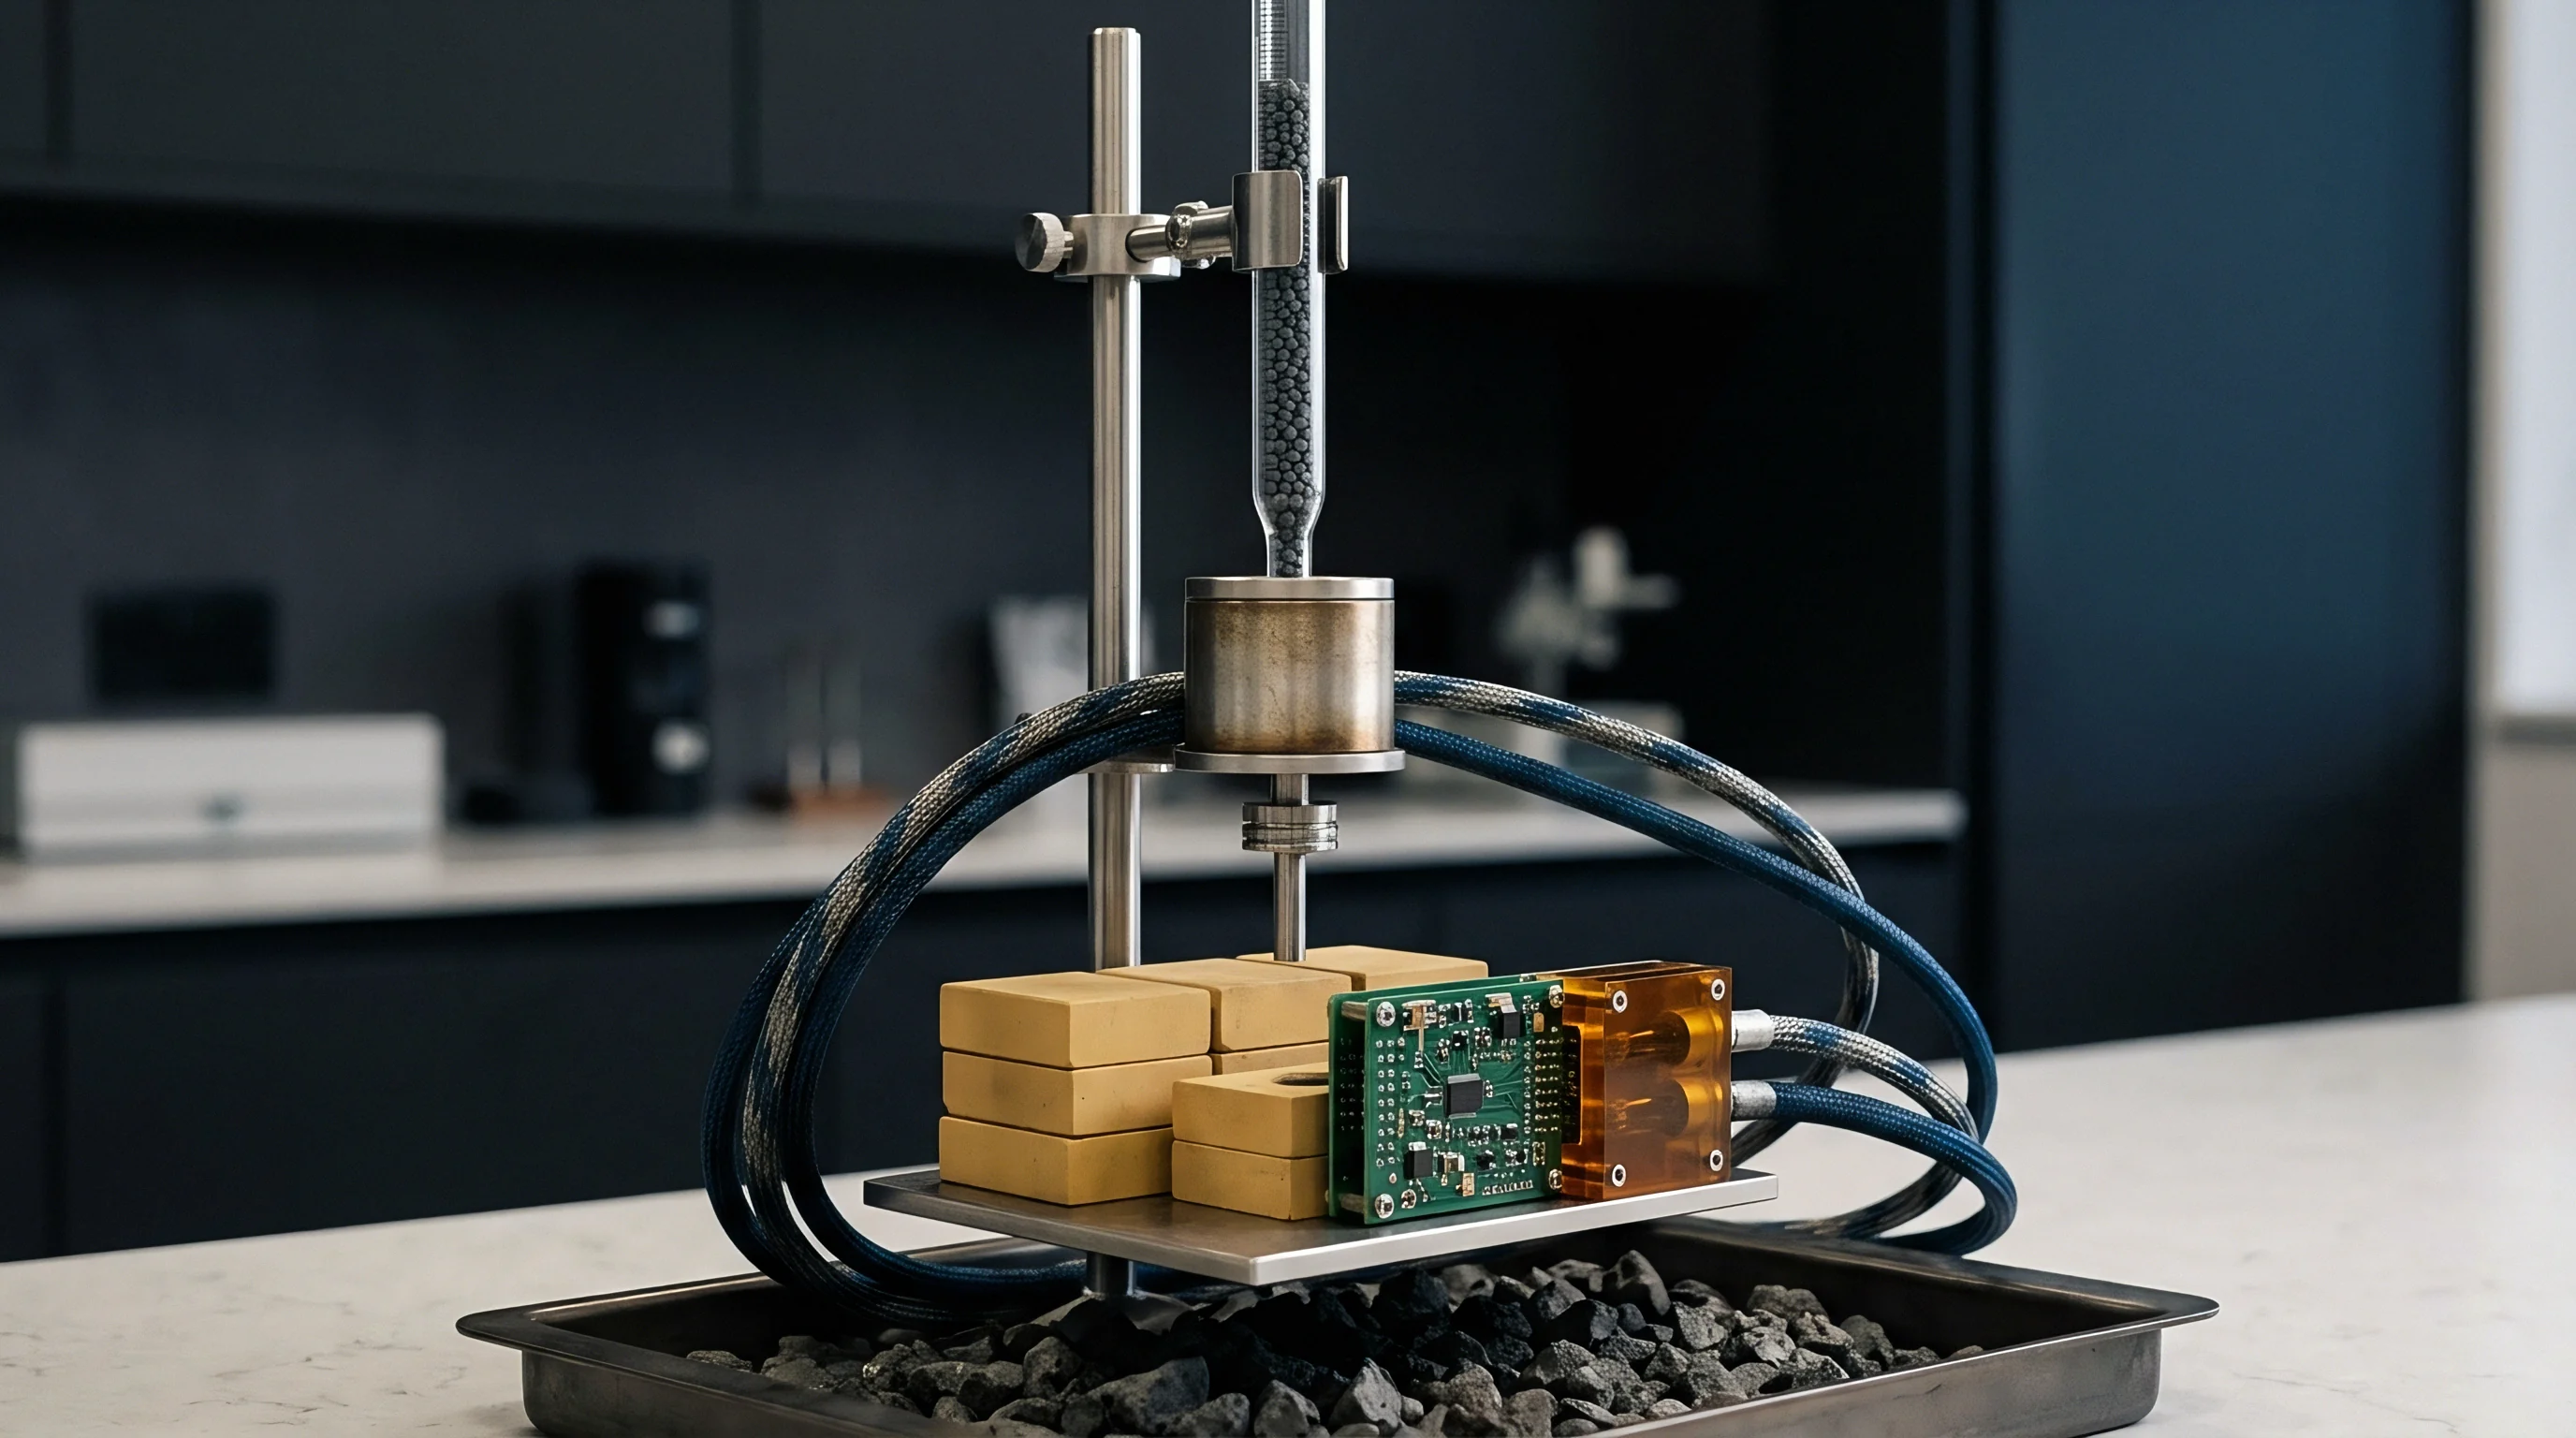
Braid
Coaxial cable shields form a complete conductive path directly connecting the chassis grounds of analyzer ports. When the analyzer injects a signal into Port 1, current divides between the central conductor and the outer shield braid. The fraction returning through the shield creates a common-mode potential across the shield resistance.
This potential couples into the Port 2 receiver as a spurious voltage drop, manifesting as an artificial resistance floor between ten and one hundred milliohms below ten megahertz.
Shield current injection represents the principal limitation of low-frequency vector analyzer rail measurements. The resistance of double-shielded RG-223 or RG-142 cable outer braids ranges between ten and twenty milliohms per meter. At frequencies below one hundred kilohertz, skin depth exceeds shield wall thickness, forcing ground return current to distribute uniformly through the braid.
The instrument measures this braid drop in series with the device rail.
Coaxial ground loop currents dominate raw transmission readings until high-permeability magnetic cores choke the common-mode return path.
Is Coaxial Shield Isolation Sufficient below Ten Kilohertz?
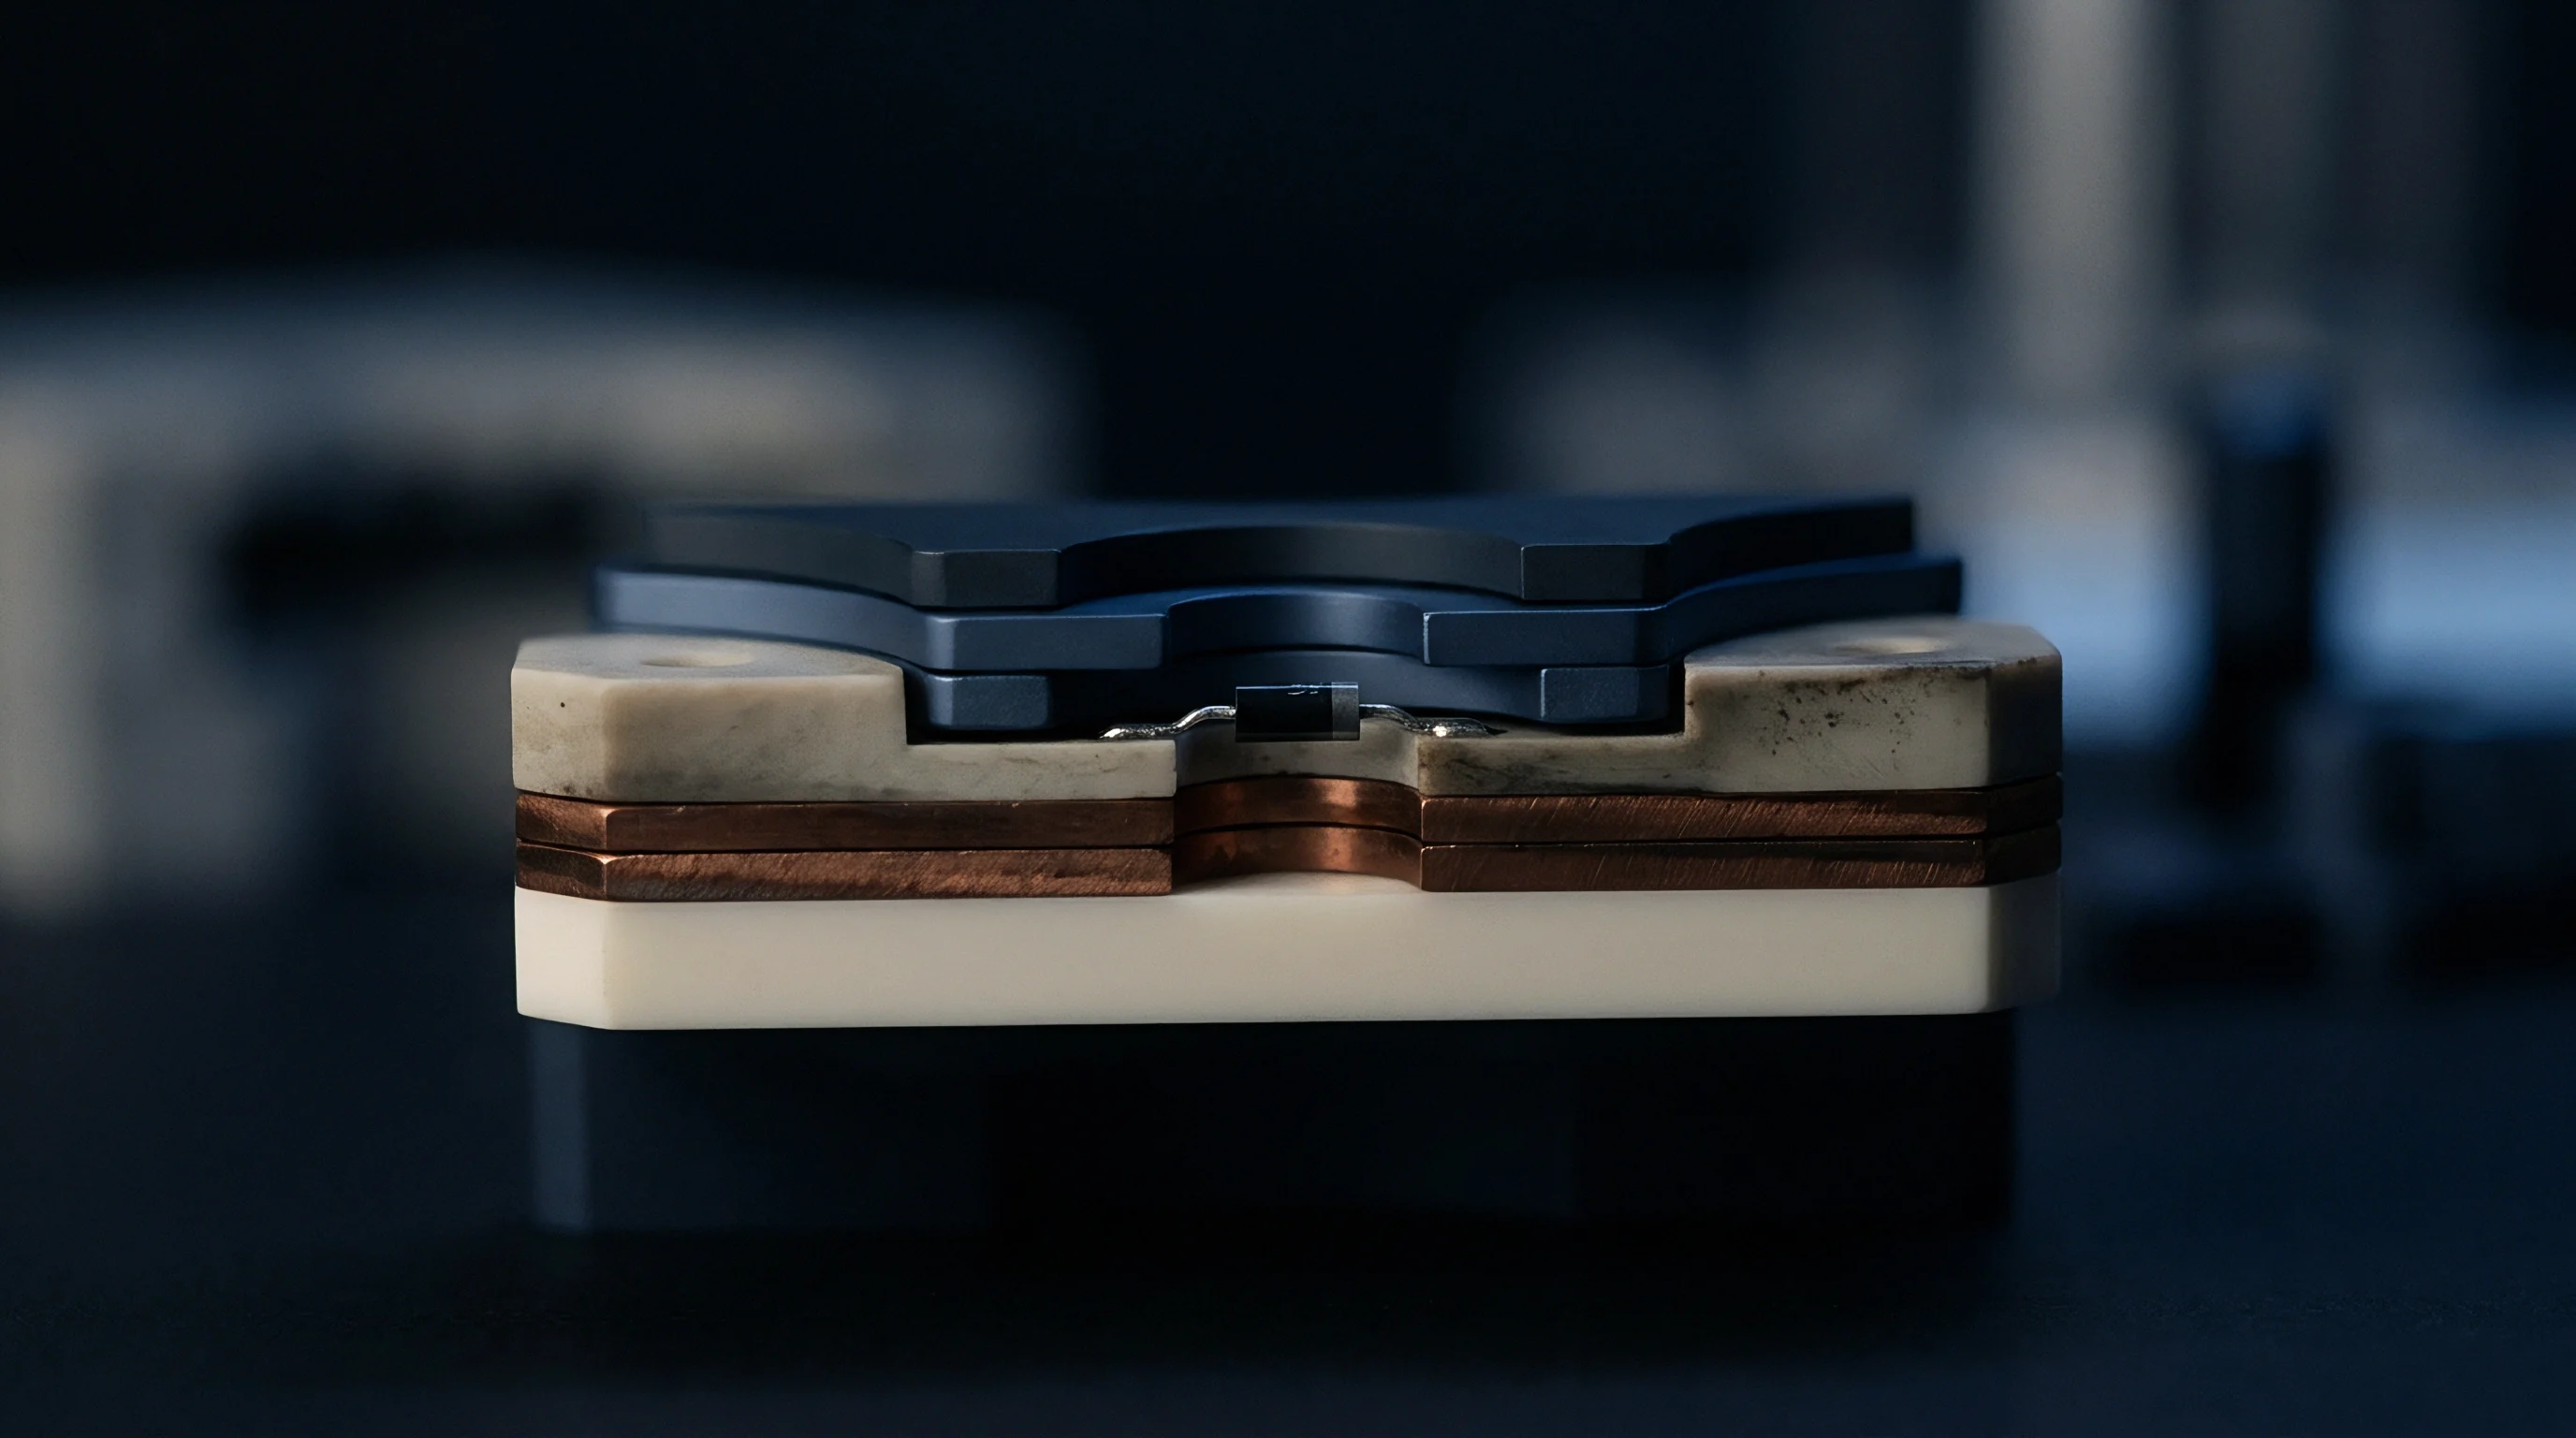
Inserting broadband coaxial isolation transformers eliminates the DC conductive loop between analyzer grounds. Isolators break the metallic shield connection while passing high-frequency RF signals through magnetic coupling. Transformers introduce insertion loss and low-frequency cutoff thresholds, degrading measurements below five kilohertz.
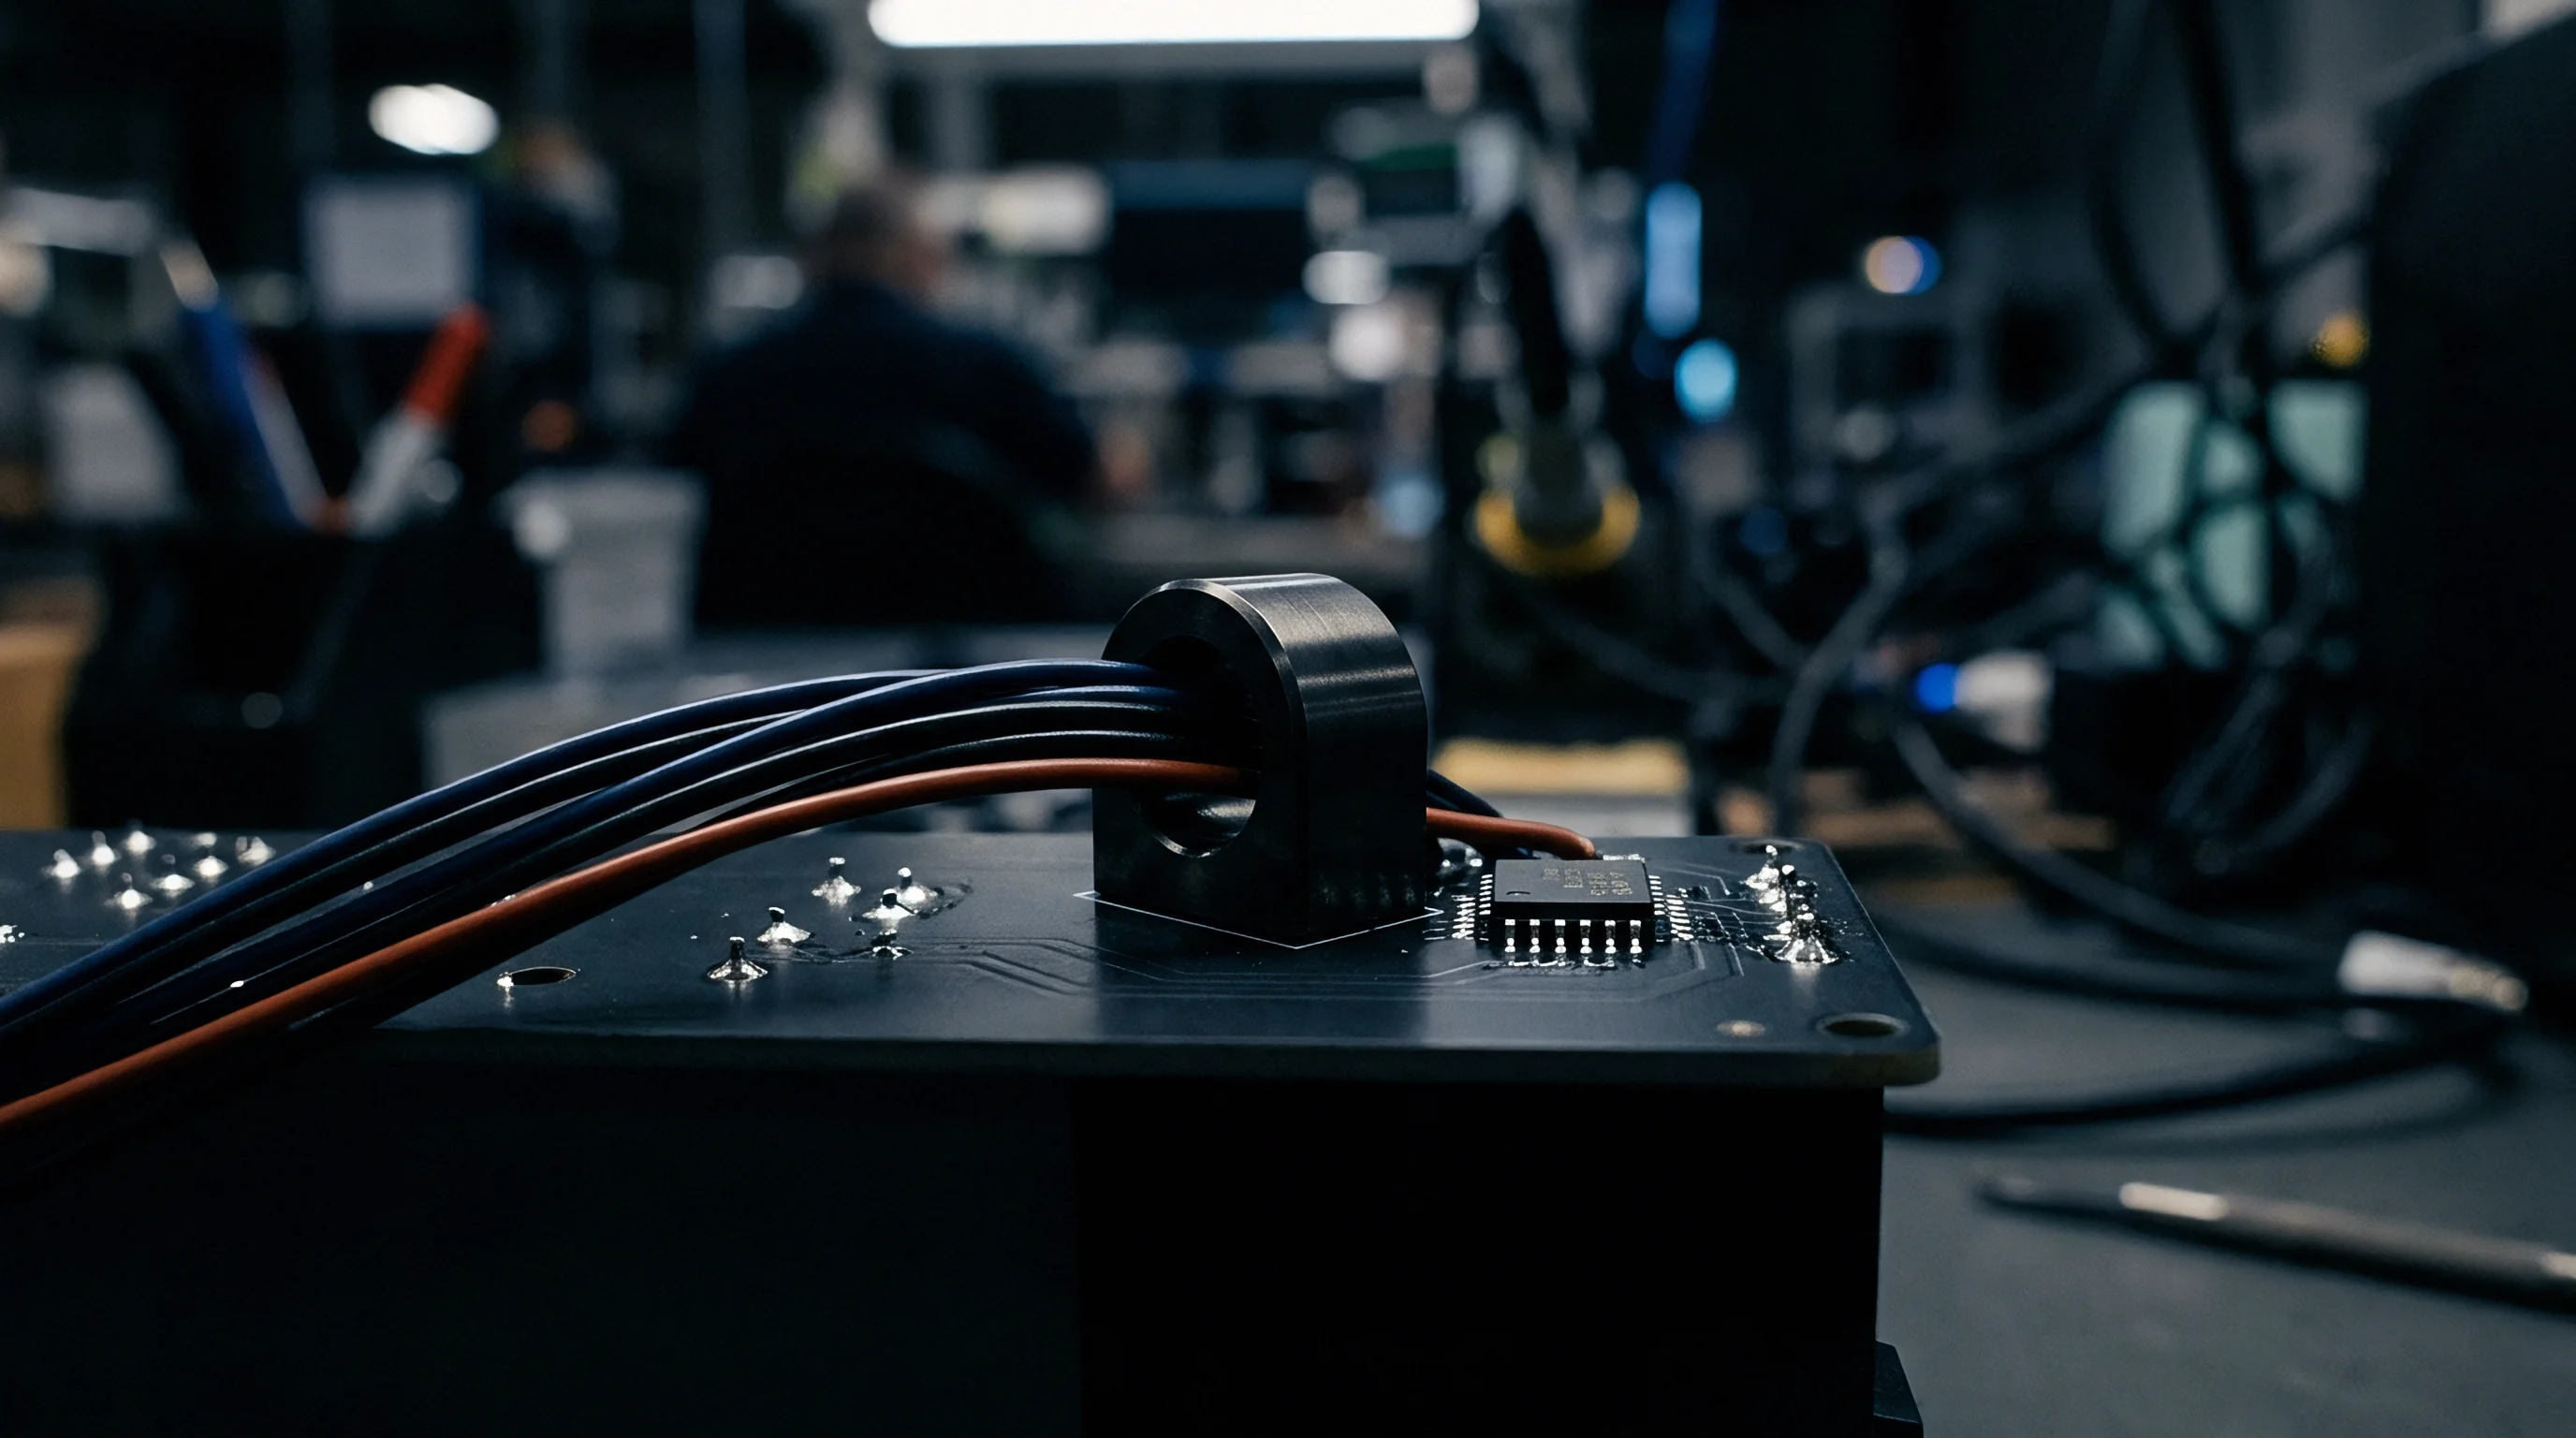
Magnetic ferrite chokes wrapped around coaxial cables suppress shield current without interrupting the DC reference plane of the measured printed circuit board. High-permeability toroidal cores increase the common-mode impedance of the outer braid. Placing several ferrite sleeves along both Port 1 and Port 2 cables establishes hundreds of ohms of inductive reactance against ground loop currents from ten kilohertz to thirty megahertz.
This impedance forces return current into the low-resistance ground plane of the device under test.
- Clamp multiple high-permeability manganese-zinc ferrite toroids around the Port 1 semi-rigid coaxial feed line adjacent to the instrument output.
- Wrap the Port 2 receiver coaxial line through three turns of an iron-powder toroid to choke common-mode currents at intermediate frequencies.
- Verify common-mode isolation by terminating both coaxial probe tips into fifty-ohm loads while holding tips isolated from the ground plane.
- Observe the S21 noise floor on the analyzer screen to confirm isolation suppression below minus one hundred and ten decibels.

Common Mode Choke Magnetic Saturation
Ferrite cores experience severe flux density excursions when external DC bias or excessive RF power flows through the coaxial setup. If an active rail carrying twenty amperes of DC bias current connects directly to an unisolated analyzer input, common-mode return current drives ferrite cores into deep magnetic saturation. Inductance collapses to air-core values within microseconds.
DC blocking capacitors prevent DC rail bias from entering the sensitive receiver stages of the analyzer. High-value ceramic capacitors exhibit non-linear capacitance drift and parasitic series inductance. Using dedicated coaxial DC blocks containing matched microwave capacitors preserves impedance flatness from five kilohertz up to three gigahertz without saturating cable chokes.
The test technician must verify that shield chokes remain well within their linear permeability zone across the entire sweep duration.
Premium double-braided shields provide ninety-nine percent magnetic shielding effectiveness, yet this shielding metric fails completely to suppress conductive ground loops formed when two analyzer chassis ports share a common ground bus.
Standard
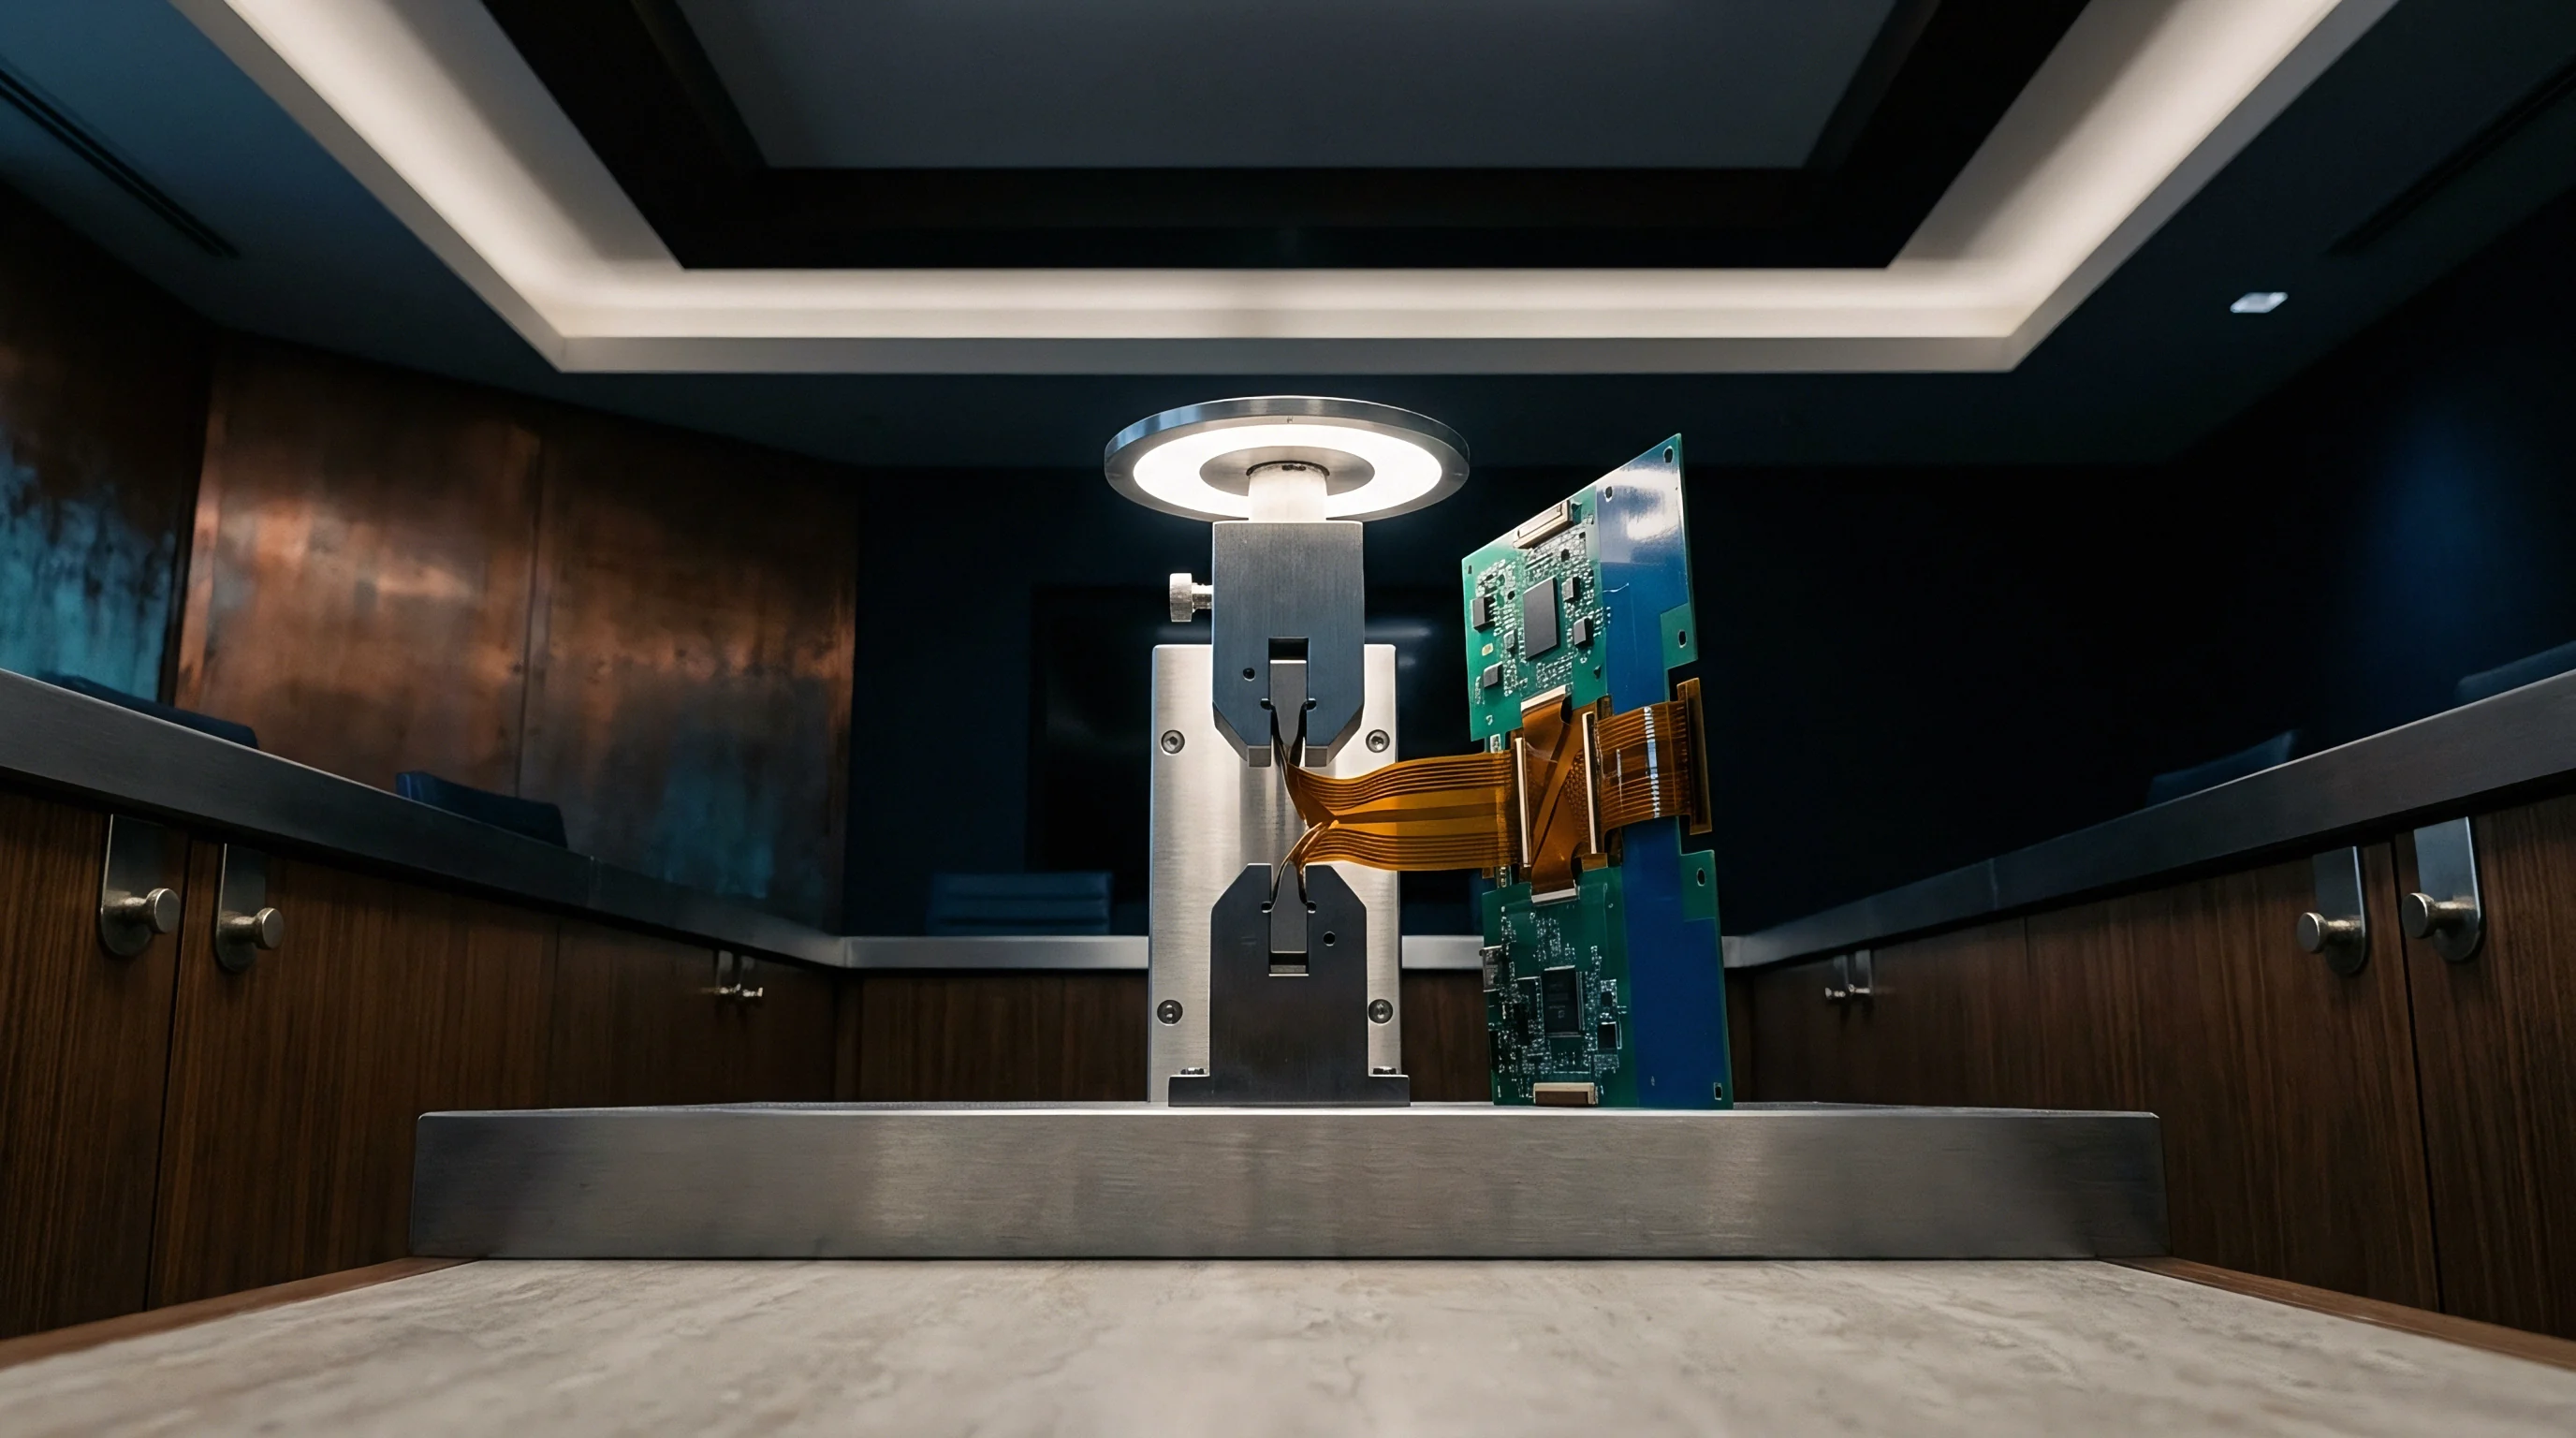
Calibration procedures establish mathematical correction arrays that cancel systematic hardware errors inside the analyzer and its attached cabling. Systematic tracking errors, source match deviations, and receiver directivity flaws dissolve once precision physical artifacts provide baseline reference points. In high-frequency power plane characterization, defining the physical boundary where calibration ends and the board fixture begins decides whether the extracted milliohm value reflects the design or the cable harness.
The standard Short-Open-Load-Thru sequence requires tailored execution for two-port shunt-through topologies. The Load standard sets the fifty-ohm termination reference for each port independently. The Open standard establishes stray fringe capacitance corrections.
The Short standard determines residual series inductance. The Thru standard links the ports, normalizing receiver tracking. In power rail setups, an Isolation standard must accompany the sequence to capture residual cross-talk between probe tips.
Section 4.3 of the primary power rail verification specification dictates that calibration fixture artifacts must present mechanical tolerances within plus or minus two micrometers of certified dimensions.
Planar calibration substrates fabricated on alumina or ceramic substrates deliver predictable standards up to microwave frequencies. Connecting coaxial probes to planar standards involves mechanical scrub and contact pressure variations. Gold-plated substrate pads oxidize slowly, and probe skating strips metallization after repeated touchdowns.
A five-milliohm shift in contact resistance on a calibration Short standard distorts every subsequent low-impedance calculation across the entire power distribution network.

Short Open Load Thru Calibration Mechanics
Executing an accurate Short-Open-Load-Thru routine demands exact definition of standard delay coefficients inside the analyzer calibration kit registry. Calibration standards deviate from idealized mathematical models. A coaxial Short standard presents a small, frequency-dependent residual inductance, parameterized as a third-order polynomial:
L(f) = L0 + L1 f + L2 f^2 + L3 f^3
Entering inaccurate polynomial coefficients shifts the apparent calibration reference plane by several millimeters. That offset introduces artificial negative inductance into the extracted rail impedance at frequencies above one hundred megahertz. The Thru standard requires an accurate definition of electrical delay and loss.
An uncharacterized zero-length Thru calibration forces the instrument to treat physical fixture length as zero picoseconds, pulling board trace delay into the calibrated instrument plane.
| Standard Type | Nominal Value | Physical Residual Parameter | Impact on 1 Milliohm Rail Sweep | Verification Window |
|---|---|---|---|---|
| Precision Coaxial Short | 0.000 ohms | 1.2 picohenries residual inductance | High-frequency impedance overestimation above 200 MHz | Weekly dimensional inspection |
| Ceramic Substrate Open | Infinite ohms | 15 femtofarads fringing capacitance | Phase calculation distortion in low-capacitance rails | Every 500 touchdowns |
| Thin-Film Alumina Load | 50.00 ohms +/- 0.1% | 0.05 ohms DC resistance deviation | 0.1% baseline scaling shift across complete S21 spectrum | Daily four-wire DC resistance check |
| Zero-Length Thru | 0.00 ps delay | 3.5 ps contact interface delay | Phase rotation and false negative resistance artifacts | Pre-shift optical alignment check |
| Isolation Cross-Standard | 120 dB isolation | -95 dB probe-to-probe electromagnetic coupling | Artificial noise floor elevation between 50 MHz and 1 GHz | Per calibration cycle |
Planar Substrate Probe Tip Contact Resistance
Micro-probing power rail geometries involves miniature ground-signal or signal-ground-signal probe configurations. Mechanical touchdown repeatability dominates calibration uncertainty. When probes contact planar gold pads, surface contaminants, dust, and plating roughness create variable contact resistance.
Engineers qualify calibration validity by stepping through systematic physical checks:
- Microscope optical alignment confirms probe tips seat squarely within standard pad boundaries without lateral skating past designated alignment markings.
- Contact resistance verification involves measuring the Short standard three successive times to confirm contact resistance repeatability stays within fifty micro-ohms.
- Substrate surface cleaning uses pure isopropyl alcohol and lint-free micro-swabs to strip organic residues from ceramic standard surfaces before calibration runs.
- Touchdown force calibration employs precision micromanipulators with mechanical detents to guarantee uniform mechanical loading across every contact cycle.
Clause 7.2 of the corporate supplier quality agreement mandates that any calibration sequence exhibiting a contact resistance variance exceeding one hundred micro-ohms across ten touchdowns immediately invalidates all subsequent rail impedance characterization certificates.
Coupon
Calibrating at probe tips leaves printed circuit board layout parasitics embedded in measured data. Test coupons isolate board parasitics. Power planes connect to surface components through microvias, breakout traces, and surface-mount device landing pads.
These small copper geometries contribute parasitic series resistance and loop inductance that obscure intrinsic power plane behavior. Test engineers design in-fixture calibration coupons to peel away routing traces and leave only pure rail characteristics.
In-fixture de-embedding methods depend on dedicated test structures fabricated on the same board panel as the production circuit. The Thru-Reflect-Line method provides rigorous de-embedding up to high frequencies. Thru-Reflect-Line relies on transmission line sections rather than lumped impedance standards.
A Thru line connects fixture input and output ports directly. A Reflect standard provides high, unknown reflection. One or more Line standards introduce phase delay offsets across specified frequency spans.
Where Calibration Artifacts Deviate from Nominal Standards?
Fabrication variations in coupon trace width, copper thickness, and dielectric constant shift calibration coupon characteristics away from nominal simulation models. A ten percent dielectric constant tolerance in FR-4 or Megtron-6 laminates shifts the characteristic impedance of Thru-Reflect-Line Line standards by several ohms. That shift warps the de-embedding reference impedance from fifty ohms to an arbitrary value, introducing progressive impedance distortion into high-frequency sweeps.
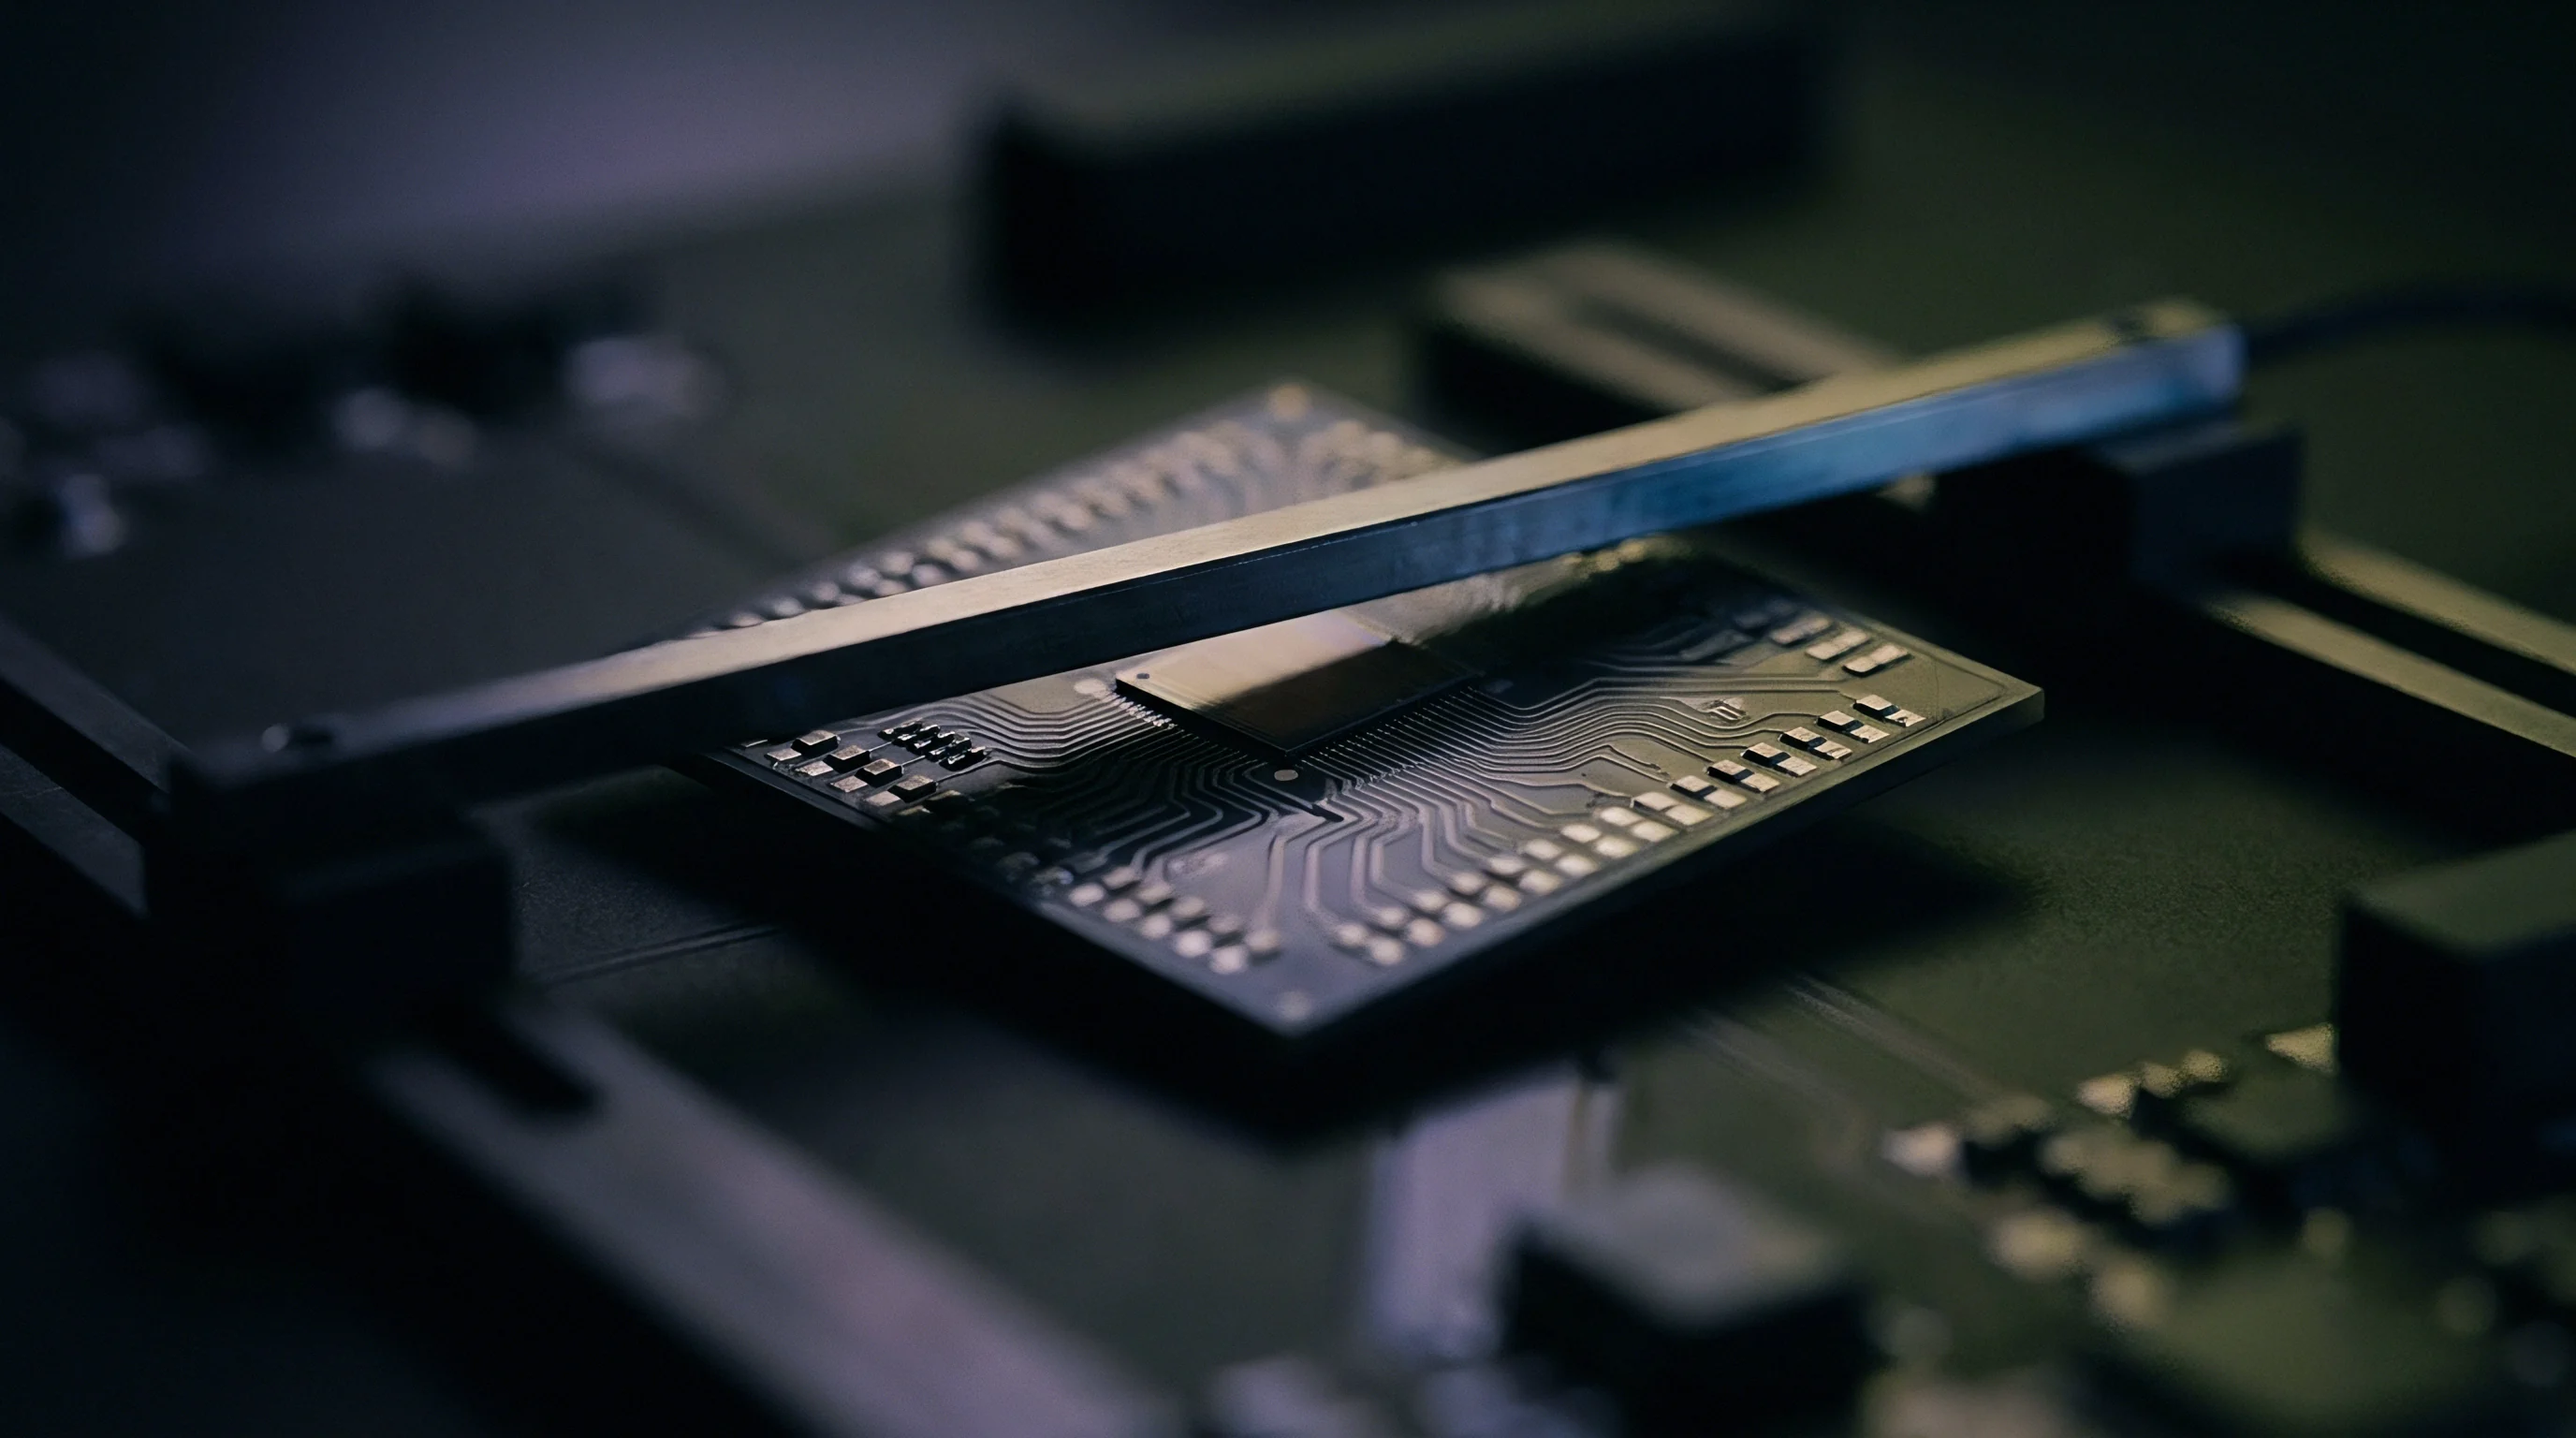
The 2x-Thru de-embedding technique avoids complex multi-line coupon arrays. A 2x-Thru coupon consists of back-to-back representations of the launch fixture traces leading to the power rail under test. Mathematical algorithms split the measured 2x-Thru scattering matrix into two symmetrical halves, yielding individual 1x error networks representing Port 1 and Port 2 routing paths.
The instrument or post-processing software de-embeds these 1x networks from raw rail measurements through matrix inversion.
Two Port Fixture Extraction and De-Embedding
Algorithmic de-embedding strips fixture loss and phase delay, exposing raw decoupling capacitor impedance curves directly at component landing pads. De-embedding introduces extreme sensitivity to measurement noise. Matrix inversion of scattering transmission matrices amplifies calibration noise near quarter-wavelength fixture resonances.
If the physical 2x-Thru coupon exhibits slight asymmetry compared to actual board routing, mathematical cancellation leaves ghost resonances in the power rail impedance plot.
Phase errors in fixture extraction algorithms generate negative equivalent series resistance in decoupling capacitor characterization. When mathematical de-embedding over-compensates for trace series resistance, capacitor resonance dips register equivalent series resistance values below zero ohms. Engineers bound fixture de-embedding routines by validating results against known passive resistor components mounted across identical pad footprints.
Can automated de-embedding routines ever fully separate the three-dimensional electromagnetic mutual coupling between adjacent microvias from the intrinsic bulk capacitance impedance of high-density interconnect power planes?

Uncertainty
Measurement uncertainty analysis compiles instrument specifications, cable stability metrics, calibration residuals, and physical contact variances into a defensive error band. Measuring a five-milliohm power distribution network impedance within ten percent accuracy requires total measurement uncertainty below five hundred micro-ohms. Instrument linearity contributes fractionally to this total.
Coaxial cable flexure, thermal receiver drift, and probe contact inconsistency form the bulk of the error budget.
Thermal stability within the test environment alters internal receiver calibration coefficients rapidly. Vector analyzers require a minimum of forty-five minutes of warm-up time before executing calibration routines. Ambient temperature shifts exceeding one degree Celsius alter receiver gain and phase tracking, invalidating the calibration error model.
The intermediate frequency bandwidth setting dictates dynamic range and receiver noise floor. Selecting a ten-hertz intermediate frequency bandwidth achieves exceptional dynamic range at the cost of prolonged sweep duration. Prolonged sweeps expose the measurement setup to laboratory ambient temperature drift.
A calibrated five-milliohm shunt-through sweep at ten megahertz carries an expanded measurement uncertainty of plus or minus eight percent when ambient laboratory temperature fluctuates by two degrees Celsius during testing.
Error Budgets across Milliohm Boundaries
Constructing an uncertainty ledger demands explicit isolation of systematic and random error components. Systematic errors include calibration standard tolerances, receiver non-linearity, and residual directivity. Random errors incorporate cable movement phase variations, connector mating repeatability, and thermal noise.
As the target impedance decreases toward the sub-milliohm territory of modern silicon core rails, contact resistance repeatability transitions into the dominant contributor.
At two hundred micro-ohms target impedance, an uncalibrated probe contact resistance variation of fifty micro-ohms consumes twenty-five percent of the total allowable error margin. To manage this limitation, verification routines incorporate multiple measurement passes combined with statistical averaging. Calibration planes require verification before and after every production batch test sequence to ensure drift parameters remain bounded.
| Uncertainty Parameter | 100 kHz Value | 10 MHz Value | 500 MHz Value | Distribution Model |
|---|---|---|---|---|
| Instrument Linearity and Dynamic Noise | +/- 0.05% | +/- 0.08% | +/- 0.25% | Normal (k=2) |
| Cable Shield Braid Isolation Leakage | +/- 4.50% | +/- 0.30% | +/- 0.10% | Rectangular |
| Probe Contact Resistance Variation | +/- 2.10% | +/- 1.80% | +/- 2.50% | U-shaped |
| Fixture De-embedding Extraction Residuals | +/- 0.20% | +/- 1.10% | +/- 6.80% | Rectangular |
| Calibration Standard Inductive Offset | +/- 0.01% | +/- 0.15% | +/- 3.20% | Normal (k=2) |
| Combined Expanded Uncertainty (k=2) | +/- 5.12% | +/- 2.34% | +/- 8.15% | Normal |
| Methods note: Uncertainty figures derived under Root-Sum-Square expansion adhering to ISO Guide 98-3 requirements using fifty-milliohm intermediate test artifacts under controlled laboratory ambient temperatures of twenty-two degrees Celsius. | ||||
Production Batch Acceptance Threshold Criteria
Incoming inspection of high-speed digital circuit boards hinges on clear pass and fail criteria rooted in calibrated impedance boundaries. A power rail specification mandating a maximum impedance of fifteen milliohms up to two hundred megahertz requires guard banding against calibration uncertainty. If the combined test uncertainty equals eight percent, the practical production acceptance limit drops to 13.8 milliohms.
Procurement teams reject production lots whenever uncalibrated rail impedance tests breach these guard bands. Quality documentation must capture the calibration kit serial numbers, the date of artifact certification, the intermediate frequency bandwidth, and the specific de-embedding file applied to the measurement. A test certificate lacking verified reference plane calibration data fails to prove delivery conformity under international electronics manufacturing standards.
Trust only the impedance that remains unchanged when coaxial cables are flexed and probe tips are reseated three successive times.