Optimizing Solder Paste Transfer Efficiency on Fine Pitch Component Arrays
Fine pitch solder paste transfer efficiency increases by pairing electroformed stencils with Type 5 powder and controlled separation speeds.
Aperture
Solder paste transfer efficiency across sub-0.4 millimeter pitch component array pads depends directly on physical wall friction during stencil release. When an SMT squeegee sweeps over an aperture, hydraulic pressure forces the paste into the cavity. As the stencil lifts vertically from the printed circuit board, two competing forces determine paste release: adhesion to the board pad surface versus adhesion to the aperture sidewalls.
For standard pitch components, an area ratio above 0.66 provides enough pad surface area to pull paste clean from the aperture walls. On fine pitch component arrays, such as 0.3 millimeter wafer-level chip-scale packages and 0.4 millimeter pitch ball grid arrays, standard aperture calculations fail to guarantee uniform volumetric deposition.
Calculating the area ratio requires dividing the area of the aperture opening at the copper pad interface by the total surface area of the internal aperture sidewalls. For a circular aperture of diameter D and stencil foil thickness t, the area ratio simplifies to D divided by 4t. For a square aperture of side length W, the formula yields W divided by 4t.
When board designs shrink copper pad diameters down to 200 micrometers, maintaining a traditional 0.66 area ratio requires a stencil foil thickness of less than 75 micrometers. Thin foils preserve area ratios for fine pitch array pads, yet they starve surrounding surface mount components of required solder volume. Resolving this volume discrepancy demands specialized stencil fabrication processes, tailored aperture geometries, and advanced surface treatments.
Area Ratio Physics for Sub-Four-Millimeter Array Geometry
Deposition volumes drop precipitously when pad widths shrink beneath stencil foil thickness. Laser-cut stainless steel stencils represent the traditional industry baseline. Laser cutting creates micro-ridge striations along internal aperture sidewalls as the thermal beam melts through the steel sheet.
These striations act as mechanical anchors that trap solder paste particles during stencil separation. Chemical electropolishing smooths these laser striations, reducing surface roughness from roughly 0.8 micrometers Ra down to approximately 0.2 micrometers Ra. Electropolishing slightly rounds aperture corners and enlarges wall dimensions by two to five micrometers, requiring pre-cut aperture scaling in CAM software to maintain targeted volume limits.
| Fabrication Process | Typical Wall Roughness (Ra) | Minimum Area Ratio (AR) Limit | Dimensional Tolerance | Relative Tooling Cost |
|---|---|---|---|---|
| Standard Laser-Cut Stainless Steel | 0.70 – 0.90 µm | 0.66 | ± 5 µm | 1.0x |
| Electropolished Laser-Cut Steel | 0.20 – 0.35 µm | 0.58 – 0.60 | ± 4 µm | 1.3x |
| Electroformed Nickel Foil | 0.03 – 0.08 µm | 0.50 – 0.52 | ± 2 µm | 3.5x |
| Laser-Cut Steel with Fluoro-Polymer Nano-Coating | 0.15 – 0.25 µm | 0.54 – 0.56 | ± 3 µm | 1.8x |
| Data compiled from factory process characterization trials on 0.35 mm pitch micro-BGA land patterns using Type 5 solder paste. | ||||
Aperture Wall Morphology and Foil Fabrication
Electroformed nickel processes produce grainless sidewalls with average roughness measurements below 50 nanometers Ra. Nickel stencils are built additively through electroplating nickel around photoresist posts on a stainless steel mandrel. Electroforming yields smooth, straight sidewalls with a trapezoidal cross-section that opens naturally toward the PCB contact side. The resulting stencil release kinetics allow stable transfer efficiency at area ratios down to 0.50.
Applying a hydrophobic and fluxphobic nano-coating to either laser-cut or electroformed stencils alters the liquid contact angle of the flux vehicle. Nano-coatings reduce solder paste adhesion to the underside of the stencil foil, preventing lateral paste squeeze-out and extending automatic under-stencil cleaning wipe cycles from every 3 prints to over 20 prints.
A minimum area ratio of 0.55 delivers acceptable volume repeatability only when electroformed nickel stencils pair with Type 5 powder paste.
Aperture shape modifications alter local release dynamics on dense array patterns. Substituting rounded square apertures for circular apertures increases total base area while keeping perimeter wall area constant, boosting the calculated area ratio by nearly twenty-one percent. Home-base, oblround, and radiused corner geometries eliminate sharp 90-degree corners where paste particles become wedged.
When processing mixed-technology boards carrying both fine pitch arrays and heavy power devices, step-down stencils deliver localized foil thinning. Machined micro-step or electroformed multi-tier stencils apply an 80 micrometer foil thickness over high-density BGA zones while preserving a 127 micrometer foil thickness across standard passive areas.
- Wall Drag Insufficiency occurs when laser-cut kerf taper forces paste upward during print stroke release.
- Corner Paste Trapping develops in sharp square features where particle binding exceeds liquid shear.
- Gasket Sealing Breach arises from stencil misregistration exceeding ten micrometers across panel outer edges.
- Nano-Coating Flaking introduces microscopic polymer debris into paste deposits after repetitive cleaning wipes.
Inadequate wall clearance or incorrect aspect ratio selection causes paste volume deficits below sixty percent, leading directly to un-wetted pads, head-in-pillow open circuits, and total line shutdown during automated optical inspection.
Rheology
Solder paste acts as a non-Newtonian shear-thinning fluid under the mechanical action of an SMT squeegee blade. In a static state on the stencil surface, high initial yield stress prevents the paste roll from slumping or leaking through open apertures. As the squeegee blade rolls the paste bead forward at speeds between 25 and 100 millimeters per second, shear rates within the paste roll rise above 100 s⁻¹, causing paste viscosity to drop from 800 Pa·s down to 100 Pa·s.
This viscosity drop allows the paste to flow smoothly into micro-apertures. Once the squeegee pass completes and shear stress drops back to zero, the paste medium must regain its structural body rapidly enough to prevent deposit slump before reflow heating.
When Does Aperture Area Ratio Override Powder Type Selection?
Component land patterns featuring pitch dimensions under 350 micrometers demand strict particle size alignment regardless of stencil wall smoothing. Solder paste formulations consist of suspended spherical alloy particles blended into a thixotropic flux matrix. IPC J-STD-005A defines powder classifications based on particle diameter distribution limits.
Standard assembly lines utilize Type 3 (25 to 45 micrometers) or Type 4 (20 to 38 micrometers) powders for standard SMT components. When aperture opening dimensions shrink below 200 micrometers, Type 3 and Type 4 powders suffer severe mechanical jamming inside the stencil cavity.
| Powder Classification | Particle Size Range (80% Mesh Window) | Maximum Particle Size (100% Pass) | Minimum Aperture Opening Width | Recommended Array Pitch |
|---|---|---|---|---|
| Type 3 | 25 – 45 µm | 50 µm | 250 µm | ≥ 0.65 mm |
| Type 4 | 20 – 38 µm | 40 µm | 200 µm | 0.50 mm – 0.65 mm |
| Type 5 | 15 – 25 µm | 30 µm | 150 µm | 0.35 mm – 0.40 mm |
| Type 6 | 5 – 15 µm | 20 µm | 100 µm | < 0.30 mm |
Empirical printing standards require a minimum of six to eight metal spheres spanning the narrowest dimension of a stencil aperture to guarantee statistical filling uniformity. For a 180 micrometer circular aperture on a 0.4 millimeter pitch BGA, Type 4 powder provides only four to five particle diameters across the span, creating erratic volume deposition and high transfer efficiency variance. Switching to Type 5 powder (15 to 25 micrometers) places seven to nine particle diameters across the same 180 micrometer aperture, stabilizing packing density and restoring volume transfer efficiency above 85 percent.
IPC J-STD-005A particle classification compliance ensures that ninety percent of powder sphere diameters fall within specified size boundaries to prevent stencil aperture clogging.
Fine powders introduce operational trade-offs in chemical stability and oxidation rates. Type 5 and Type 6 powder particles present substantially higher surface-area-to-volume ratios than Type 3 powders. Exposed metal surface area increases atmospheric oxidation risks during storage, handling, and stencil dwell time.
Flux vehicle chemistry for fine powder pastes requires higher concentrations of organic acid activators and specialized anti-slump additives to neutralize oxides without promoting hot slump bridging between adjacent 0.3 millimeter pitch pads. Room temperature stencil life drops from 8 hours down to 4 hours when running ultra-fine powder pastes under low ambient humidity conditions.
Low print volumes often stem from improper shop-floor environmental conditioning or particle size distribution anomalies within low-tier alloy lots.
Blade
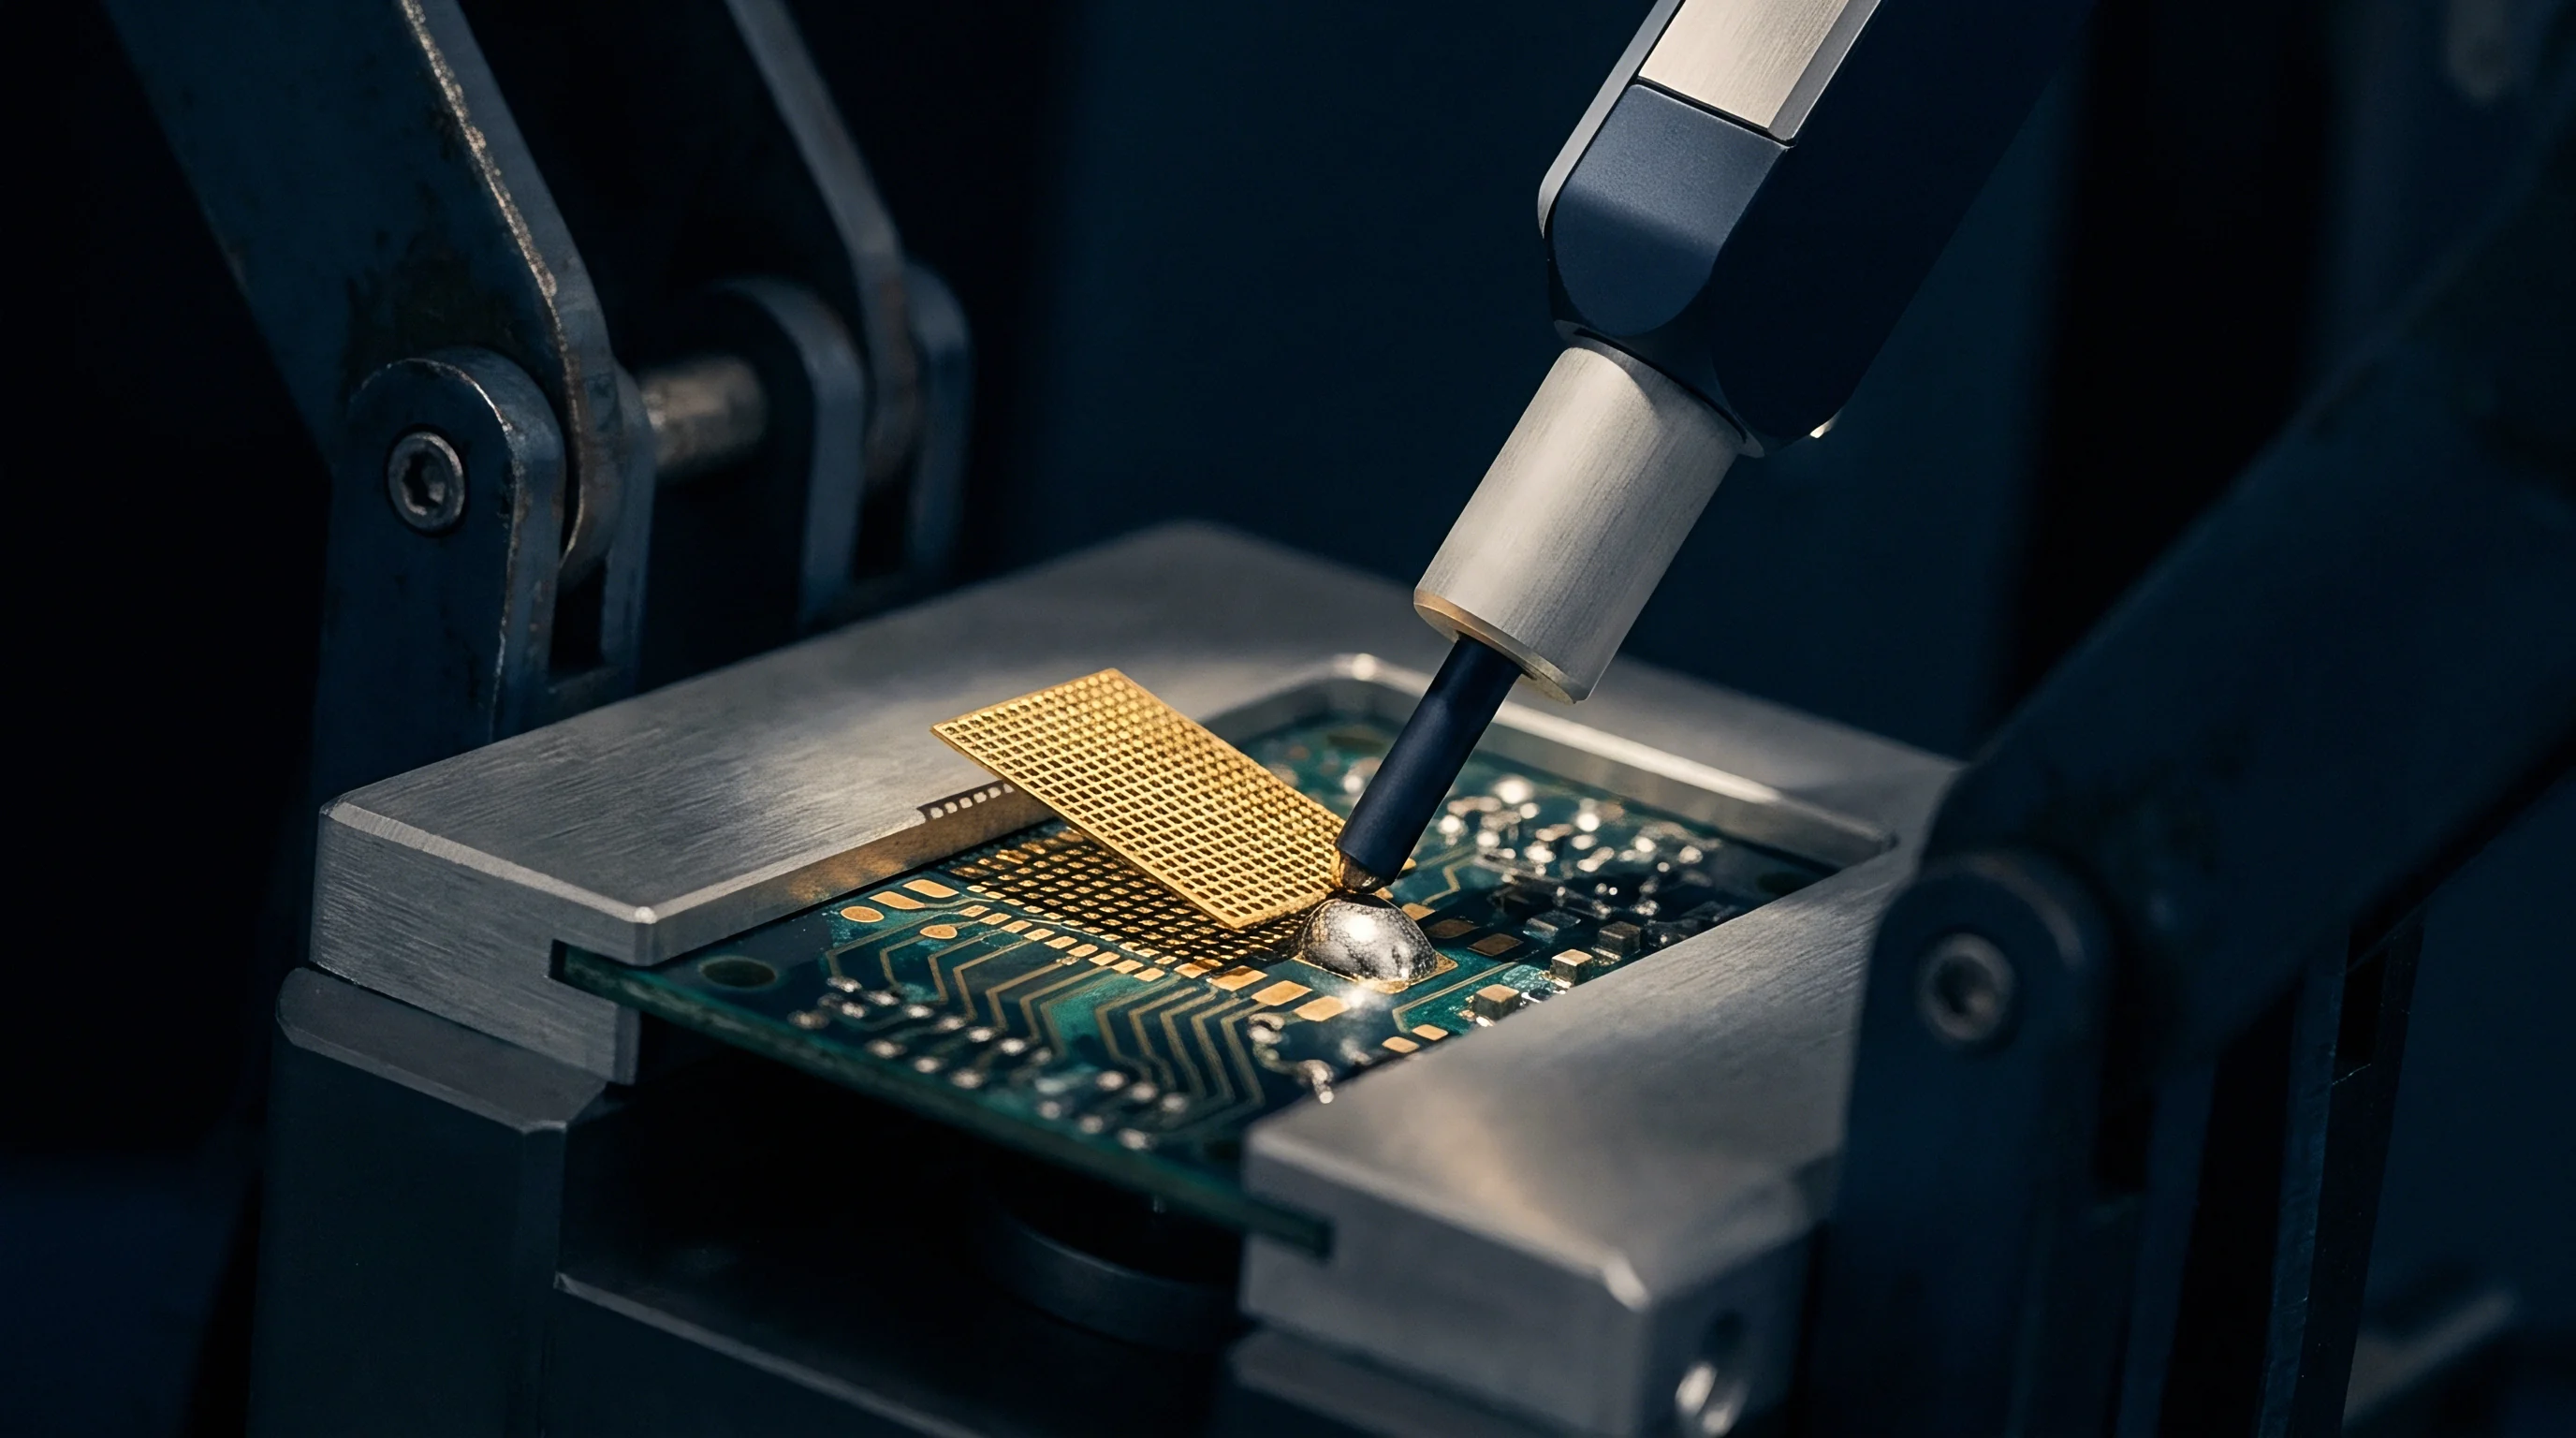
Metal squeegee angles fixed at sixty degrees generate the fluid hydraulic pressure required to roll solder paste across the stencil foil. Operating parameters on automated screen printing machines govern the physical forces imparted to the paste bead. Key controllable variables include squeegee stroke speed, squeegee downforce pressure, stencil separation speed, snap-off distance, and under-stencil cleaning frequency.
Balancing these variables prevents paste smearing, aperture scooping, and incomplete filling across fine pitch component arrays.
Hydraulic Pressure Dynamics during Squeegee Stroke
Excessive squeegee downforce scoops solder paste out of wide apertures while under-pressurization leaves thick paste remnants across stencil tops. Squeegee blade pressure must equal the minimum force required to achieve a clean, dry wipe across the top surface of the stencil foil. Excessive pressure causes squeegee blade edges to flex downward into aperture cavities larger than 0.5 millimeters, gouging out printed paste deposits and reducing center volumes.
Insufficient pressure leaves a continuous film of flux and solder particles on the stencil surface, causing solder balling, stencil gapping, and lateral bridging under fine pitch components.
Print stroke velocity dictates the time window available for solder paste to roll and flow into micro-apertures. Squeegee speeds exceeding 60 millimeters per second generate excessive shear rates, reducing paste viscosity beyond control limits and causing paste slump. High printing speeds also limit aperture dwell time; at 100 millimeters per second, a 200 micrometer aperture experiences less than two milliseconds of hydraulic pressure exposure, resulting in partial aperture filling.
Fine pitch array printing yields peak transfer efficiency at reduced print speeds between 20 and 35 millimeters per second.

Separation Velocity Profiles and Snap-Off Kinematics
Controlled slow separation rates allow paste cohesion to overcome aperture wall friction during stencil lifting. The separation stroke detaches the stencil foil from the printed board surface. Snap-off distance on modern inline SMT printers stays fixed at 0.0 millimeters to maintain complete parallel contact during printing.
Stencil lift speed, or separation velocity, exerts direct force on the liquid paste column inside the aperture. Rapid separation speeds (greater than 5 millimeters per second) tear the paste body apart prematurely, leaving unpredictable, spiked deposits inside apertures and on copper pads.
Slowing the initial separation speed down to 0.1 to 0.3 millimeters per second over the first 0.5 millimeters of vertical travel allows the paste column to release cleanly from the internal sidewalls under controlled capillary action. Once the stencil clears the top of the printed deposit, separation speed can safely accelerate to 10 millimeters per second to optimize overall line beat rate.
- Verify squeegee blade edge integrity using optical magnification before mounting onto print head assemblies.
- Calibrate blade downforce to achieve a clean foil wipe without rolling paste over stencil land edges.
- Set print stroke speed to match paste shear-thinning response for uniform hydraulic filling.
- Configure separation stroke velocity to step down over the initial 0.5 millimeter vertical lift distance.
- Establish under-stencil wipe intervals based on automatic optical inspection bridging alarms.
Fast print speeds demand higher shear paste formulations, while slower stroke speeds allow paste to roll smoothly into tiny openings without generating excessive friction heat.

Volumetrics
Inline 3D solder paste inspection systems evaluate printed deposit height, area, and total displacement using structured laser light triangulation. SPI machines generate volumetric deposit data across thousands of individual PCB pads in real time. Transfer efficiency (TE) translates raw volumetric measurements into a normalized percentage metric: measured paste volume divided by theoretical aperture volume multiplied by one hundred.
Tracking TE distributions across fine pitch array locations exposes systematic printing failures long before boards reach reflow thermal processing.
A worked calculation illustrates how foil thickness adjustments restore process capability on a 0.4 millimeter pitch BGA array. Consider an array of 400 circular pads, each having a copper pad diameter of 220 micrometers. A standard 100 micrometer laser-cut stencil provides a theoretical aperture volume of 3.801 nanoliters per pad (V = π · r2 · t = π · (110 µm)2 · 100 µm = 3,801,327 µm3).
Process data collected across 1,000 printed panels using Type 4 paste yields a mean deposited volume of 3.15 nanoliters with a standard deviation (σ) of 0.28 nanoliters. Mean transfer efficiency equals 82.87 percent (3.15 / 3.801 · 100). Setting lower specification limits (LSL) at 65 percent (2.47 nanoliters) and upper specification limits (USL) at 115 percent (4.37 nanoliters) enables calculation of upper and lower process capability indices:
Cpkupper = fracUSL – μ3σ = frac4.37 – 3.153 · 0.28 = 1.45
Cpklower = fracμ – LSL3σ = frac3.15 – 2.473 · 0.28 = 0.81
The overall process capability index (Cpk) equals 0.81, falling well below the standard automotive and aerospace line qualification threshold of 1.33. The high standard deviation indicates unstable paste release caused by an area ratio of 0.55 (220 / 400). Re-tooling the stencil to an 80 micrometer electroformed nickel foil increases the area ratio to 0.688 (220 / 320).
The theoretical volume shifts down to 3.04 nanoliters. Switching to Type 5 paste under identical squeegee conditions shifts the measured mean deposit volume to 2.60 nanoliters (TE = 85.5%) while collapsing the standard deviation to 0.12 nanoliters. Re-calculating process capability under adjusted limits yields:
Cpklower = frac2.60 – 1.9773 · 0.12 = 1.73
Cpkupper = frac3.496 – 2.603 · 0.12 = 2.48
The updated process capability index (Cpk) reaches 1.73, fully qualifying the printing line for high-reliability production runs.
Statistical Process Control and Cpk Qualification
High-density circuit boards require narrow acceptance bands to guarantee long-term assembly yields. Establishing realistic upper and lower control limits on SPI equipment prevents unnecessary line stoppages while intercepting true print anomalies. Broad tolerance windows (50% to 150% TE) allow defective deposits to enter reflow, resulting in head-in-pillow joints and bridge shorts.
Overly tight windows (85% to 115% TE) trigger false-alarm rates exceeding five percent, forcing machine operators to clear benign flags continuously.
| Component Pitch / Array Type | Lower Spec Limit (LSL % TE) | Upper Spec Limit (USL % TE) | Target Cpk Window | Primary Post-Reflow Defect Risk |
|---|---|---|---|---|
| > 0.80 mm Standard BGA | 70% | 130% | ≥ 1.67 | Solder Bridging / Solder Balls |
| 0.50 mm Fine Pitch BGA | 70% | 125% | ≥ 1.33 | Incomplete Wetting / Micro-Voids |
| 0.40 mm Micro-BGA Array | 75% | 120% | ≥ 1.33 | Head-in-Pillow / Open Circuits |
| 0.30 mm Ultra-Fine CSP | 80% | 115% | ≥ 1.33 | Non-Wetting Open / Pad Bridging |

Inspection Threshold Optimization for Low Escape Rates
Setting volumetric upper alarm limits too tightly triggers false rejection of acceptable paste deposits across fine-pitch land arrays. SPI measurement algorithms calculate volume by summing height pixels across an aperture footprint. PCB warpage, pad height variation, and solder mask registration tolerances induce measurement noise into SPI height readings.
Performing a formal Gage Repeatability and Reproducibility (Gage R&R) assessment ensures that SPI hardware measurement system variation consumes less than ten percent of the total process tolerance band.
- Pad Aspect Validation dictates whether rectangular features require rounded aperture corners to assist deposit release.
- Gage Repeatability Assessment confirms that optical inspection measurement variance accounts for less than ten percent of total process tolerance.
- Aperture Area Mapping identifies pads falling below 0.55 area ratio for specialized step-stencil consideration.
- Defect Threshold Calibration balances volumetric lower limits against real reflow voiding data collected during first-article evaluation.
Optical inspection thresholds tuned too aggressively generate line stoppage costs that quickly surpass the rework cost of minor soldering defects.
Section 4.2 of IPC-7526 requires volumetric gage repeatability and reproducibility studies to achieve variance scores under ten percent before any inline inspection system can legally sign off on production board lots.
Coalescence
Liquid solder surface tension forces drive alloy consolidation during the peak reflow phase. Once printed circuit boards pass solder paste inspection and active component placement, they enter a multi-zone forced convection reflow oven. Solder paste deposits undergo structural transformation across four thermal phases: preheat, soak, reflow, and cooling.
Fine pitch array deposits present extreme thermal sensitivity due to their low volume-to-surface-area ratios.
Thermal Profile Dynamics and Peak Reflow Margins
Convective heat transfer across high-density circuit panels maintains temperature uniformity within five degrees Celsius. Ramp-to-spike profiles minimize thermal exposure time for delicate component bodies, whereas soak profiles equalize temperatures across heavy boards containing high thermal mass copper planes. For lead-free SAC305 alloy, time above liquidus (TAL at 217 °C) stays between 45 and 75 seconds, with peak temperatures reaching 235 to 245 °C. Prolonged soak phases (longer than 120 seconds between 150 and 200 °C) prematurely exhaust organic flux activators, leading to alloy oxidation and poor powder coalescence.
Inadequate heat transfer or uneven air velocity distribution creates localized cold spots across micro-BGA footprints. Solder spheres fail to reach complete liquidus flow when peak temperatures drop below 230 °C, leaving un-coalesced solder powder surrounding BGA sphere interfaces. Conversely, peak temperatures exceeding 250 °C degrade epoxy substrate laminates and accelerate intermetallic compound layer growth, brittling the final joint interface.
Defect Mechanics of Solder Bridging and Interconnect Opens
Surface oxidation on sphere array leads prevents proper alloy wetting when paste volume drops below critical thresholds. Low transfer efficiency directly induces Head-in-Pillow (HIP) defects. During reflow preheat, plastic BGA substrates warp upward due to coefficient of thermal expansion mismatch between the silicon die and the mold compound.
If printed solder volume is insufficient, substrate warpage lifts the component solder sphere entirely out of contact with the paste deposit. The paste melts into a flat pad deposit while the sphere oxidizes independently; as the component flattens out during cooling, the sphere rests against the solidified paste pad without forming a continuous metallurgical bond.
Excessive soak times exhaust active flux activators before fine-pitch solder deposits reach their melting point.
Excessive paste volumes or poor slump resistance cause adjacent paste deposits to touch prior to alloy liquidus. During reflow, surface tension forces fail to separate the merged paste masses, creating permanent solder bridges across 0.3 millimeter pitch land patterns. Nitrogen atmosphere reflow (oxygen levels maintained below 500 parts per million) expands the thermal process window by inhibiting metal oxidation, improving wetting speeds, and reducing overall reflow voiding inside fine pitch array joints.
Whether reactive atmosphere reflow using formic acid can entirely eliminate voiding in sub-three-hundred-micrometer micro-BGA solder joints without accelerating flux residue corrosion remains an open operational debate.
Economics
Assembly floor profitability depends on balancing stencil tooling expenditures against first-pass yields at post-reflow automated optical inspection. Fine pitch assembly optimization incurs direct financial costs in engineering hours, stencil fabrication upgrades, specialized paste formulations, and line setup delays. Quantifying these investments against downstream defect rework expenses clarifies the true cost per placement on production runs.
Stencil Technology Tooling Expenses and ROI Calculations
Investing in electroformed nickel stencils increases initial non-recurring engineering fees while substantially dropping defect rates on complex array builds. A standard laser-cut stainless steel stencil costs approximately $150 to $250. An electroformed nickel stencil costs $800 to $1,500, representing a five-fold tooling surcharge.
On a high-volume production run of 10,000 panels, the $1,000 stencil price delta amortizes to $0.10 per board. If the electroformed stencil improves first-pass assembly yield by just 1.5 percent by preventing micro-BGA opens, it saves over $4,000 in manual inspection and benchtop rework labor, delivering immediate positive return on investment.
Nano-coating treatments add $150 to $250 to base stencil procurement costs. Nano-coatings pay for themselves by reducing under-stencil cleaning solvent usage and wiping paper consumption. Standard stencils require a wet-vacuum cleaning cycle every 3 to 5 prints, consuming line time and solvent.
Nano-coated stencils extend wipe intervals to every 20 prints, saving up to two minutes of active printing line operating time per hour. At standard SMT line operating costs ranging from $250 to $450 per hour, line efficiency gains exceed initial nano-coating tooling fees within the first shift of continuous production.

Line Setup Charges and First Pass Yield Impact
High changeover frequency on short-run production lines penalizes lengthy stencil optimization setup procedures. Fine pitch component arrays require rigorous first-article inspection routines before line release. Operators must spend 30 to 60 minutes adjusting squeegee pressure, verifying laser registration, and running baseline SPI volume verification boards.
Scrap and rework costs for damaged micro-BGA packages ($15 to $45 per component plus technician hourly labor) escalate rapidly if an unoptimized process enters full production.
Consigned assembly contracts shift component scrap risk directly onto the design owner, whereas turnkey contracts force contract manufacturers to absorb material losses. Line qualification protocols that integrate area ratio verification, Type 5 powder transition planning, and automated SPI limit calibration eliminate trial-and-error scrap during initial job setup.
Factoring the true cost of fine-pitch paste printing requires measuring total scrap, rework lab hours, line changeover delays, and warranty exposure over full product lifecycles.