IPC JEDEC 9704 Strain Measurement Methods in Automated Test Fixtures
IPC JEDEC 9704 strain measurement protects surface mount assemblies by mapping transient board flexure and high strain rates during automated fixture testing.
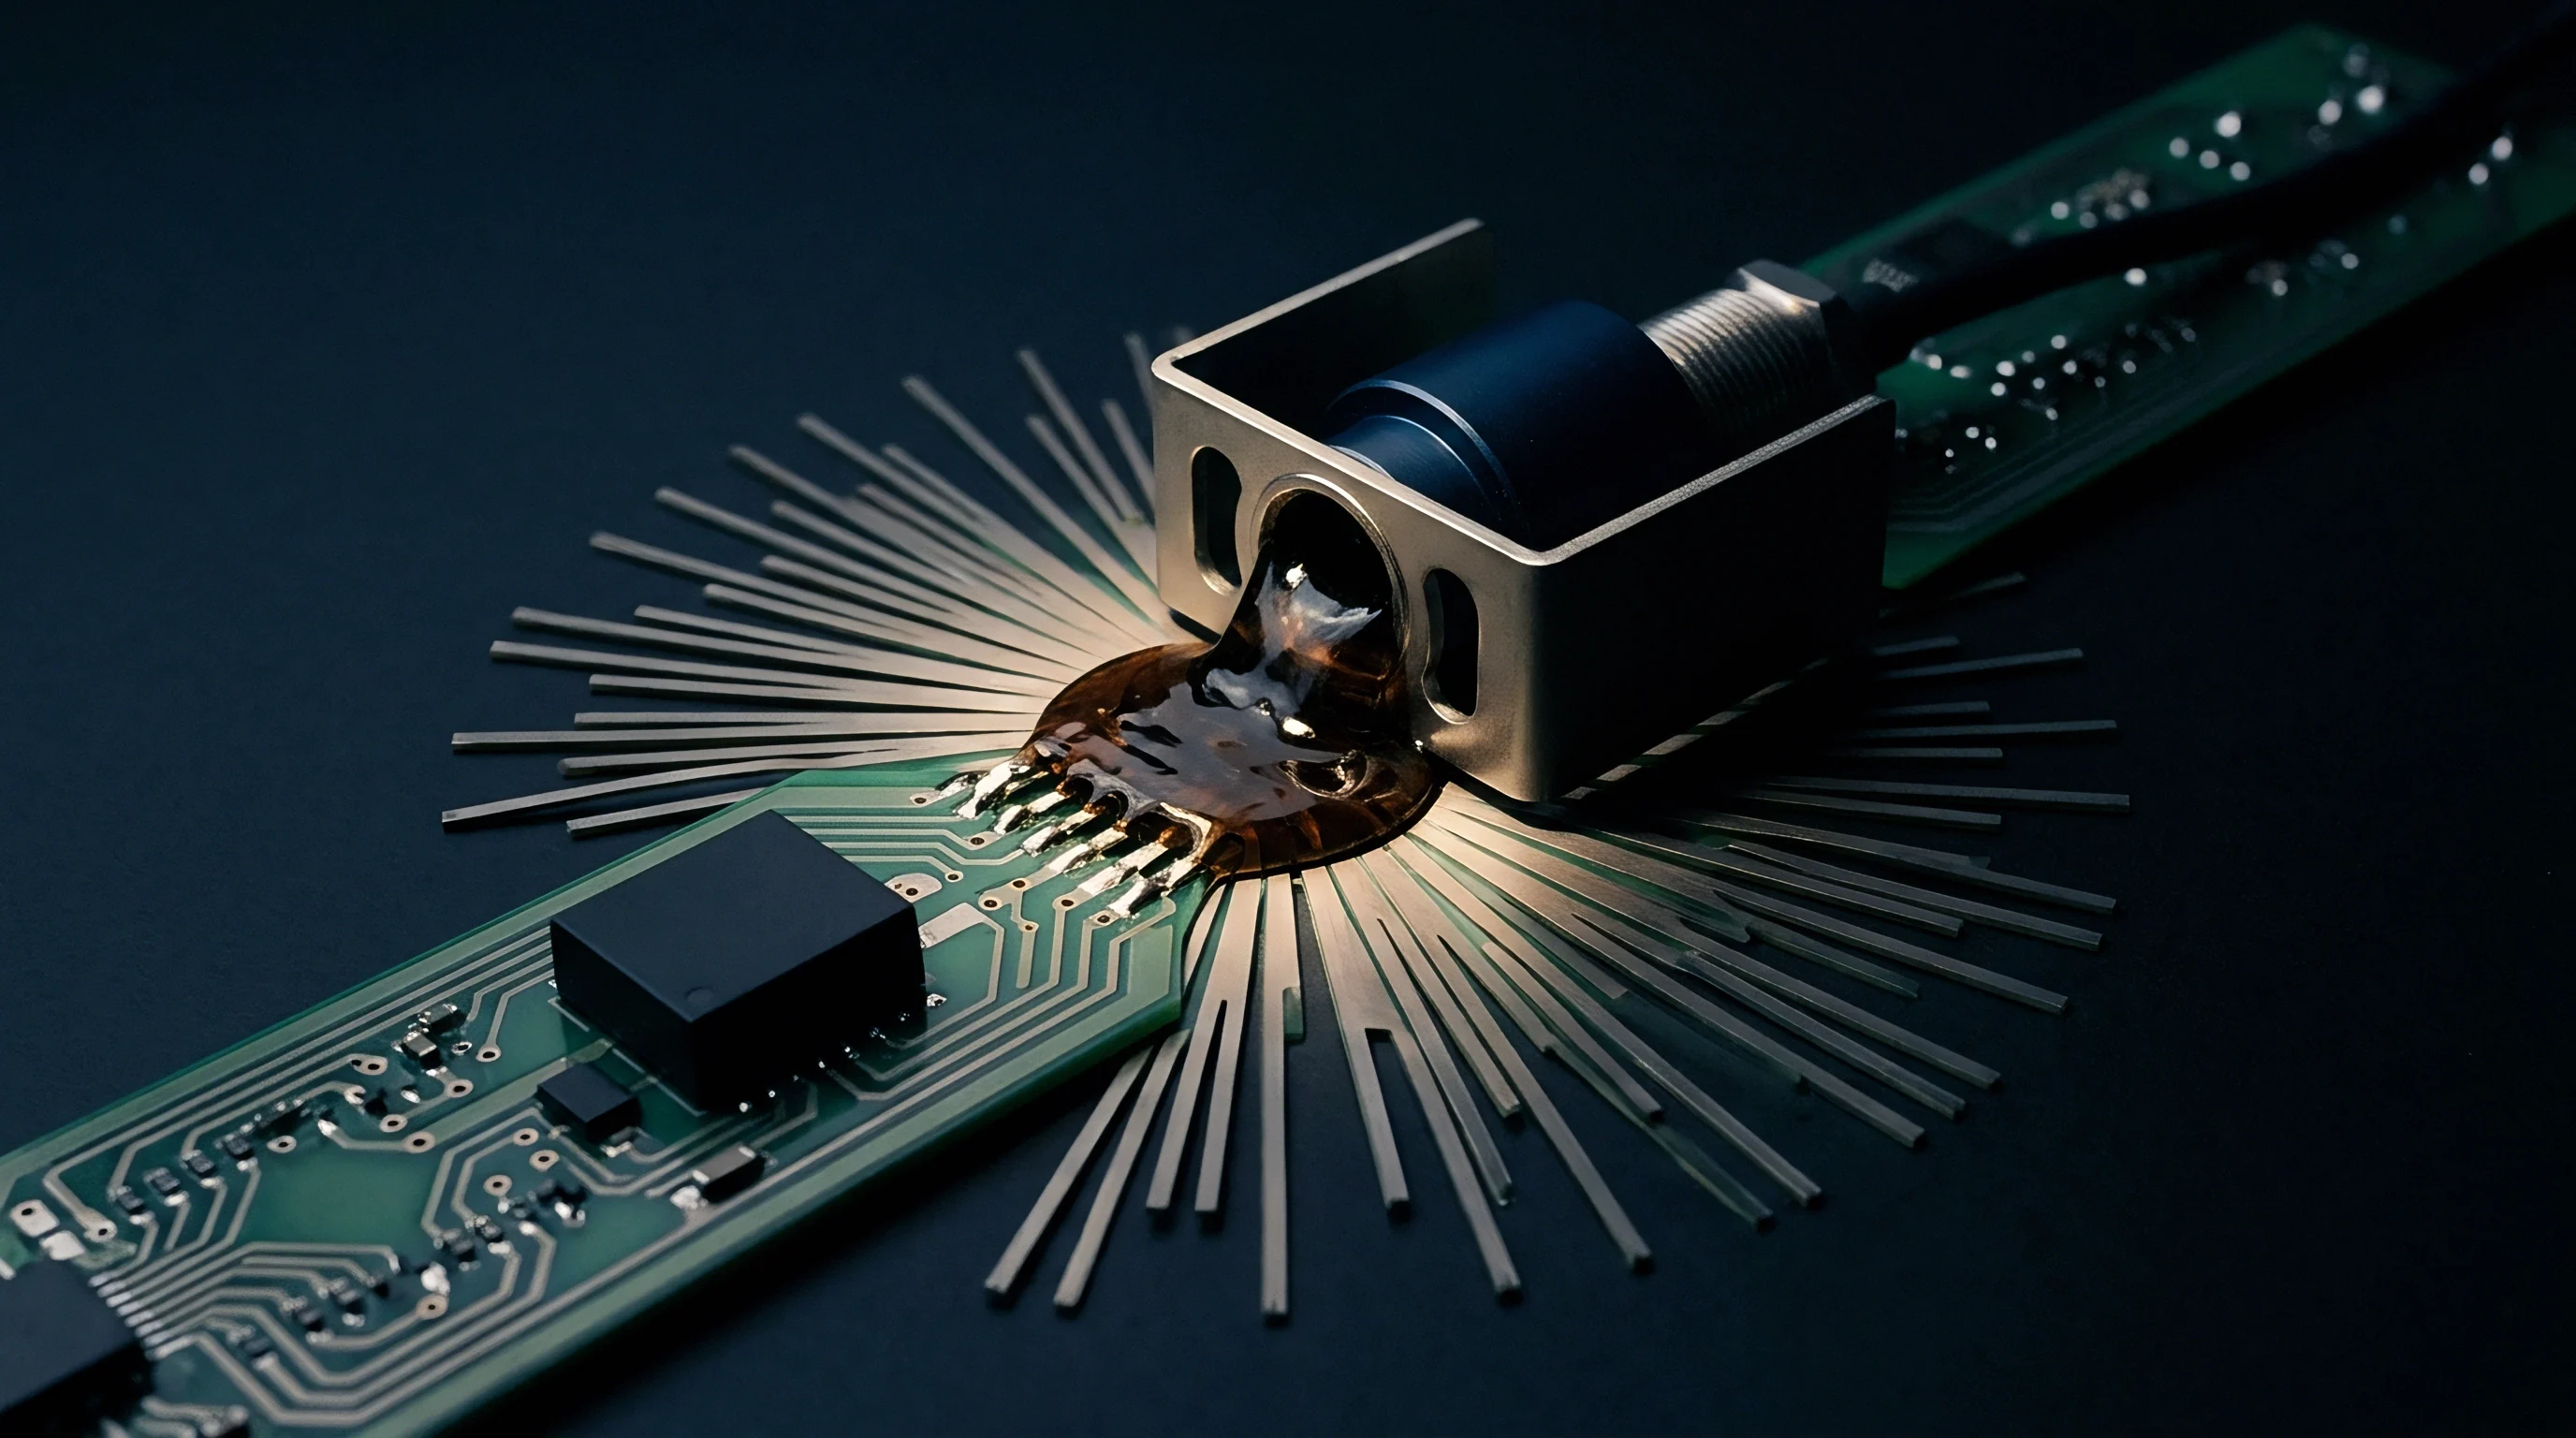

Rosette
Automated test fixtures exert localized mechanical forces on populated printed circuit assemblies during in-circuit testing, functional screening, and board-level burn-in operations. When spring-loaded probes, vacuum seals, push-rods, or pneumatic actuators engage a circuit board, the substrate flexes. This flexure induces tensile and compressive strain in fragile surface-mount components, leading to microcracking in ceramic capacitors, pad cratering under ball grid arrays, and solder joint fractures that remain latent during electrical test.
IPC/JEDEC 9704A defines standard procedures for quantifying these transient mechanical deformations using miniature foil strain gauges attached directly to high-risk board locations.
Selecting the appropriate gauge configuration dictates the accuracy of captured strain vectors. Standard single-element gauges measure strain along only one axis, missing off-axis tensile forces that frequently tear microvias and solder balls away from copper land pads. Stacked or planar triaxial strain rosettes contain three independent sensing elements arranged at known relative angles, allowing total determination of the principal strain state.
Matrix layout choices depend on board layout density near component boundaries.
| Rosette Pattern | Grid Orientation | Active Element Length | Substrate Footprint | Target Application |
|---|---|---|---|---|
| Stacked Triaxial (0°/45°/90°) | Concentric stacked layers | 0.6 mm to 1.0 mm | 3.5 mm × 3.5 mm | High-density BGA corners with restricted clearance |
| Planar Triaxial (0°/45°/90°) | Single-plane coplanar | 1.0 mm to 1.5 mm | 6.5 mm × 6.5 mm | Standard clearance zones near large connectors and MLCCs |
| Delta Triaxial (0°/60°/120°) | Equiangular coplanar | 1.0 mm to 2.0 mm | 7.0 mm × 7.0 mm | Isotropic stress fields near mechanical mounting stiffeners |
Placement accuracy directly governs signal validity. Positioning a rosette too far from a target solder joint yields underestimated strain measurements due to the steep strain gradients radiating from rigid component bodies. IPC/JEDEC 9704A specifies placing the active grid edge within 1.0 mm to 2.0 mm of component corner termination pads without overlapping solder masks or silkscreen markings.
Surface preparation requires stripping solder masks cleanly to raw laminate resin using micro-abrasive methods, followed by solvent degreasing and solvent neutralization. Epoxy adhesive thickness must stay below 15 micrometers to prevent mechanical compliance from dampening peak strain transmissions.
A triaxial rosette positioned 1.5 millimeters from a package corner registers peak principal microstrain values up to forty percent higher than a gauge placed 3.0 millimeters away under identical push-pin loading.
Assembly line fixtures expose test boards to complex, multi-axis bending profiles. High component density limits the available board area for gauge attachment. Micro-miniature stacked rosettes overcome space constraints by layering three sensing grids vertically over a single thermal center.
Stacked elements introduce slight thermal dissipation variance between layers, requiring precise excitation voltage control to avoid drift during active measurement sweeps.
Whether secondary strain peaks occurring during manual board insertion into fixture gates exceed the damage threshold of lead-free SAC305 solder joints over continuous production cycles remains a subject of investigation within field reliability programs.

Pin
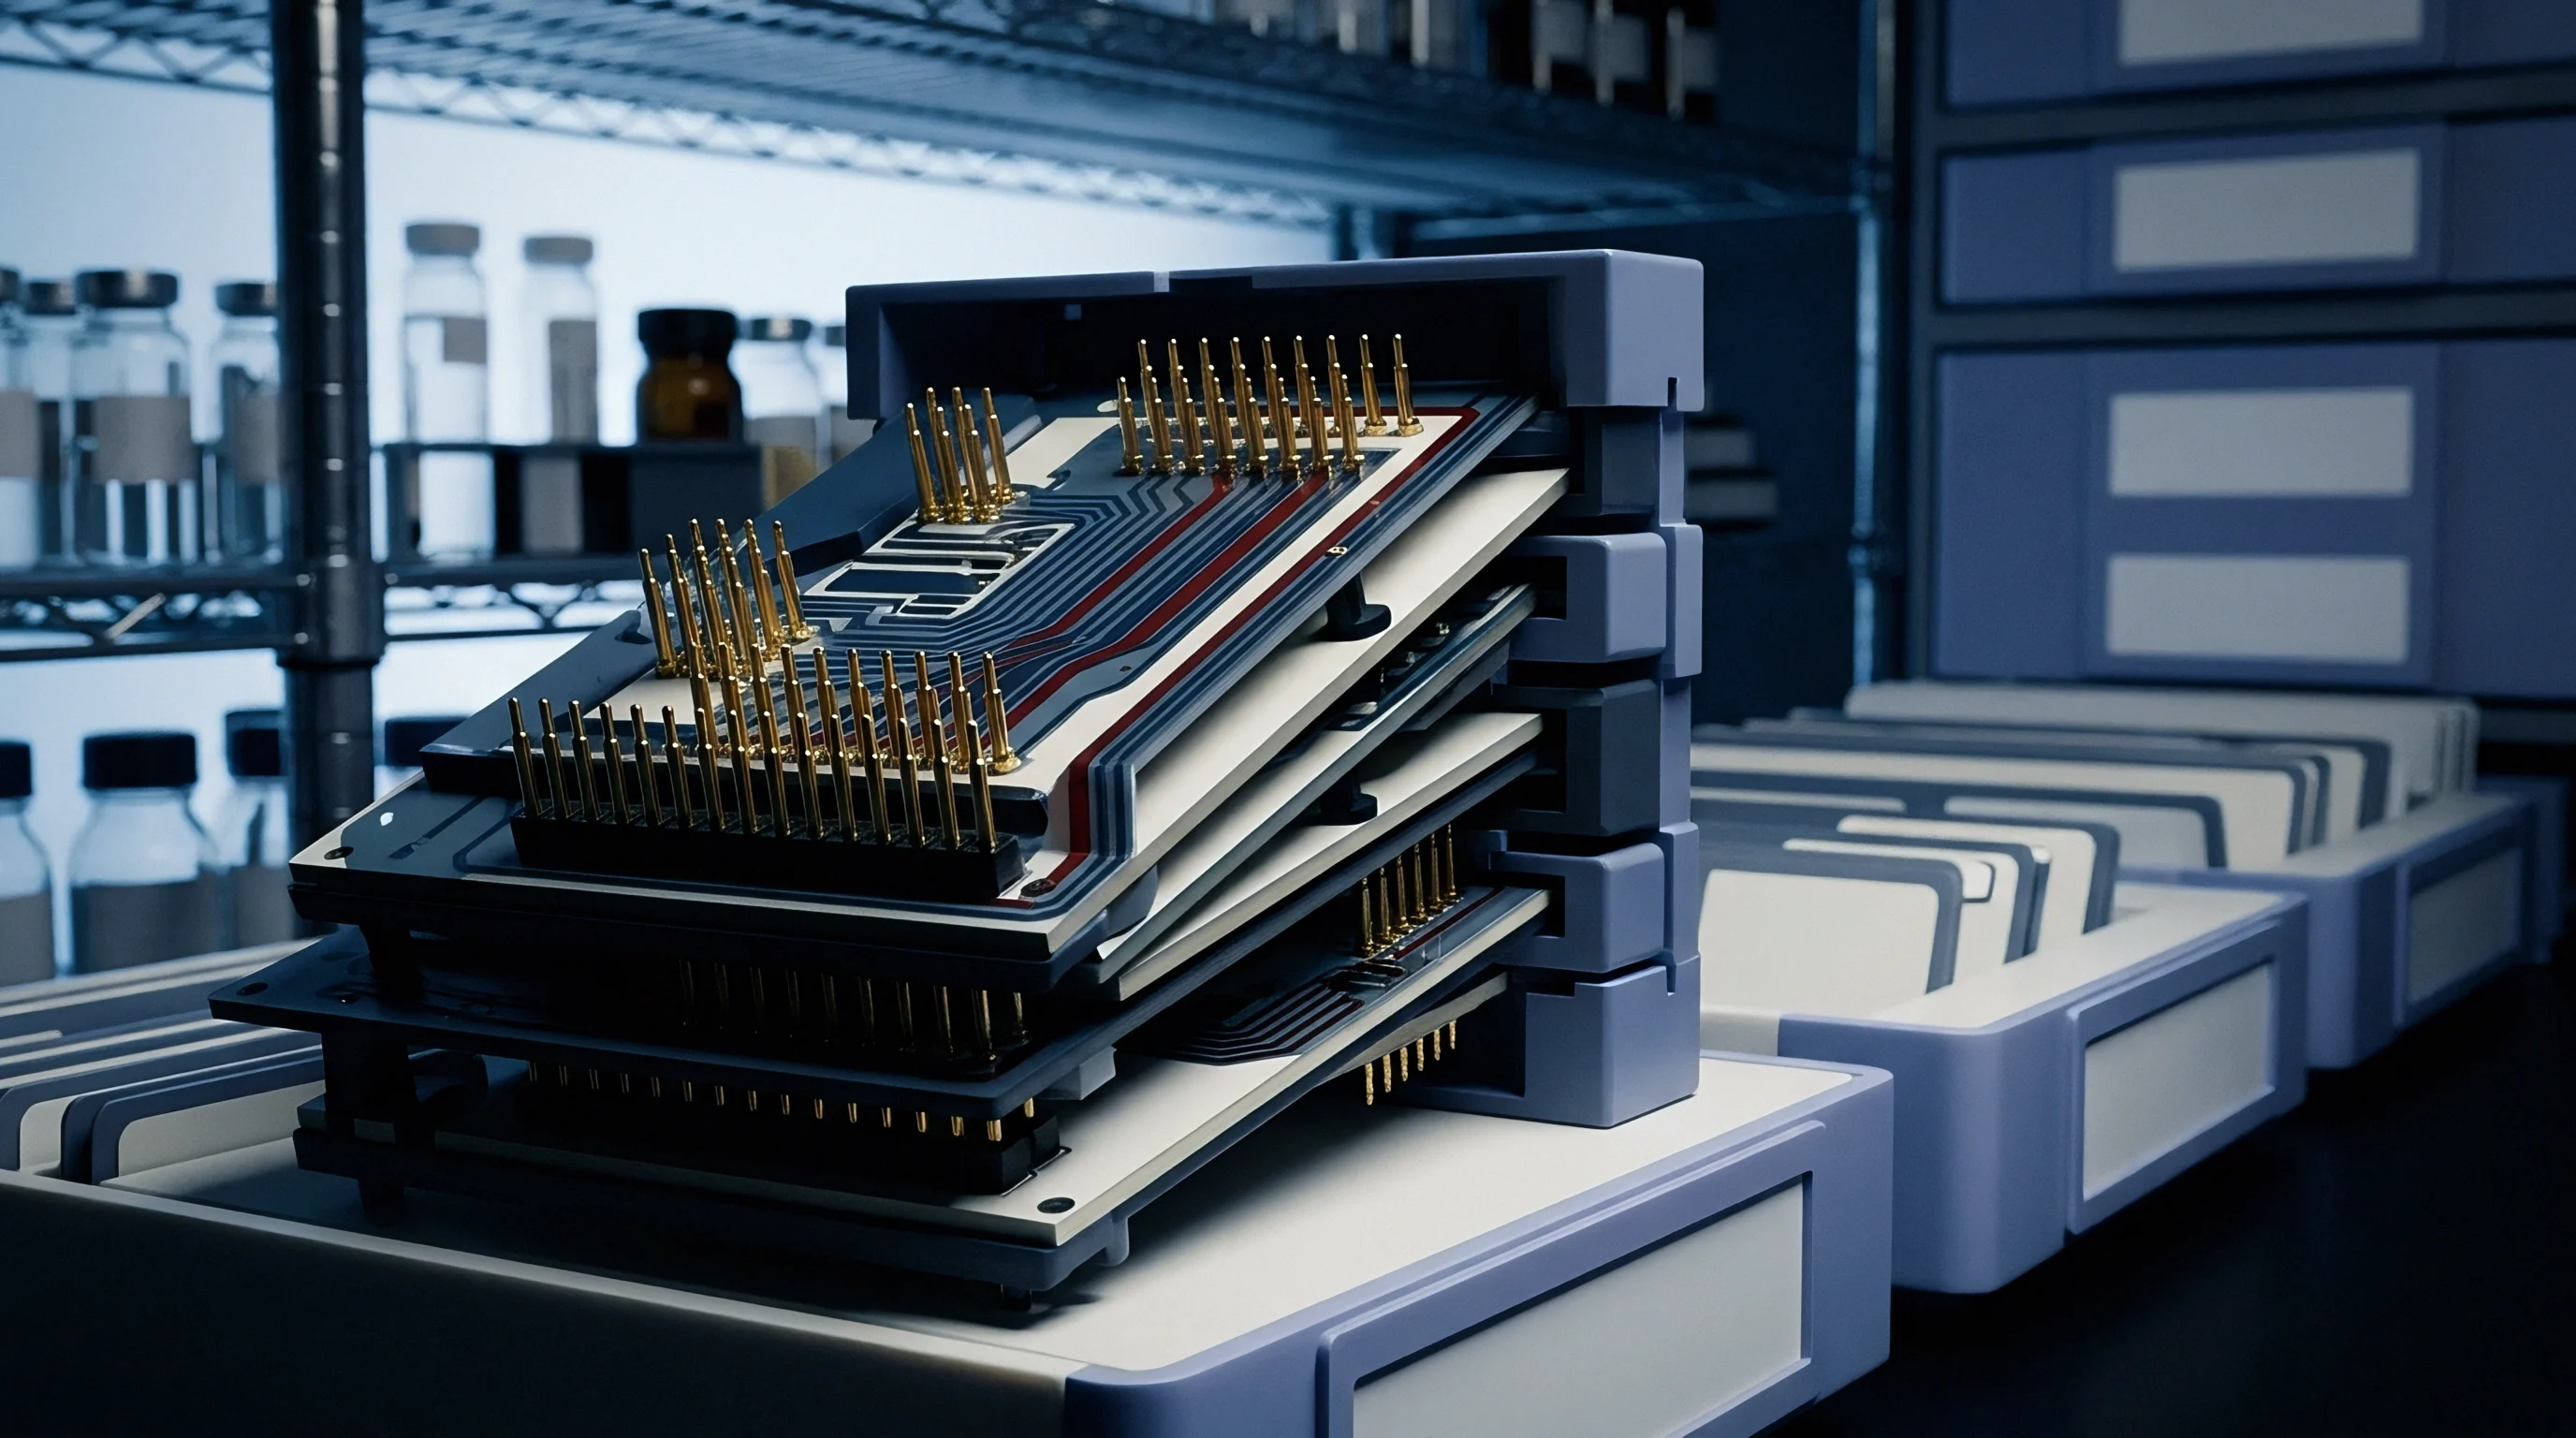
Mechanical loading within automated test equipment originates primarily from the mechanical interface between the fixture bed and the circuit board assembly. Vacuum fixtures rely on atmospheric differential pressure to pull assemblies against spring probes, creating uniform surface pressure across unpopulated zones while concentrating stress along perimeter seals. Pneumatic and mechanical push-bar fixtures concentrate loads at discrete points, using rigid pins to counteract high spring forces exerted by dense bed-of-nails probe fields.
Deflection patterns arise when the force exerted by spring probes does not match the opposing push-pin positions. Single spring-loaded probes exert pin forces between 1.5 Newtons and 3.0 Newtons at full working travel. A fixture containing twelve hundred test points exerts over three kilonewtons of total upward force against the circuit board.
Without precisely aligned under-board support pins and top-side push rods, the assembly acts as a continuous plate under point loads, inducing localized bending moments that peak near rigid mounting points and corner solder joints.
- Install top-side push pins directly opposite high-density spring probe clusters to prevent un-supported cantilever bending.
- Adjust under-board support pin heights to form a true coplanar plane within fifty micrometers across the entire test area.
- Perform zero-force baseline balance calibrations before engaging vacuum draw or pneumatic press cycles.
- Record strain profiles continuously from initial actuation stroke through contact dwell to full mechanical release.
- Inspect push-pin tip materials for wear, deformation, or missing compliant elastomeric caps prior to batch runs.
Uneven mechanical wear on push pins alters localized force distribution over extended manufacturing runs. As elastomeric pin tips harden or steel pins wear down, mechanical travel distances shift, concentrating force onto remaining contact points. The board experiences higher microstrain levels as fixture maintenance intervals elapse.
| Fixture Type | Actuation Method | Typical Probe Density | Dominant Strain Profile | Primary Failure Risk |
|---|---|---|---|---|
| Bed-of-Nails ICT | Vacuum Differential | 15 to 30 probes/cm² | Biaxial membrane tension | Pad cratering under central BGAs |
| High-Density ICT | Pneumatic Top Press | 25 to 50 probes/cm² | Localized flexural bending | Ceramic chip capacitor cracking |
| Functional Module | Manual Gate Clamp | 5 to 15 probes/cm² | Torsional frame twisting | Corner solder ball shear fractures |
| Flying Probe | Direct Motorized Touch | Dynamic Single Probe | High-frequency point impact | Tracer trace lifting near test pads |
Rigid board support design dictates the ultimate safety margin of automated fixtures. Supporting the board close to fragile surface-mount devices limits flexural displacement, keeping local strain within acceptable limits regardless of overall probe counts.
Placing push pins directly over component packages rather than on clear board laminate guarantees rapid structural damage to internal die connections and encapsulation seals.
Algorithm
Raw voltage measurements collected from Wheatstone bridge circuits must be converted into standardized strain metrics to evaluate compliance against IPC/JEDEC 9704A criteria. Strain gauges capture change in electrical resistance proportional to mechanical strain, governed by the gauge factor. For a standard 0°/45°/90° rectangular triaxial rosette, three instantaneous strain channels—designated as epsilon_a, epsilon_b, and epsilon_c—provide the raw data required to resolve the full two-dimensional strain state on the board surface.
Principal strain calculations identify the maximum and minimum normal strain values acting at a given measurement location, independent of gauge orientation. Equations convert raw channel outputs into principal strains epsilon_1 and epsilon_2:
epsilon_1 = (epsilon_a + epsilon_c) / 2 + 0.5 sqrt( (epsilon_a – epsilon_c)^2 + (2 epsilon_b – epsilon_a – epsilon_c)^2 )
epsilon_2 = (epsilon_a + epsilon_c) / 2 – 0.5 sqrt( (epsilon_a – epsilon_c)^2 + (2 epsilon_b – epsilon_a – epsilon_c)^2 )
Maximum shear strain gamma_max is calculated directly from the principal strains:
gamma_max = epsilon_1 – epsilon_2
Strain rate represents the time derivative of principal strain, expressed in microstrain per second. High strain rates reduce the ductility of lead-free solder alloys, causing brittle fractures under lower microstrain magnitudes than would occur under slow quasi-static loading. Modern automated fixtures frequently generate strain rates exceeding fifty thousand microstrain per second during fast pneumatic gate closures.
- Diagonal Strain calculates off-axis strain components along package diagonals to evaluate corner solder joint tear-out risk.
- Maximum Principal Strain tracks peak tensile forces responsible for copper laminate pad cratering under surface mount devices.
- Minimum Principal Strain measures localized compressive forces that cause ceramic die cracking and solder bridge shorts.
- Instantaneous Strain Rate captures the velocity of mechanical deformation to determine dynamic brittleness limits of SAC solder joints.
IPC/JEDEC 9704A provides allowable strain limits formatted as a function of strain rate and printed circuit board thickness. Consider a standard 1.6 mm thick FR4 board assembled with SnAgCu (SAC) solder. At low strain rates below 100 microstrain per second, the maximum allowable principal strain limit stands at 1000 microstrain.
When pneumatic fixture actuation increases the strain rate to 10,000 microstrain per second, the allowable threshold drops to 500 microstrain.
Consider a practical calculation involving a BGA corner rosette during automated fixture press-down. The three gauge channels report instantaneous strains of epsilon_a = 450 microstrain, epsilon_b = 200 microstrain, and epsilon_c = -150 microstrain. The mean normal strain yields 150 microstrain.
The radical term evaluates to 0.5 sqrt( 600^2 + (400 – 450 + 150)^2 ), resolving to 316.2 microstrain. The calculated principal strains are epsilon_1 = 466.2 microstrain and epsilon_2 = -166.2 microstrain. The maximum shear strain equals 632.4 microstrain.
If this deformation occurs over a timeframe of 5 milliseconds, the calculated strain rate reaches 93,240 microstrain per second, exceeding the allowable IPC limit for SAC solder on a 1.6 mm board and triggering a mandatory fixture design modification.
Brittle solder fracture risk increases dramatically when fixture actuation speed elevates localized strain rates above ten thousand microstrain per second.
Ignoring strain rate dependencies during fixture qualification allows destructive high-velocity contact transients to pass safety checks while systematically degrading product reliability.
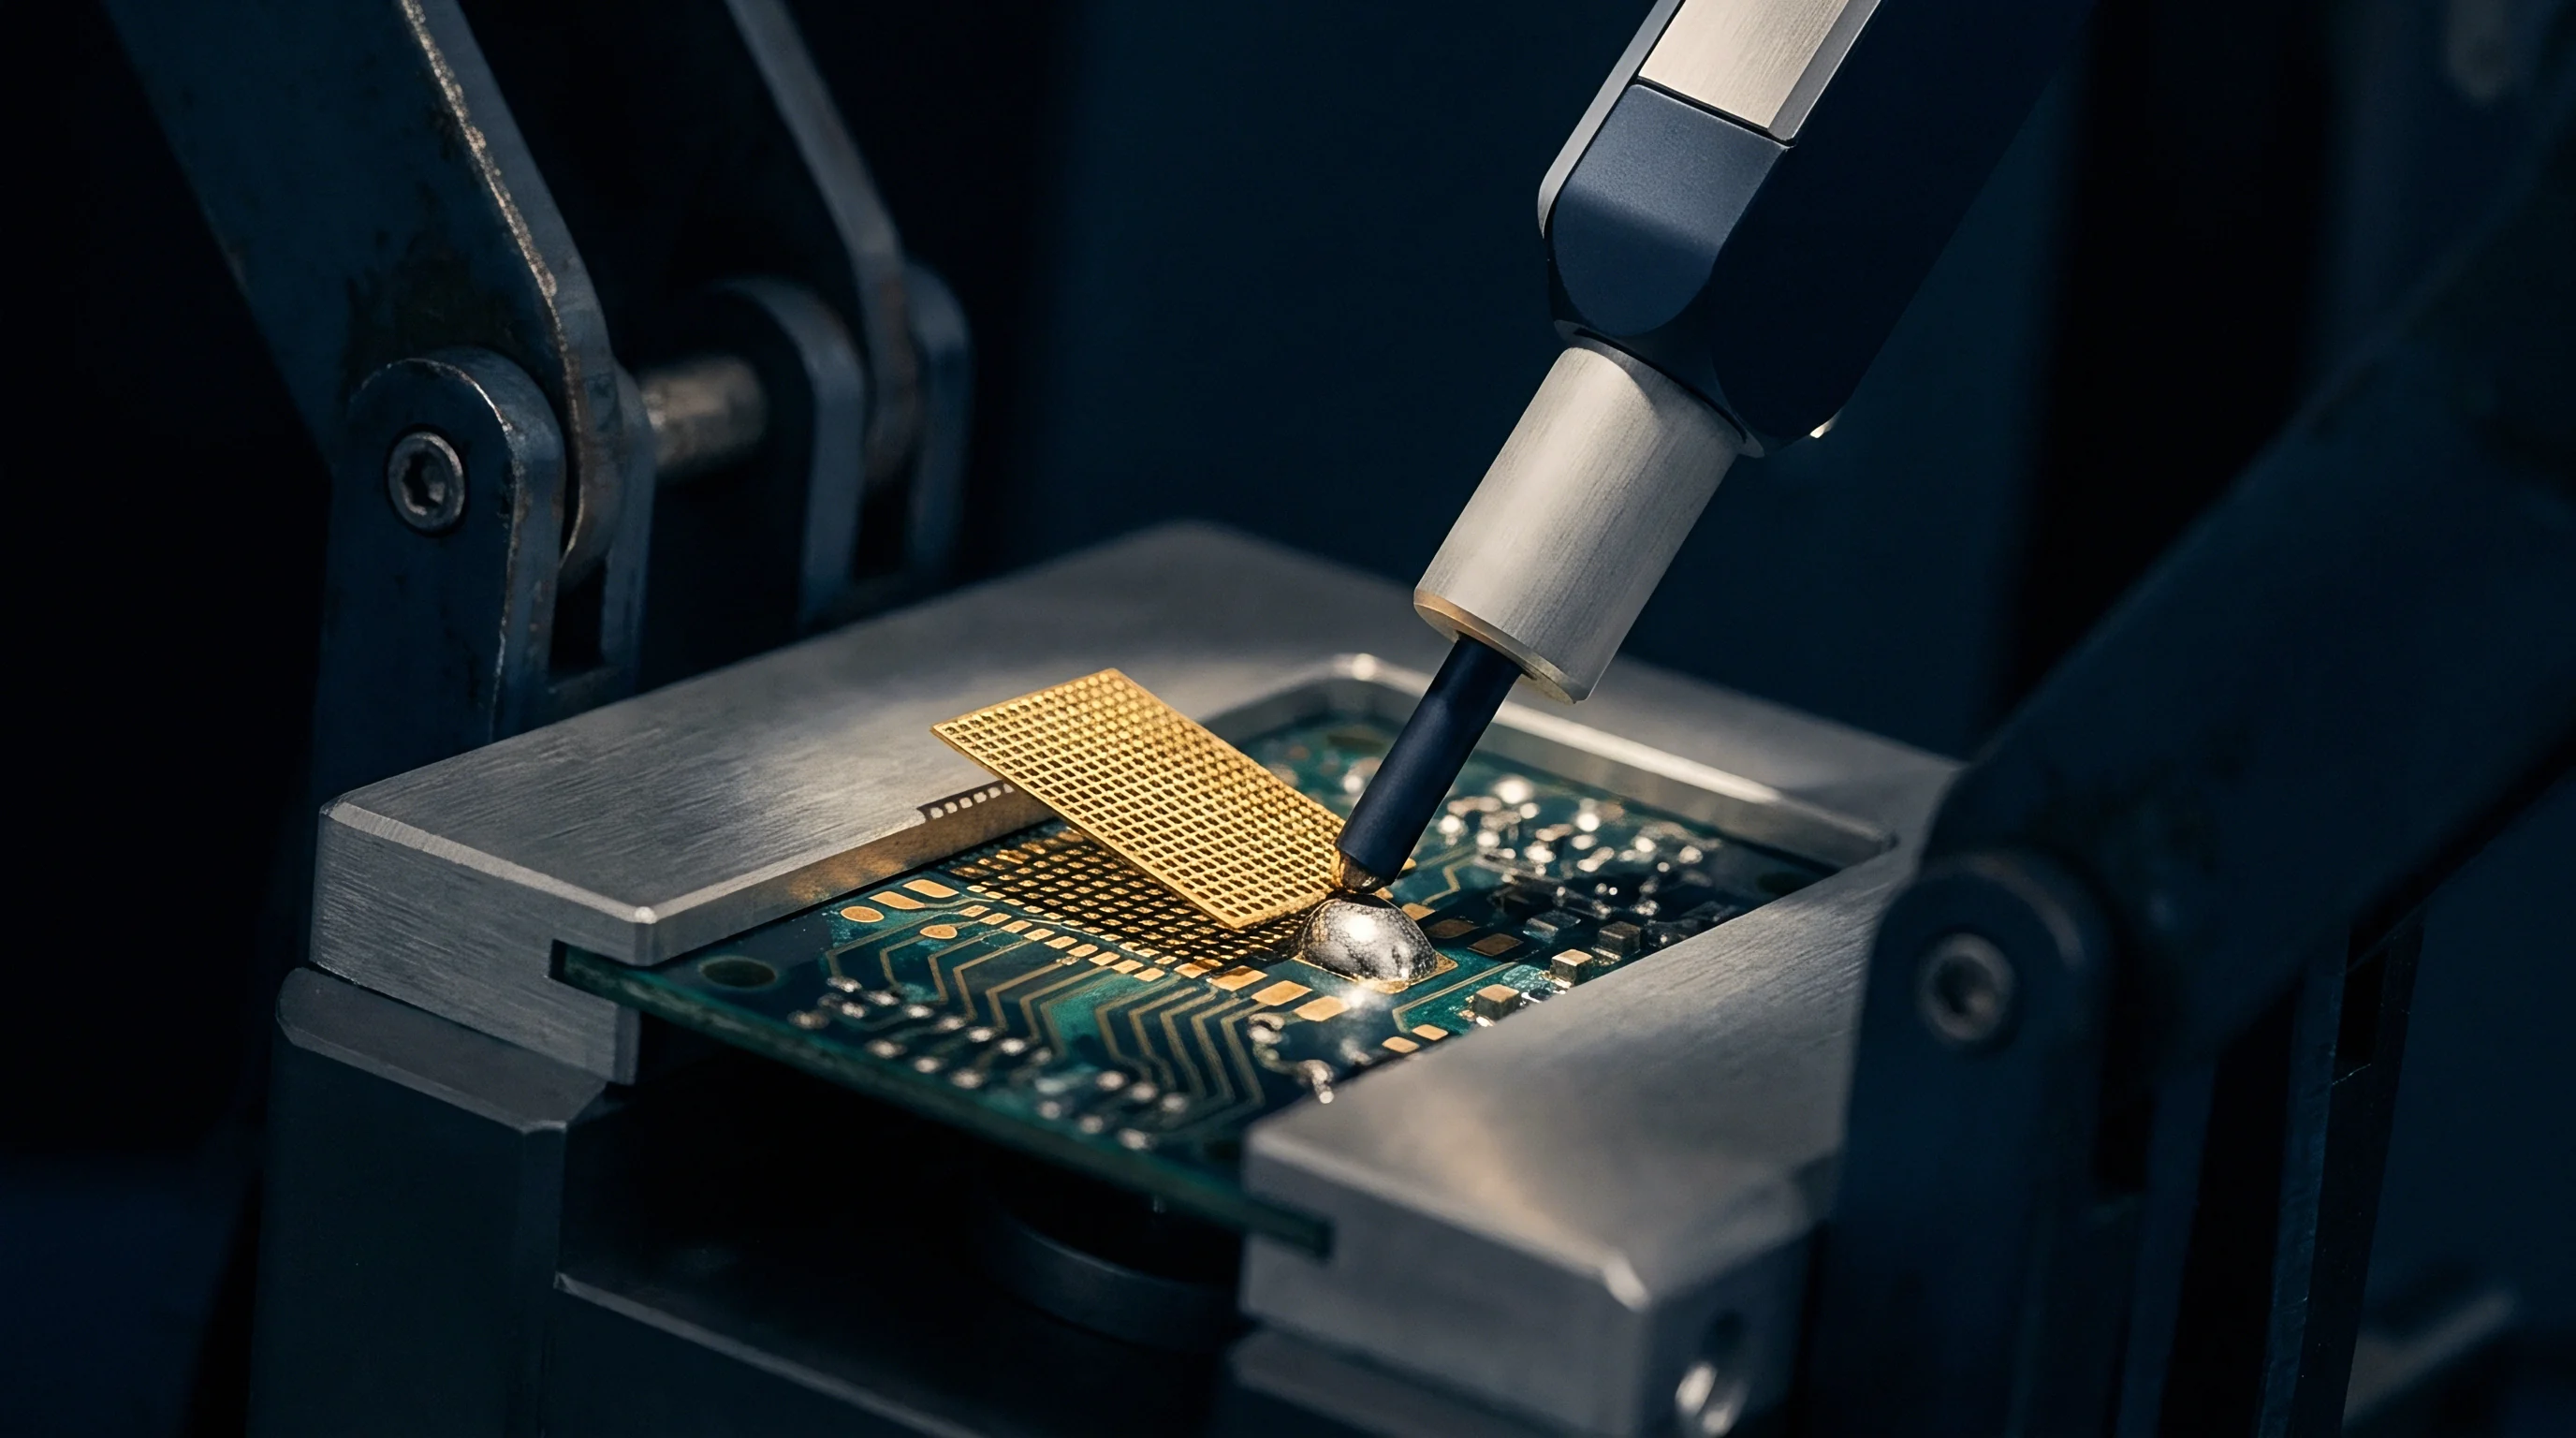
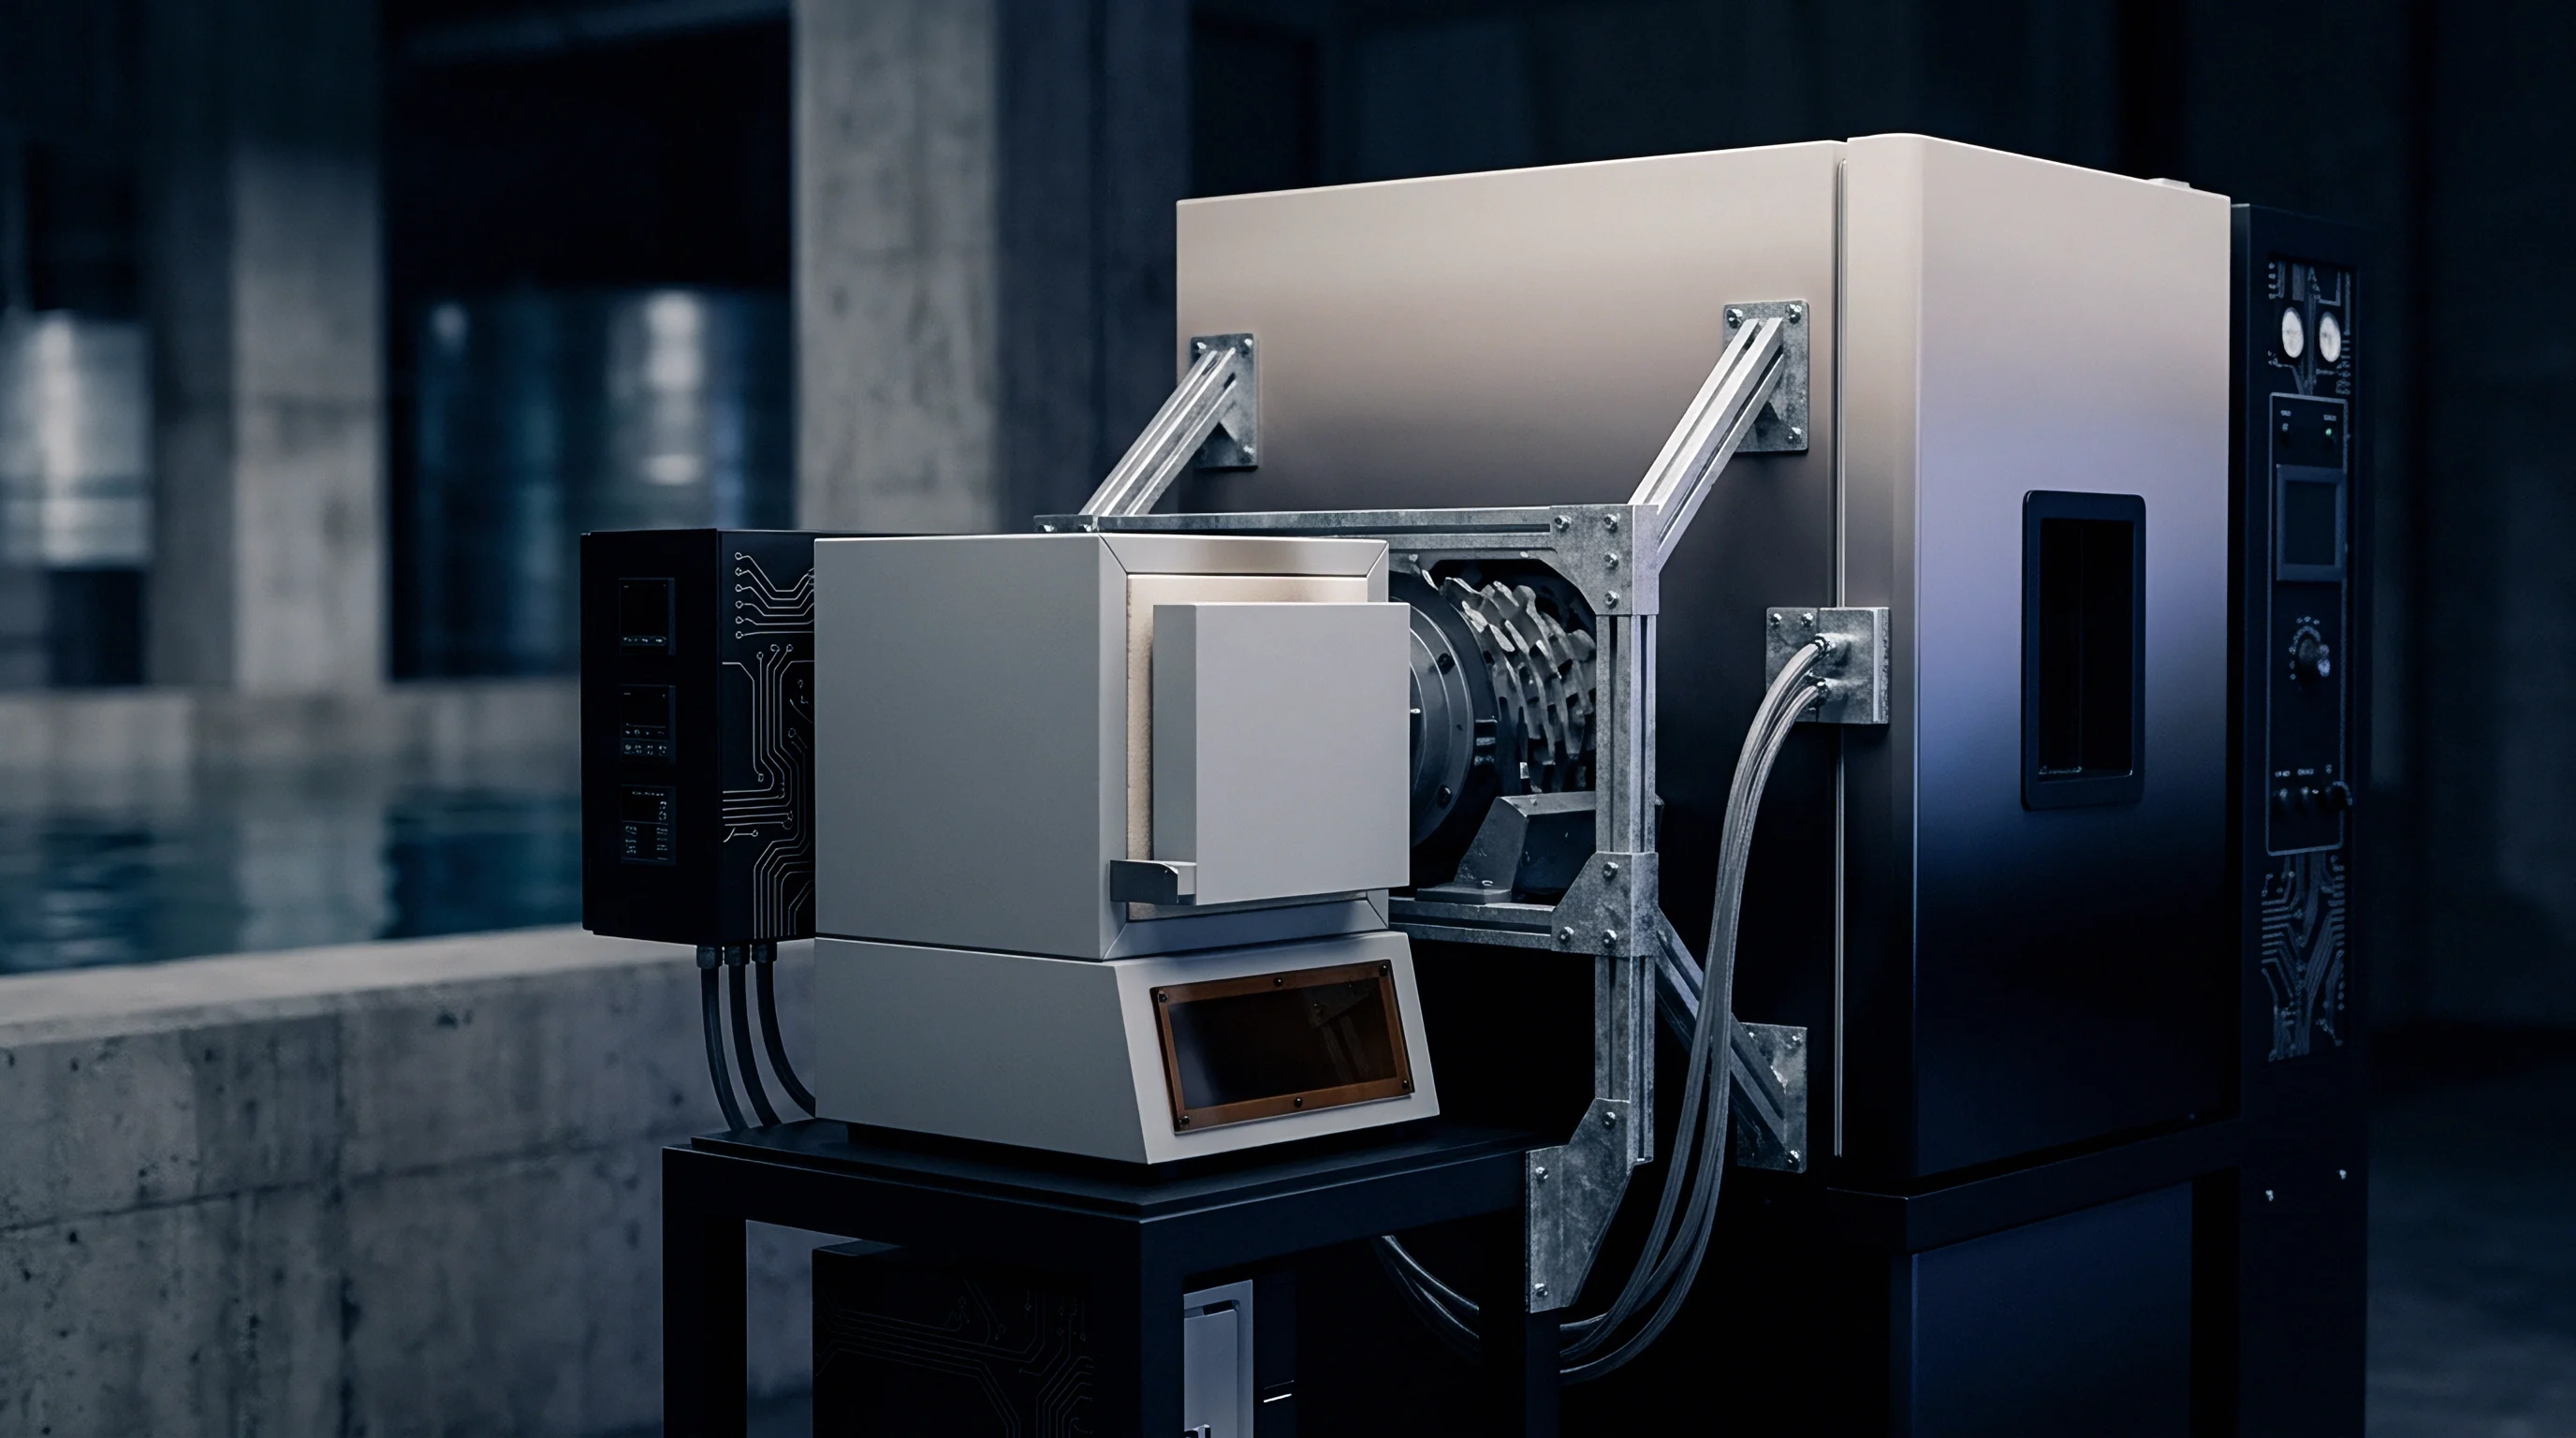
Rig
Data acquisition hardware employed for IPC/JEDEC 9704A testing must meet high-speed real-time performance standards to capture microsecond dynamic events. Automated fixtures driven by pneumatic cylinders generate rapid mechanical shock waves upon initial probe engagement. Standard static strain indicators or low-frequency bench meters alias these transient peaks, smoothing out short-duration strain spikes that break brittle copper-to-resin bonds.
Signal conditioning bridges require high bandwidth amplifier electronics and dynamic analog-to-digital converters. Bridge excitation voltages must remain stable within 0.05 percent under varying lead wire resistance. Quarter-bridge configurations require precise precision completion resistors rated to 0.1 percent accuracy with low thermal temperature coefficients.
Dynamic sampling rates of at least 10 kHz per channel are mandatory, with high-speed automated lines requiring up to 100 kHz continuous simultaneous sampling.

Why Do Solder Joints Cracking under ICT Loading Escape Electrical Screening?
Microcracks induced in BGA solder balls during fixture press cycles often maintain mechanical contact while under probe pressure. The upward thrust of spring probes forces broken solder joint surfaces together, preserving continuous electrical contact throughout the test routine. Once the board releases from the fixture, internal elastic rebound pulls the cracked interfaces apart, creating an open circuit that surfaces only after thermal cycling in the field.
| Test Phase | Minimum Sampling Rate | Analog Filter Cutoff | Bridge Excitation | Target Dynamic Event |
|---|---|---|---|---|
| Fixture Actuation Press | 50 kHz | 10 kHz Low-Pass | 2.0 V to 3.0 V DC | Pneumatic impact transient spikes |
| Vacuum Pull-Down | 10 kHz | 2 kHz Low-Pass | 2.0 V DC | Continuous vacuum flexure ramp |
| Push-Rod Dwell State | 1 kHz | 500 Hz Low-Pass | 2.0 V DC | Static probe force displacement |
| Fixture Release Stroke | 50 kHz | 10 kHz Low-Pass | 2.0 V to 3.0 V DC | Elastic spring back rebound acceleration |
Shielded twisted-pair cabling prevents electromagnetic interference generated by automated motor drives, solenoid valves, and power switching supplies from corrupting strain channels. Cable runs must be anchored securely to prevent triboelectric noise caused by physical wire motion during fixture operation. Ground loops between the strain measurement acquisition chassis and the automated test equipment frame ruin low-level strain signals, necessitating isolation transformers or differential optical isolation bridges.
Compliance with IPC/JEDEC 9704A demands continuous high-speed data acquisition capable of recording strain transients without amplitude attenuation or phase distortion.
Paraphrasing standard test-house defenses, fixture suppliers frequently claim that high strain readings represent localized electrical noise artifacts rather than true physical board flexure, attempting to bypass fixture rework mandates without conducting re-calibration sweeps.
Validation
Fixture qualification protocols demand rigorous verification procedures before releasing automated test tooling to the factory floor. Gage Repeatability and Reproducibility studies assess measurement system variability, ensuring that strain variations stem from physical board flexure rather than measurement error. A qualified strain measurement system must achieve a Gage R&R percentage below ten percent of the specified IPC strain threshold.
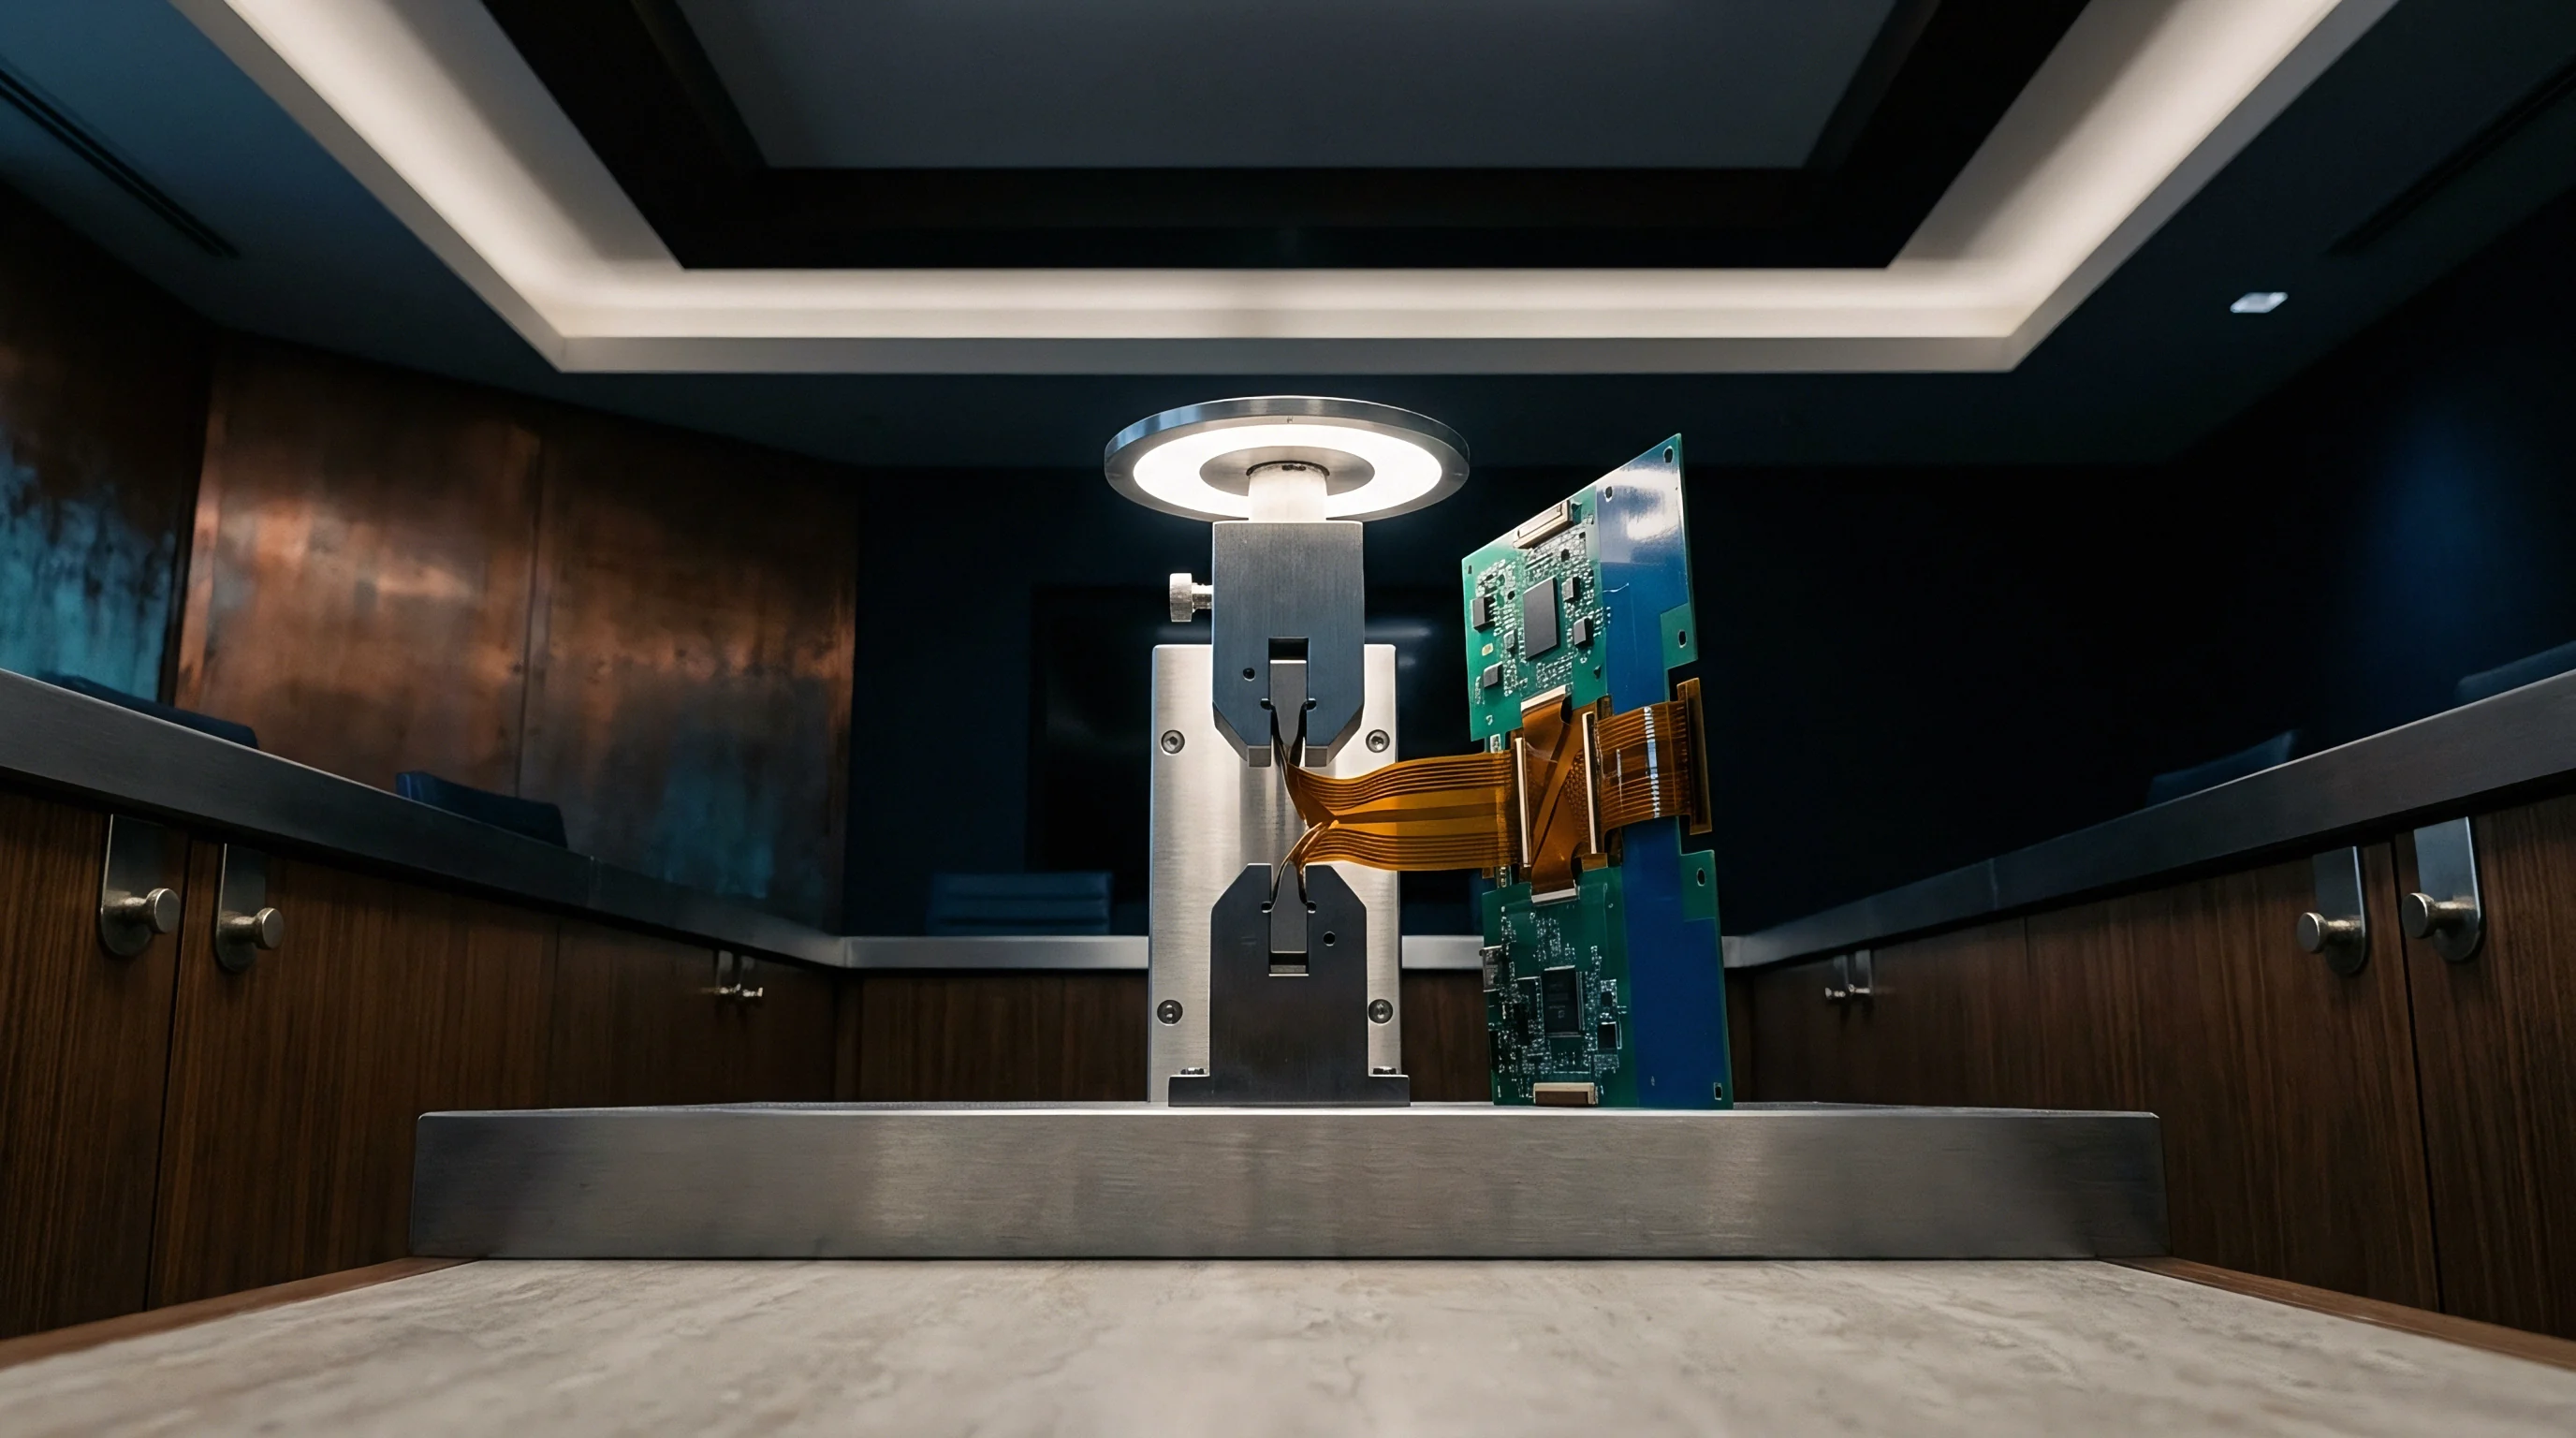
Validating an automated test fixture involves testing across three distinct operating conditions: nominal fixture press cycles, worst-case mechanical misalignment configurations, and maximum operating speed sweeps. Test engineers attach fully instrumented strain gauge boards—termed strain mapping coupons—built from production-grade printed circuit assemblies. These coupons undergo multiple actuation cycles to evaluate force uniformity across all probe clusters and support pin locations.
- Intermittent Electrical Opens caused by partial tearing of internal copper trace structures during mechanical press strokes.
- Laminate Pad Cratering resulting from high tensile stress pulling copper land pads directly away from glass-epoxy resins.
- Ceramic Element Cracks in multi-layer surface mount capacitors induced by high flexural strain gradients near edge connectors.
- BGA Solder Joint Fracture occurring at the interface between the package substrate ball pad and the bulk solder sphere.
Fixture maintenance schedule rules enforce periodic strain re-mapping to prevent mechanical wear from compromising board integrity. Over time, spring probes lose stiffness, elastomeric push-rod tips degrade, and mechanical guide pins develop slop. Regular validation intervals catch these wear patterns before latent defects enter high-volume production streams.
- Verify coplanarity of all push-pin contact points using optical height gauge measurement tools.
- Measure total mechanical probe force across all test pins using calibrated load cell array plates.
- Execute high-speed strain mapping using an instrumented IPC/JEDEC 9704A gauge coupon.
- Compare calculated principal strain and strain rate values against specified component limits.
- Document signed qualification reports into the permanent factory engineering quality management file.
Systematic fixture qualification prevents un-mapped mechanical stress profiles from causing un-traceable field returns.
Paragraph 5.3 of IPC-9702 specifies that any engineering change made to fixture push-pin locations, probe density, or mechanical actuation speed voids previous strain qualification records and mandates immediate complete re-measurement of peak board strain profiles.
Ledger
Managing mechanical strain compliance in automated test fixtures carries immediate financial consequences across electronics contract manufacturing operations. Uncontrolled board strain leads to latent component degradation, producing yield losses that surface after assembly, during environmental stress screening, or within warranty service windows. Establishing rigorous IPC/JEDEC 9704A strain measurement protocols protects factory operating margins by shifting structural defect detection to the earliest stages of production setup.
Commercial contracts between original equipment manufacturers and electronics manufacturing services partners specify explicit strain limit boundaries. Non-compliance charges for field returns traced to mechanical pad cratering include full scrap unit costs, re-test labor fees, and logistical recall expenses. Investing in comprehensive strain mapping during fixture development costs a small fraction of a single production batch recall.
| Strategy Level | Initial Fixture Cost | Qualification Time | Latent Defect Exposure | Estimated Field Return Rate |
|---|---|---|---|---|
| Unverified Standard Fixture | Baseline | 0 Hours | Extreme risk of pad cratering | 1.5% to 3.0% of shipped units |
| Static Mechanical Load Check | +10 Percent | 4 Hours | Moderate transient strain risk | 0.5% to 1.2% of shipped units |
| Full IPC/JEDEC 9704A Qualification | +25 Percent | 16 Hours | Controlled strain boundaries | Below 0.02% of shipped units |
Production line sign-off procedures mandate archiving complete strain measurement dossiers for every operational fixture. The technical dossier must contain raw strain-time channel traces, calculated principal strain figures, strain rate metrics, gauge placement photos, and calibration certificates for all acquisition hardware. These records serve as technical proof during quality audit reviews and warranty dispute arbitrations.
Integrating IPC/JEDEC 9704A strain measurement methods into standard automated test fixture procurement workflows establishes verifiable quality gates. Engineering teams verify push-pin forces, validate support structures, enforce maximum strain limits, and document mechanical compliance. This disciplined operational approach eliminates latent mechanical defects, stabilizes manufacturing yields, and guarantees structural board integrity throughout high-volume electronics assembly programs.