Anisotropic Permittivity Characterization Methods for High Density Packaging Laminates
Anisotropic permittivity characterization isolates out of plane dielectric constants from in plane vectors to prevent high speed trace impedance mismatch.

Tensor
In high-density packaging laminates, dielectric behavior operates as an orthotropic tensor rather than a single scalar value. Because glass fibers along the warp and weft directions carry higher permittivity than the surrounding organic resin, in-plane values exceed out-of-plane values across the thickness dimension. As a result, high-speed differential traces on outer redistribution layers see effective dielectric constants distinct from those affecting vertical microvias in thin core dielectrics.
Field orientation relative to the reinforcement glass ultimately dictates propagation velocity, characteristic impedance, and coupling capacitance across the interconnect stackup.
High-density substrate packaging pairs ultra-thin dielectric cores (12 to 50 micrometers) with buildup films and reinforced prepregs. Standard single-frequency datasheet values ignore directional field orientation, which can introduce impedance offsets up to eight percent on tight-tolerance differential pairs. Extracting both in-plane and out-of-plane dielectric components provides the accurate field-solver parameters needed for signal integrity modeling before panel artwork goes to production tooling.
Relative permittivity measured along the thickness vector drops five to twelve percent below in-plane values across woven glass reinforced packaging dielectrics at ten gigahertz.
Anisotropy ratios vary by laminate grade based on resin content, glass style, and pressing pressure during substrate lamination. Spread-glass styles like 1035, 106, and 1078 alter resin distribution, shifting the balance between axial and transverse permittivity. Unreinforced materials such as silica-filled polyimide or bis-maleimide triazine resin films show less directional variation than woven E-glass or NE-glass, though residual molecular orientation during casting still creates measurable orthotropic differences.
Ignoring orthotropic dielectric properties during stackup design causes predictable signal integrity degradation in advanced packaging assemblies.
- Impedance Skew shifts single-ended and differential trace characteristic impedance away from target field solver values when relying on incorrect thickness-axis dielectric constants.
- Resonance Drift alters phase velocity and spatial wavelength in stripline resonators, shifting filter passbands and antenna center frequencies in millimeter-wave packages.
- Crosstalk Miscalculation underestimates lateral capacitive coupling between dense parallel traces whenever in-plane permittivity exceeds bulk datasheet values.
- Timing Jitter creates propagation delay variations between signal layers built with different glass-to-resin ratios across the packaging stackup.
Glass weave geometry ultimately sets the physical boundaries for directional permittivity.
Cavity
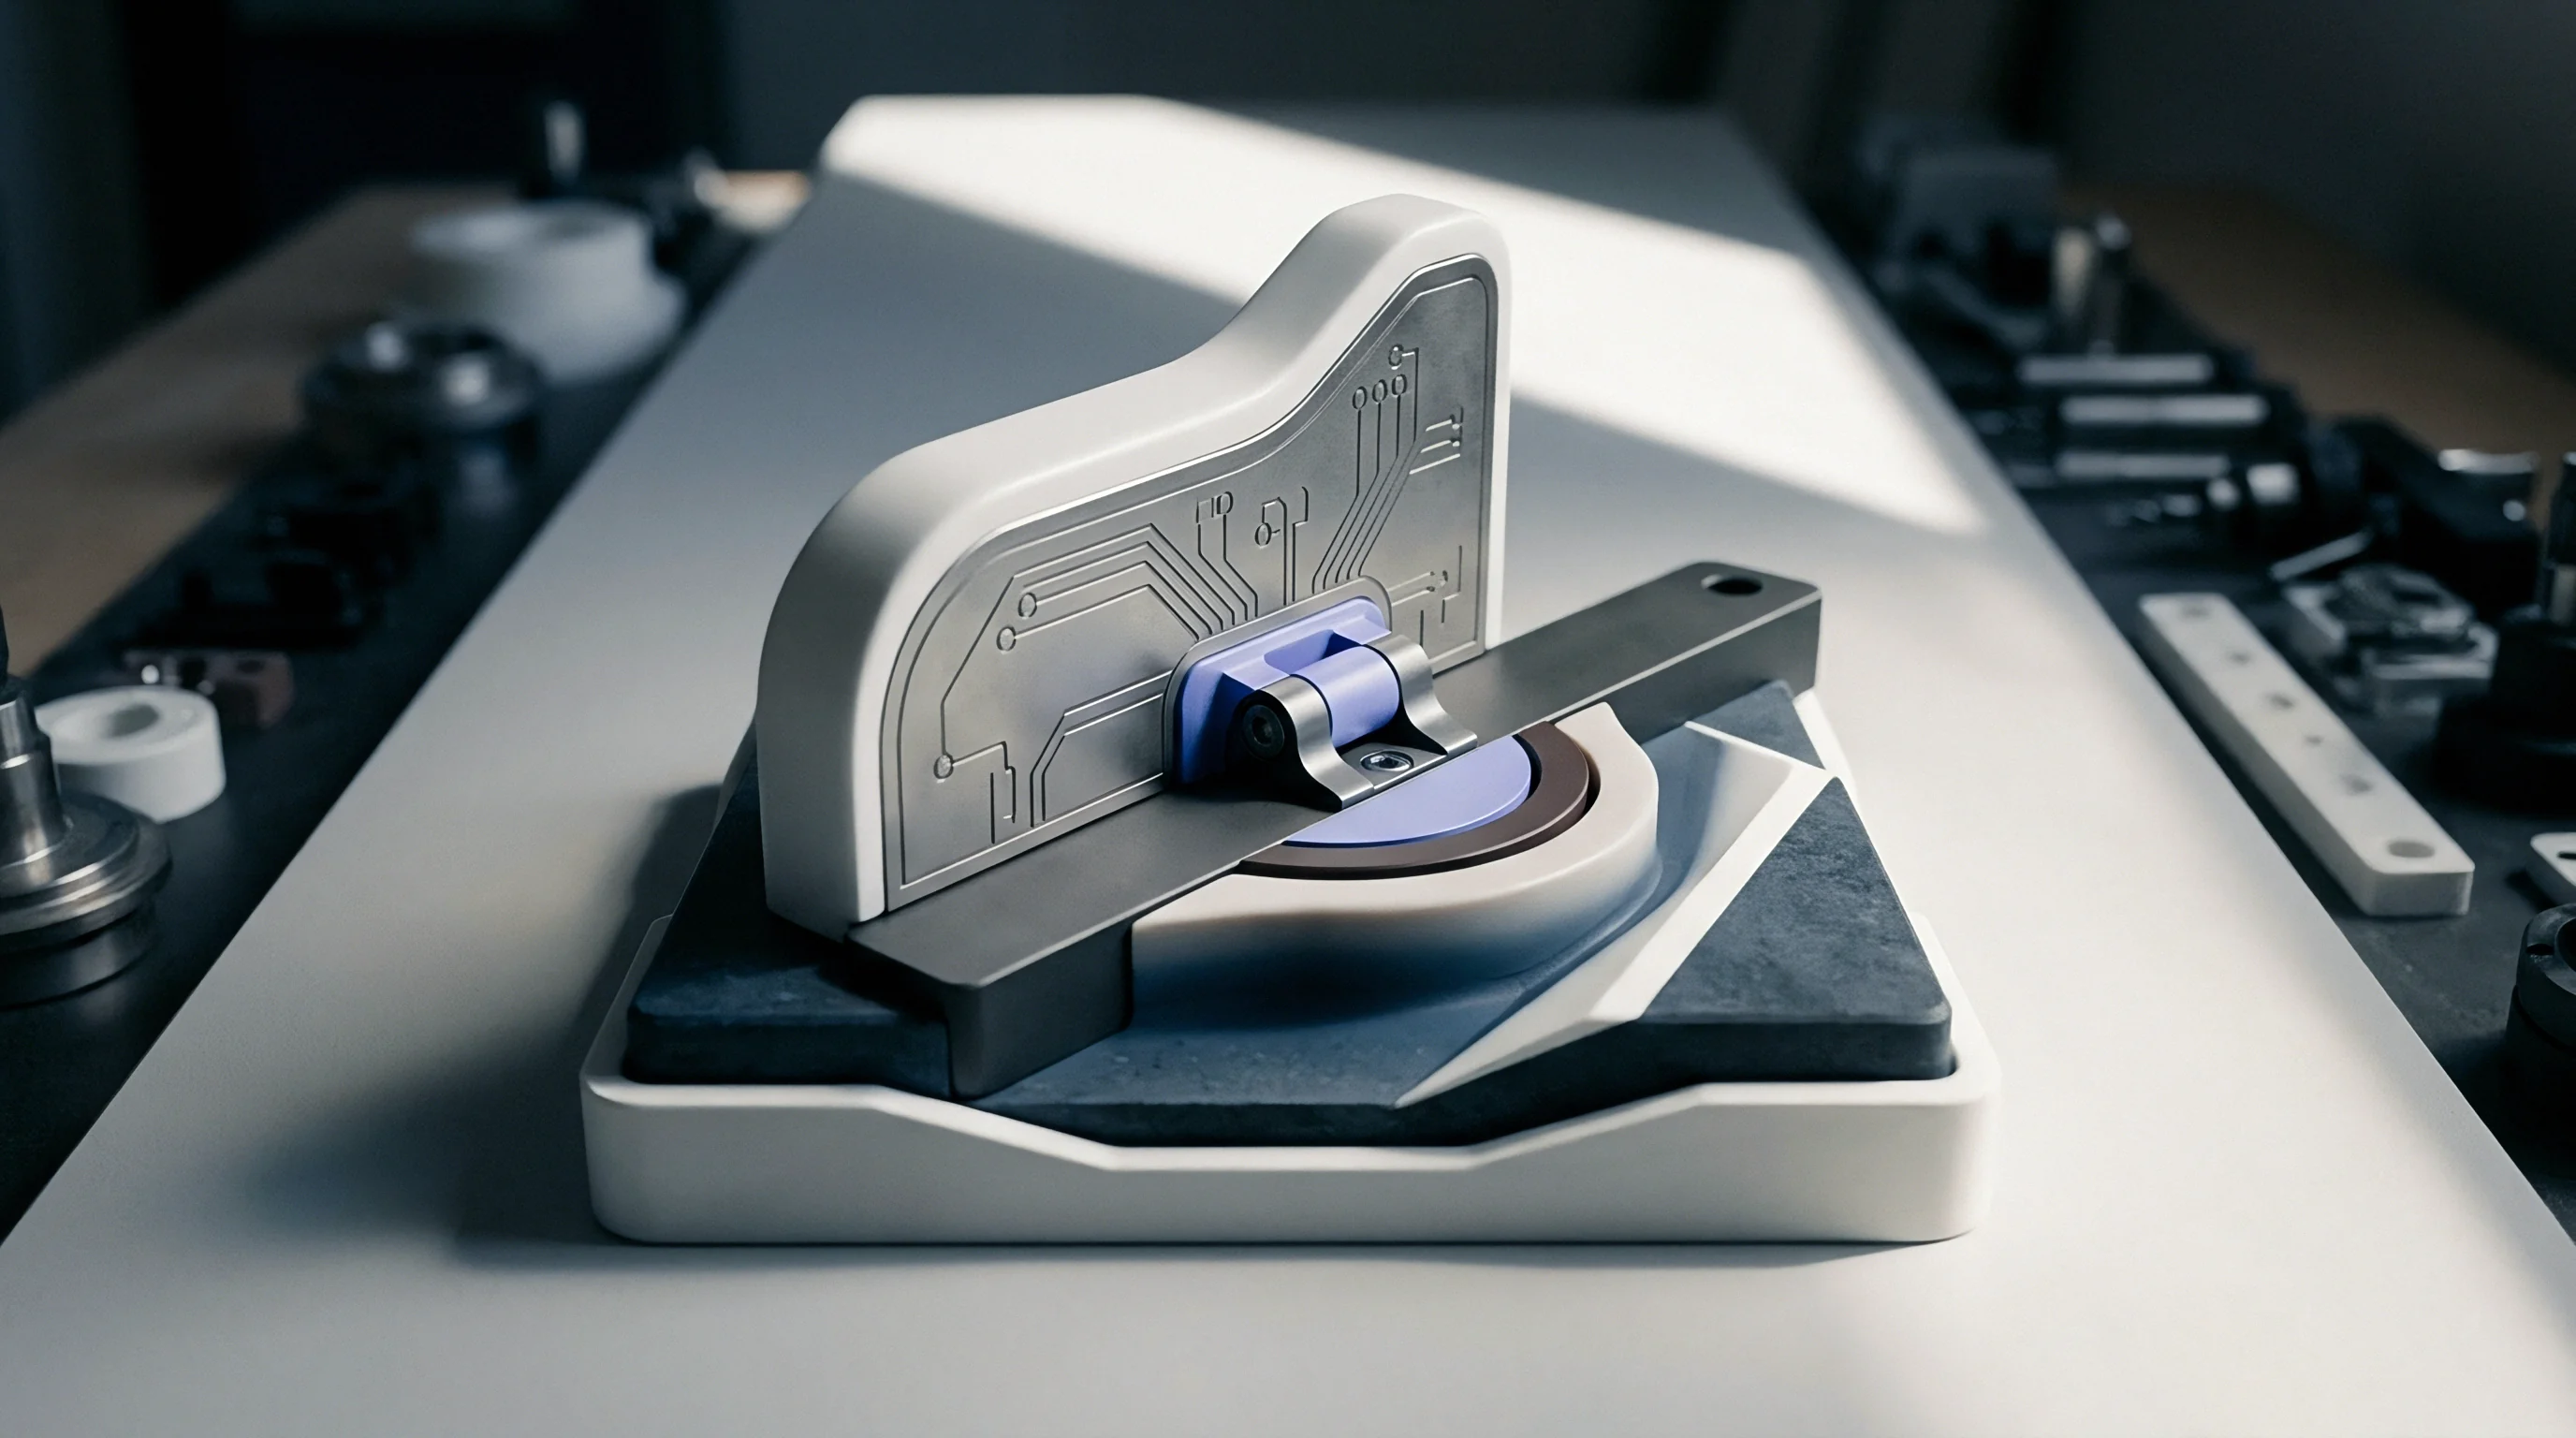
Resonant fixtures extract dielectric properties by tracking frequency shifts and quality-factor changes inside a bounded cavity. Placing unclad laminate samples in high-Q resonant enclosures isolates specific permittivity tensor components according to the cavity’s spatial field pattern. Devices like split-post dielectric resonators and circular disk resonators generate uniform electromagnetic fields that isolate in-plane or out-of-plane vectors without metallized contacts.
Resonant Extraction Mechanisms
Split-post dielectric resonators operating between one and twenty gigahertz generate electric fields parallel to the sample surface, isolating the in-plane dielectric constant and loss tangent. Clamped stripline and circular disk resonators orient fields perpendicular to the sheet to capture out-of-plane performance instead. Precision micrometer drives control gap dimensions, preventing air-gap capacitance errors that would otherwise distort high-frequency loss measurements.
| Fixture Architecture | Frequency Band | Target Vector | Sample Thickness | Permittivity Uncertainty |
|---|---|---|---|---|
| Split-Post Dielectric Resonator | 1.1 GHz – 15 GHz | In-Plane | 0.05 mm – 1.0 mm | ± 0.5% |
| Balanced Circular Disk Resonator | 5 GHz – 40 GHz | Out-of-Plane | 0.1 mm – 0.8 mm | ± 0.8% |
| Split-Cylinder Resonator | 10 GHz – 80 GHz | In-Plane | 0.02 mm – 0.5 mm | ± 1.0% |
| Fabry-Perot Open Resonator | 20 GHz – 110 GHz | In-Plane | 0.1 mm – 2.0 mm | ± 1.2% |
Split-cylinder cavity methods align with standardized test procedures like IPC-TM-650 Method 2.5.5.13 for high-frequency evaluation. Machining copper enclosure walls to tight tolerances keeps quality factors above 10,000, which allows measurement of loss tangents down to 0.0005. Because sample placement is non-destructive, raw laminate sheets can be characterized prior to lamination without etching artifacts.
IPC-TM-650 test methods specify clamped sample fixtures to extract out-of-plane permittivity figures under controlled compressive force.
Getting accurate resonant measurements requires adhering strictly to sample preparation steps:
- Etch all outer copper cladding from the laminate sample using a temperature-controlled ferric chloride or cupric chloride chemical bath.
- Bake the unclad substrate at 105 degrees Celsius for two hours to remove absorbed moisture before testing.
- Measure sample thickness across a nine-point grid using a digital micrometer calibrated to within 0.5 micrometers.
- Insert the unclad specimen into the fixture gap and seal the housing to block ambient air currents.
- Record the empty and loaded cavity resonant frequencies on a calibrated vector network analyzer.
- Calculate the in-plane dielectric constant using transcendental field equations derived from boundary conditions.
Laminate vendors often cite clamped-stripline results as bulk dielectric performance, omitting air-gap interface losses that artificially lower the reported loss tangent.

Fixture
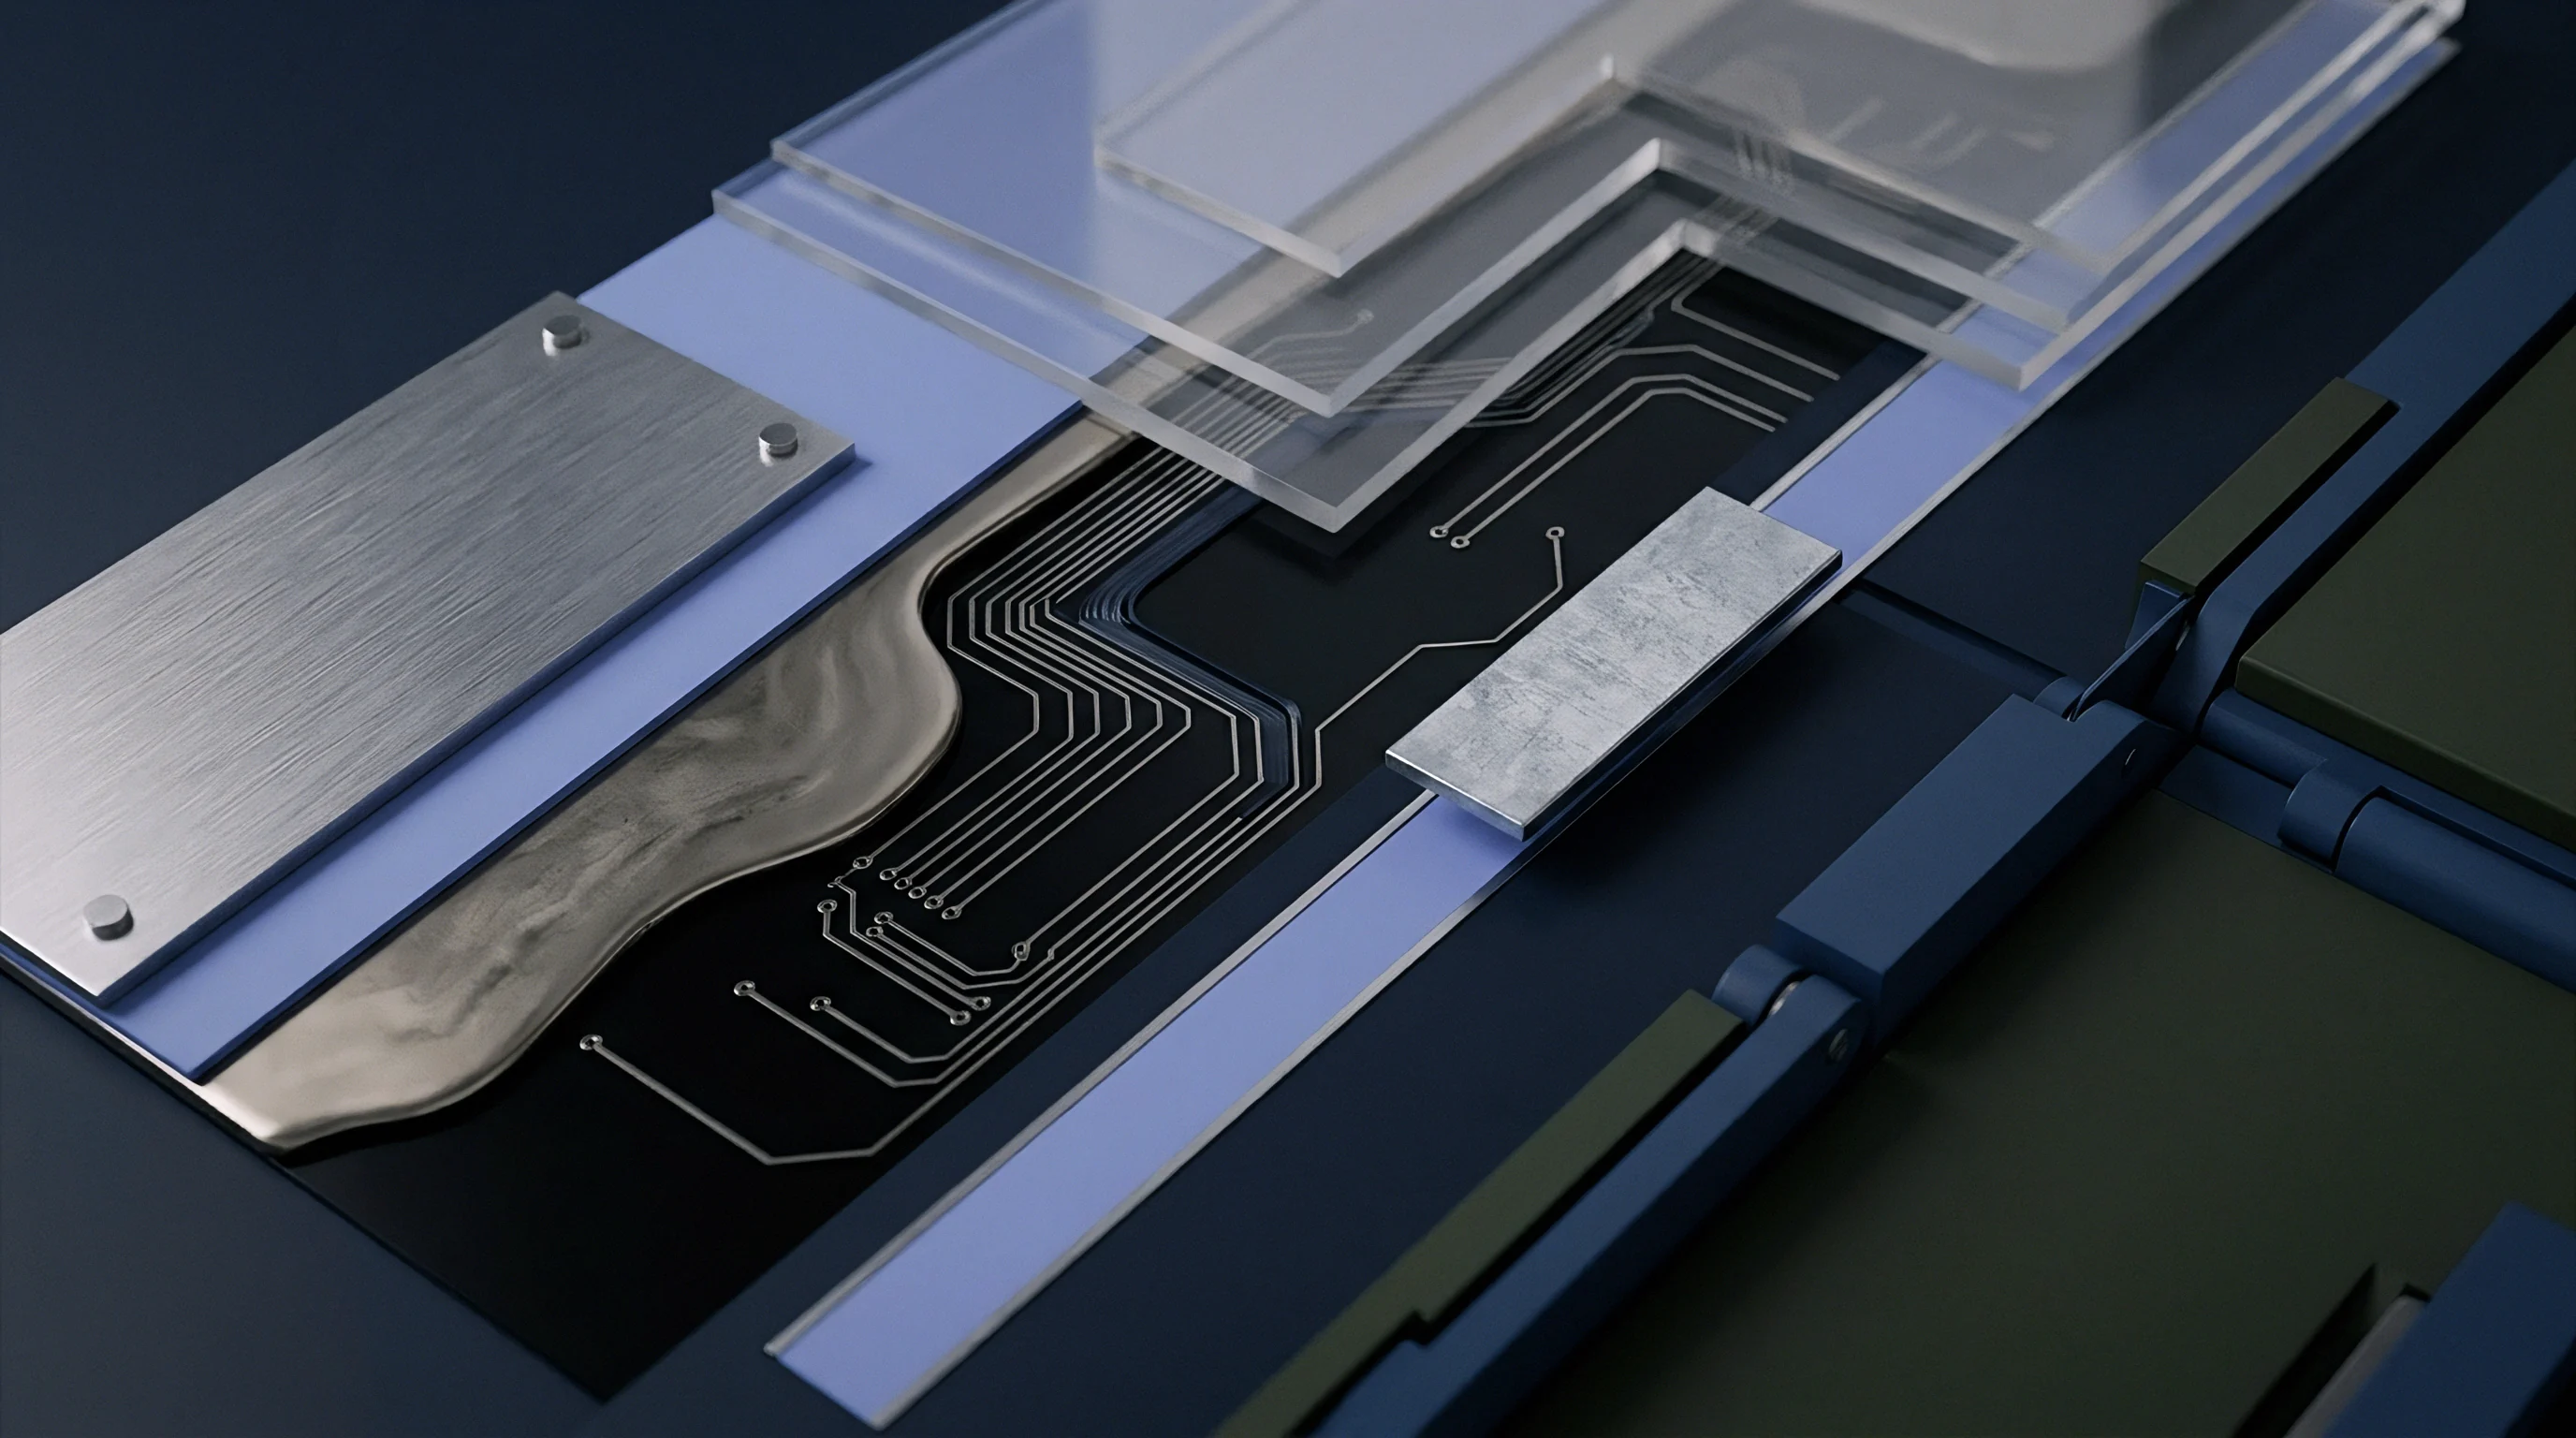
Planar circuit extraction uses active transmission lines to measure anisotropic dielectric behavior under realistic trace geometries. Microstrip ring resonators, stripline differential pairs, and line-reflect-line calibration structures fabricated on actual substrate panels mirror production processing. Broadband frequency-domain testing captures continuous dielectric dispersion and loss from megahertz frequencies up to 110 gigahertz mmWave bands.
Which Characterization Technique Prevents Mmwave Phase Velocity Errors?
Differential phase-length testing on multiline line-reflect-line stripline coupons isolates the thickness-axis dielectric constant over continuous frequencies. Comparing phase delay between two stripline traces of different lengths removes coaxial launcher reflections and end-effect discontinuities from propagation calculations. This yields an effective dielectric constant that accurately captures out-of-plane fields within active redistribution layers.
| Structure Type | Frequency Spectrum | Isolated Tensor Vector | Calibration Standard | Conductor Roughness Sensitivity |
|---|---|---|---|---|
| Microstrip Ring Resonator | 2 GHz – 60 GHz | Combined Vector | SOLT / TRL | High |
| Stripline Differential Pair | 100 MHz – 50 GHz | Out-of-Plane | Multiline TRL | Moderate |
| Grounded CPW Line | 10 GHz – 110 GHz | In-Plane Dominant | On-Wafer LRM | High |
| Substrate Integrated Waveguide | 24 GHz – 90 GHz | In-Plane | TRL / TWR | Low |
Evaluating planar broadband structures requires separating conductor loss from true dielectric attenuation. Surface roughness on copper foil causes phase dispersion and extra attenuation that field solvers misinterpret as elevated loss tangent unless corrected. Applying numerical models like Hammerstad or modified Huray strips out these surface effects so extracted permittivity reflects true bulk properties.
Uncorrected copper foil surface roughness inflates extracted dielectric loss tangent figures by up to thirty percent at millimeter-wave frequencies.
Selecting the right broadband extraction fixture requires evaluating packaging routing constraints systematically:
- Trace Configuration Selection sets whether the electric field aligns predominantly with in-plane or out-of-plane substrate vectors.
- Metallization Process Matching ensures test coupon surface topology matches active redistribution layers, accounting for semi-additive copper plating effects.
- Probe Interface Geometry limits parasitic ground-loop inductance during high-frequency microprobing across chip-scale test panels.
- De-embedding Protocol Selection strips away connector phase offsets to isolate thin-film dielectric dispersion.
Without atomic force microscopy calibration, separating microstrip ring resonance phase shifts caused by anisotropic permittivity from those caused by local copper profile variations remains difficult.
Disparity
Discrepancies between datasheet figures and actual trace behavior stem from the physical construction of composite packaging laminates. Vendor datasheets publish single numbers measured via clamped stripline or split-post methods under lab conditions. Real high-density substrate layers use thin buildup dielectrics, microvia capture pads, and tight trace pitches where local glass-to-resin ratios drift substantially from bulk averages.
Worked Example: High-Density Packaging Impedance Skew Calculation
Consider an advanced packaging stackup using an ultra-thin 25-micrometer core prepreg reinforced with 1027 E-glass weave. The vendor quotes an out-of-plane dielectric constant of 3.40 at 10 GHz from clamped-stripline testing, while split-post resonator measurements show an in-plane dielectric constant of 3.75 at that same frequency. A designer sets up 50-ohm single-ended microstrips and 90-ohm differential coplanar waveguides assuming a single isotropic dielectric constant of 3.40.
For single-ended microstrips, the electric field distributes between air and the substrate along the vertical axis. The effective dielectric constant equation for microstrip geometry is:
varεeff = fracvarεz + 12 + fracvarεz – 12 left( 1 + 12 frachw right)-0.5
Assuming a trace width (w) of 20 micrometers and dielectric height (h) of 25 micrometers (h/w = 1.25):
varεeff = frac3.40 + 12 + frac3.40 – 12 left( 1 + 12(1.25) right)-0.5 = 2.20 + 1.20 (16)-0.5 = 2.20 + 0.30 = 2.50
Calculating microstrip characteristic impedance (Z0) with standard synthesis equations yields 52.1 ohms. But on tight-pitch differential coplanar waveguides with a trace gap (g) of 15 micrometers, lateral field components passing horizontally through the substrate dominate total capacitance. These horizontal fields interact with the in-plane dielectric constant (varεxy = 3.75) instead of the thickness-axis value (varεz = 3.40).
Recalculating the effective dielectric constant for lateral field components using the in-plane value shifts total line capacitance:
Cline = varε0 · varεeff,xy · fracK(k’)K(k)
Using varεxy = 3.75 increases line capacitance by roughly 7.2 percent over the isotropic estimate, dropping differential impedance from the target 90.0 ohms to 83.8 ohms. This 6.2-ohm discrepancy exceeds standard packaging tolerances, causing reflections, inter-symbol interference, and eye-aperture loss at 56 Gbps PAM4.
Coplanar waveguide field distributions interact strongly with in-plane substrate permittivity, shifting trace impedance lower than microstrip field models predict.
Lamination Dynamics and Local Glass-Resin Variance
Substrate lamination alters final compressed dielectric thickness and local resin balance. Vacuum hydraulic pressing drives fluid resin into spaces between copper traces, leaving glass bundles pressed directly against conductors. Because glass bundles carry a dielectric constant of roughly 6.6 while cured epoxy or cyanate ester resin sits between 2.8 and 3.2, traces running directly over glass knuckles see a higher effective permittivity than traces positioned over resin-rich pockets.
Surface roughness compounds this dispersion and requires deliberate modeling. Electrodeposited low-profile copper foils feature surface roughness (Rz) between 1.0 and 2.5 micrometers. At higher frequencies, current crowding forces electrons into this rough copper boundary, extending phase delay and skewing permittivity extractions if treated as smooth copper.
Relying on single-value datasheet permittivity for designs operating above 28 gigahertz leads to signal reflections that can force a full artwork re-spin and panel re-tooling.

Tolerance
Sourcing high-density interconnect laminates requires specifying directional permittivity tolerances in fabrication specs and procurement contracts. Standard laminate rules under IPC-4101 define slash-sheet default limits but often omit anisotropic dielectric requirements. Procurement teams need to state explicit tensor bounds in purchase orders to ensure batch-to-batch impedance consistency across production runs.
Commercial Impact and Panel Yield Architecture
Laminate thickness, resin fill consistency, and glass bundle alignment govern overall panel yield. Processing substrates on standard 510 mm by 515 mm working panels creates pressure gradients during lamination that shift resin content from panel center to edge. A resin variation of just three percent shifts out-of-plane permittivity by 0.05, altering trace impedance across the panel surface and cutting yield on working arrays.
| Laminate Classification | Datasheet Permittivity Tolerance | In-Plane vs Out-of-Plane Delta | Panel Yield Impact | Cost Premium over Standard FR-4 |
|---|---|---|---|---|
| Standard High-Tg Epoxy | ± 0.20 | 10% – 15% | High Skew Variance | 1.0x Baseline |
| Low-Loss PPE/PPO Core | ± 0.10 | 6% – 10% | Controlled Skew | 2.5x – 3.5x |
| Ultra-Low Loss PTFE/Glass | ± 0.05 | 4% – 8% | Tight Skew Bounds | 5.0x – 8.0x |
| Unreinforced Buildup Film | ± 0.04 | 1% – 3% | Minimal Skew | 4.0x – 6.0x |
Setting clear procurement parameters prevents material substitutions that compromise high-frequency performance:
- Slash Sheet Supplemental Notes add orthotropic permittivity windows to standard IPC-4101 procurement files.
- Coupling Coupon Requirements mandate planar TRL test structures on panel waste margins for batch release verification.
- Glass Style Mandates prevent suppliers from changing glass weave types between prototype qualification and volume runs.
- Resin Content Bounds set strict nominal prepreg limits to stabilize out-of-plane capacitance across production panels.
IPC-4101 Supplemental Specification Clause 3.8.2 enforces compliance with explicit dielectric constant tolerance bands across delivered packaging laminate lots.