Calibration Targets for Surface Mount Inspection
Precision optical and dimensional calibration targets establish micrometer-level accuracy across SMT vision, 3D SPI, and AXI systems to prevent escapes.

Artifact
Precision surface mount assembly requires physical optical reference master plates to establish baseline spatial metrics across camera networks and automated inspection systems. Automated optical inspection tools, automated solder paste inspection units, and high-speed pick-and-place alignment cameras rely on reference plates with known physical features to map pixel grids to physical spatial dimensions. Calibration targets provide the absolute length, coordinate grid, and height reference points that convert camera pixel outputs into micrometer-level physical measurements on the factory floor.
Quartz Substrates and Photolithographic Grids
Low-thermal-expansion synthetic quartz serves as the primary substrate material for high-precision optical target plates. Precision requires absolute dimensional stability. Quartz maintains a coefficient of thermal expansion near zero point five5 parts per million per degree Celsius, preserving feature positioning across ambient temperature swings inside the inspection machine enclosure.
Soda-lime glass offers a lower-cost option for basic line checks, yet its higher thermal expansion coefficient of eight point five parts per million per degree Celsius introduces spatial drift when optical enclosure temperatures rise during extended production runs.
Photolithographic deposition applies vacuum-sputtered chrome patterns onto the glass surface to define high-contrast calibration marks. The chrome grid pattern incorporates dot matrices, crosshair arrays, USAF 1951 resolution targets, and concentric rings. Dot matrix patterns spaced at precise one-millimeter or zero point five-millimeter pitches enable automated calibration algorithms to calculate non-linear distortion fields created by wide-angle optical lenses.
Photolithographic tolerances for feature placement on master reticles remain under zero point one micrometers across a two-hundred-millimeter field of view.
Optical inspection heads require reference plates manufactured from quartz when line enclosure temperatures drift beyond five degrees Celsius.
Glass targets expand predictably. Ceramic target plates provide an alternative substrate for diffuse illumination environments. Opaque white alumina ceramics eliminate backside reflections while offering thermal stability close to quartz.
Ceramic plates resist optical glare, allowing automated optical inspection systems with direct coaxial lighting to resolve micro-scale alignment features without saturation artifacts.

Optical Reflectance and Illumination Spectrum Matching
Optical inspection cameras utilize multi-angle, multi-spectrum light-emitting diode arrays featuring red, green, blue, and ultraviolet wavelengths. Calibration target coatings match the spectral reflectance requirements of these inspection heads. Dark chrome coatings provide a non-reflective black background with less than five percent optical reflectance, enhancing edge contrast for brightfield inspection cameras.
Standard bright chrome targets present over sixty percent reflectance, serving darkfield ring light calibration where glancing light must reflect sharply into the camera lens.
| Substrate Material | Thermal Expansion (ppm/°C) | Dimensional Tolerance (µm) | Spectral Reflectance Range (%) | Primary Optical Application |
|---|---|---|---|---|
| Synthetic Quartz | 0.5 | 0.05 to 0.10 | 10 to 65 (Chrome dependant) | High-Density IPC-9850 Placement & AOI |
| Soda-Lime Glass | 8.5 | 0.20 to 0.50 | 12 to 68 (Chrome dependant) | Standard 2D SMT Line Alignment |
| Alumina Ceramic | 6.5 | 0.15 to 0.30 | 85 to 92 (Diffuse Surface) | 3D SPI & Coaxial Lighting AOI |
| Glass-Carbon Hybrid | 2.1 | 0.10 to 0.25 | 4 to 8 (Anti-Reflective) | High-Magnification Micro-SMD Inspection |
Surface mount inspection equipment suppliers state that optical calibration target surfaces never degrade if wiped with low-lint cleanroom wipes, attributing image distortion errors exclusively to operator handling mistakes or camera sensor miscalibration.
Geometry
Spatial positioning accuracy across surface mount lines demands continuous mapping of lens distortion, perspective parallax, and motion axis orthogonality. Cameras mounted on high-speed gantry heads suffer from dynamic vibrations, mechanical thermal tilt, and optical barrel distortion. Calibration plates featuring two-dimensional dot matrix grids allow inspection software to construct a dynamic grid deformation map, correcting optical aberrations in real time before calculating component placement coordinates.
Telecentric Parallax Correction and Field Distortion
Telecentric lenses minimize magnification changes across varying component heights, yet optical manufacturing variations leave residual distortion across the periphery of the image sensor. Grid plates with known center-to-center dot spacings provide the reference points necessary to generate a sub-pixel distortion lookup table. The inspection software evaluates the apparent position of each photolithographic dot against its true physical position on the target, generating compensation vectors for every region of the image sensor.
Sub-pixel algorithms require sharp edges. The system fits an ellipse or circle to each chrome dot on the target target plate, calculating dot centers to within one-fiftieth of a physical camera pixel. When lens distortion bends straight lines into barrel or pincushion shapes, the compensation matrix warps the raw image back into a Euclidean coordinate system, preserving dimensional integrity across the entire field of view.
Sub-Pixel Scaling Protocols for High-Density Interconnects
Shrinking component packages require spatial verification down to single-micrometer thresholds. A zero-one-zero-five metric component footprint leaves less than twenty micrometers of allowable placement error before solder bridging occurs during reflow. Pixel-to-millimeter scaling factors determined during morning line release govern every subsequent automated inspection measurement throughout the shift.
- Thermal substrate expansion distorts the measured pitch across the central optical zone during extended production runs.
- Chrome photolithographic degradation alters grid edge sharpness, forcing camera algorithms to recalculate sub-pixel boundaries inaccurately.
- Illumination spectrum shifts diminish image contrast across chrome lines, producing false parallax errors during high-speed scanning.
- Dust accumulation on target reticles creates false edge transitions that skew pixel-to-millimeter scaling ratios across wide fields.
Dust distorts fine spatial measurements. Clean glass preserves edge definition. Thermal stability dictates measurement accuracy.
When the optical head scans across a large circuit panel, gantry axis non-orthogonality rotates the perceived component placement angle. Alignment targets featuring orthogonal reference axes allow the machine software to decouple gantry mechanical skew from lens distortion.
A pixel scale shift of zero point two micrometers across a forty-millimeter field of view generates a five-micron placement error on fine-pitch ball grid arrays.
Verification of camera scaling using uncalibrated printed circuit boards leads directly to false acceptance of misaligned components across high-density assembly runs.

Volume
Three-dimensional solder paste inspection systems measure deposit height, area, and total paste quantity to catch print defects before component placement. Phase-shift profilometry projects structured fringe light patterns onto solder deposits, calculating height profiles from the phase shift of the reflected light lines. Calibrating these 3D optical tools demands physical targets with precise, certified step heights that span the target paste deposit range from twenty micrometers to three hundred micrometers.
Stepped Ceramic Standards for Phase-Shift Profilometry
Physical height standards utilize precision-lapped ceramic or micro-machined glass plates incorporating stepped blocks of known thickness. Step heights are calibrated using contact profilometry traceable to national metrology standards. Phase patterns projected onto these stepped blocks calibrate the optical phase-to-height conversion equations inside the solder paste inspection engine.
Light intensity changes image contrast. Shadows obscure low-profile solder pads. Fringe patterns reveal height differences.
Step artifacts incorporate multi-tiered heights, such as fifty, one hundred, one hundred fifty, and two hundred micrometers, matching the range of standard stainless steel laser-cut stencils. System calibration maps projection projector angle nonlinearity, sensor tilt, and intensity variations across the vertical Z-axis workspace.
Which Calibration Target Standard Controls Optical Alignment?
Phase measurement profilometry relies on structured light triangulation, making the system susceptible to surface reflectivity variations between bright solder paste alloys and dark epoxy circuit substrates. Multi-height calibration artifacts utilize matte-finished ceramic surfaces that simulate the diffuse scattering properties of micro-grained solder paste, preventing sensor saturation during exposure cycles.
Consider a 3D solder paste inspection process evaluating a 100-micrometer nominal stencil height deposit over a 0.25 mm by 0.50 mm Quad Flat No-lead pad, producing a nominal deposit quantity of 12.5 nanoliters. Assume a three percent error in Z-height calibration occurs due to an uncalibrated height artifact. The inspection tool calculates an erroneous height of 103 micrometers, yielding a calculated paste deposit quantity of 12.875 nanoliters.
Across a twelve-hundred-pad Ball Grid Array package, this Z-axis calibration shift misrepresents stencil transfer efficiency by four point two percentage points, hiding systemic aperture clogging or stencil underside contamination from process engineers.
| Nominal Step Height (µm) | Manufacturing Tolerance (µm) | Measurement Method | Verification Frequency | Calibration Impact |
|---|---|---|---|---|
| 25.0 | ± 0.20 | Contact Stylus Profilometry | Monthly Traceability Check | Ultra-Fine Pitch Stencil Baseline |
| 75.0 | ± 0.25 | Optical Interferometry | Bi-Weekly Shift Calibration | Micro-BGA Paste Deposit Accuracy |
| 125.0 | ± 0.30 | Optical Interferometry | Daily Shift Release Check | Standard Chip Component Baseline |
| 200.0 | ± 0.40 | Contact Stylus Profilometry | Monthly Line Verification | Heavy Power Component Paste Limits |
- Clean the stepped glass plate with isopropyl alcohol to remove airborne flux residues before securing it onto the magnetic stage tooling.
- Verify ambient thermal equilibrium between the inspection chamber optical enclosure and the physical glass target for twenty minutes before running exposure cycles.
- Execute the multi-frequency phase-shift projection calibration to establish baseline fringe pattern triangulation across all four projection heads simultaneously.
- Measure the certified step height gauge block at five distinct grid locations to confirm height uniformity within zero point five micrometers.
IPC-9850 Section 5.2 requires placement accuracy verification using calibrated glass plates to maintain line qualification status.
IPC-A-610 Section 5.2.2 establishes target solder deposit acceptability criteria, rendering paste volume measurements legally non-compliant when derived from an unverified phase profilometry baseline.
Density
Automated X-ray inspection evaluates internal interconnect features invisible to optical cameras, including ball grid array voids, thermal pad coverage under flat no-lead packages, and barrel fill inside through-hole joints. X-ray absorption follows Beer-Lambert laws, where radiant energy attenuation correlates with material thickness and atomic number. Calibrating quantitative X-ray systems requires target blocks engineered with specific material step-wedges to calibrate grayscale pixel values to absolute metal mass and void sizes.
Step-Wedge Absorbers and X-Ray Grayscale Linearity
Physical calibration blocks for radioscopic inspection use precision-machined copper, aluminum, or lead step-wedges. Copper step plates feature stepped foils ranging from twenty-five micrometers to five hundred micrometers, reproducing the attenuation spectrum of standard circuit board copper layers and lead-free solder alloys. The X-ray image sensor detects grayscale intensity variations across the step-wedge, constructing a gray-level calibration curve that correlates image brightness directly to physical metal mass thickness.
X-ray tubes degrade over time. Grayscale drift skews void calculations. Scratches generate false optical readings.
Filament aging lowers X-ray flux output, while target spot degradation alters beam spot sharpness. Daily calibration against an absorption step-wedge adjusts detector integration times and digital gain control, maintaining absolute grayscale consistency across production runs spanning multiple months.
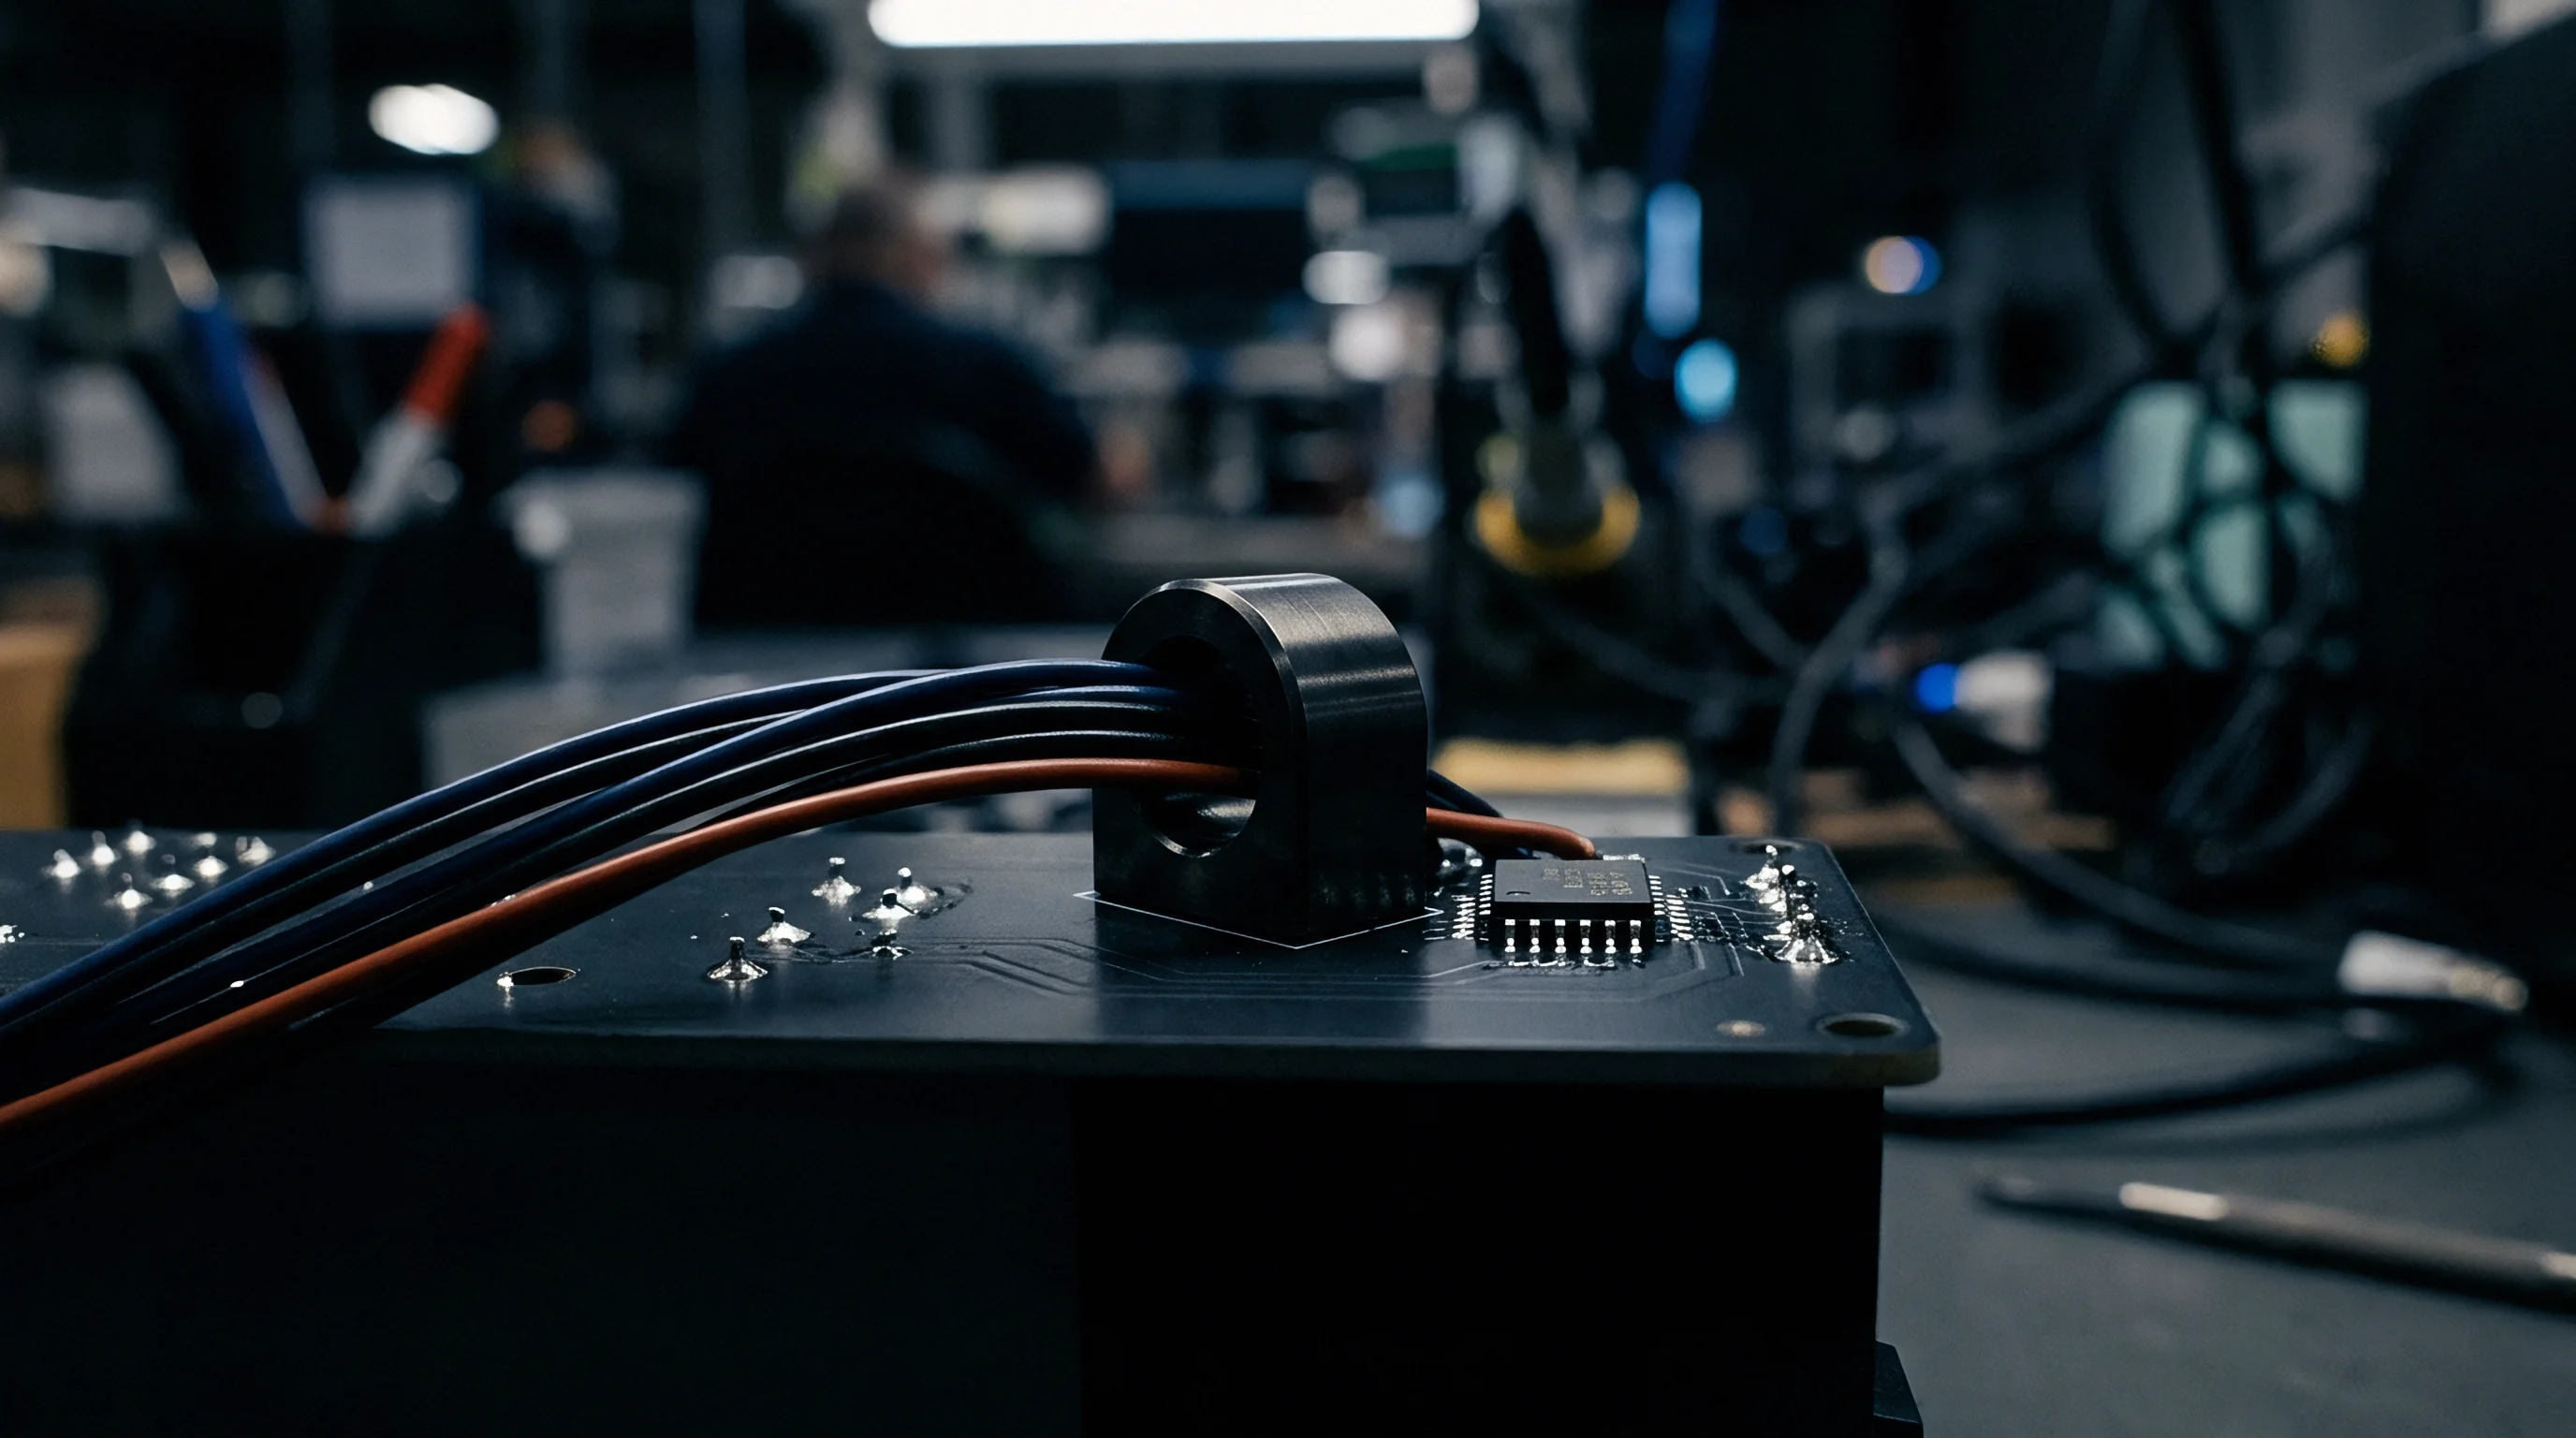
Voids and Intermetallic Layer Resolution in Automated Inspection
Void calculation algorithms determine the percentage of missing solder area within a joint boundary by analyzing grayscale pixel contrast ratios. Without accurate grayscale calibration, baseline background noise shifts alter the calculated void percentage, causing false line stops or allowing unacceptable outgassing voids to escape undetected.
- Absorber material selection determines whether the calibration plate matches the attenuation profile of lead-free SAC305 solder joints or copper power planes.
- Multi-step thickness verification validates detector linearity across both thin signal traces and thick multi-layer copper power cores.
- Void simulation cavity sizing ensures spatial resolution algorithms accurately differentiate between small outgassing pockets and structural solder gaps.
- Tube voltage compensation profiling recalculates grayscale scaling whenever x-ray source kilovoltage shifts during continuous operating shifts.
| Absorber Material | Thickness Gradient Range (µm) | Grayscale Calibration Range (Bits) | Target Inspection Focus | Replacement Interval (Months) |
|---|---|---|---|---|
| High-Purity Copper | 25 to 500 | 12 to 16 | Standard Lead-Free Joint Density | 24 |
| 99.99% Aluminum | 100 to 2000 | 10 to 14 | Low-Density Substrate & Wire Bond | 36 |
| Solder Alloy (SAC305) | 50 to 800 | 12 to 16 | BGA Void & Head-in-Pillow Mapping | 12 |
| Tungsten Precision Foil | 10 to 150 | 14 to 16 | Micro-CT & Sub-Micrometer Resolution | 24 |
X-ray detector degradation alters image grayscale linearity long before visible tube brightness declines.
Operating an automated X-ray line without shift-level grayscale calibration causes subtle attenuation shifts that distort void size calculations, passing failing solder joints and triggering sudden field failures under thermal cycling stress.
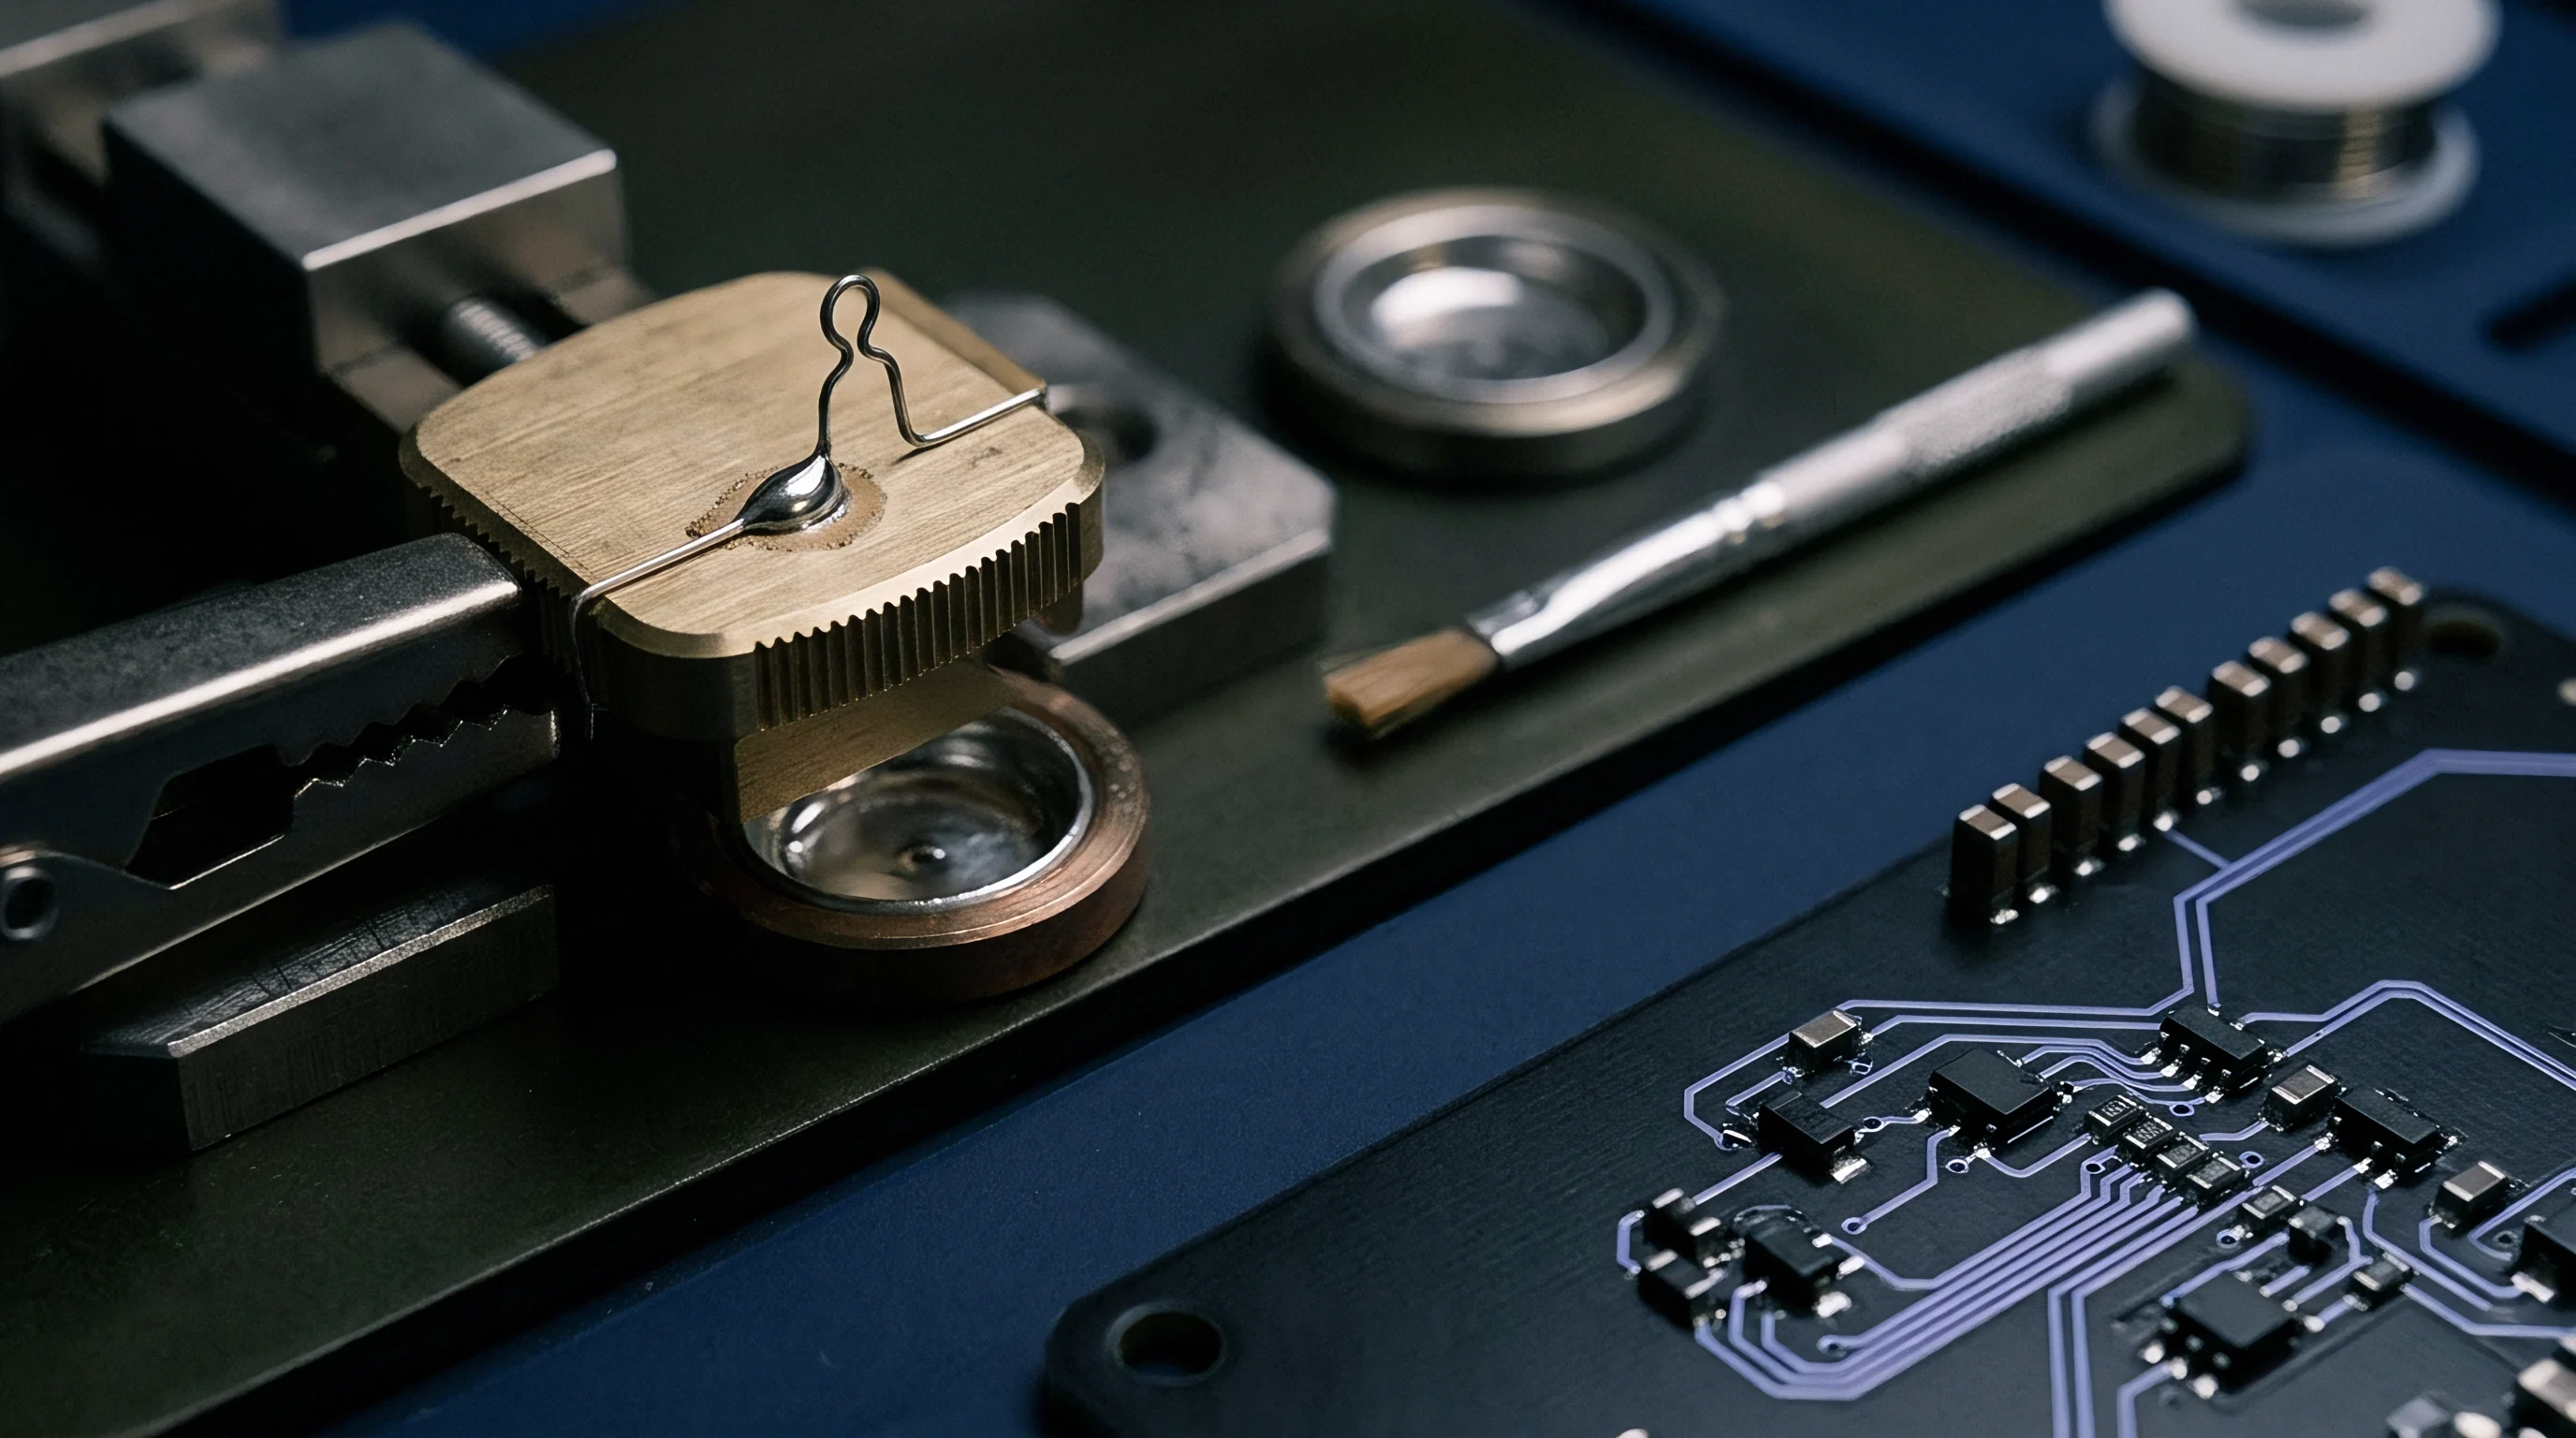

Cadence
Calibration plates represent precision reference standards that degrade over time through physical wear, optical contamination, thermal fatigue, and handling damage. Establishing strict calibration routines, storage protocols, and recertification intervals protects assembly line measurement integrity while keeping equipment maintenance budgets under control.

Recalibration Schedules and Thermal Expansion Controls
Daily shift-start routines utilize line-dedicated calibration plates to execute routine optical auto-focus, camera balance, and gantry scaling checks in under five minutes. Daily checks protect assembly yield. Calibration downtime consumes line capacity.
Master calibration targets undergo full laboratory recertification every twelve months to maintain ISO 17025 metrological traceability.
Handling glass plates introduces skin oils, dust, and solder flux aerosols that alter edge sharpness and optical transmittance. Cleaning reticles with pure isopropyl alcohol and lint-free wipes prevents optical scatter. Dedicated storage cases lined with static-dissipative materials shield reticles from mechanical abrasion and ambient humidity changes when stored off the production floor.
- Inspect the optical glass target surface under magnification for scratches, finger oils, or airborne particulate contamination.
- Store high-precision calibration reticles inside moisture-barrier ESD enclosures maintained at twenty-one degrees Celsius.
- Submit master reference plates to an ISO 17025 accredited laboratory every twelve months for optical coordinate mapping.
- Perform daily shift-start calibration runs using line-dedicated verification plates before releasing the SMT line for production.
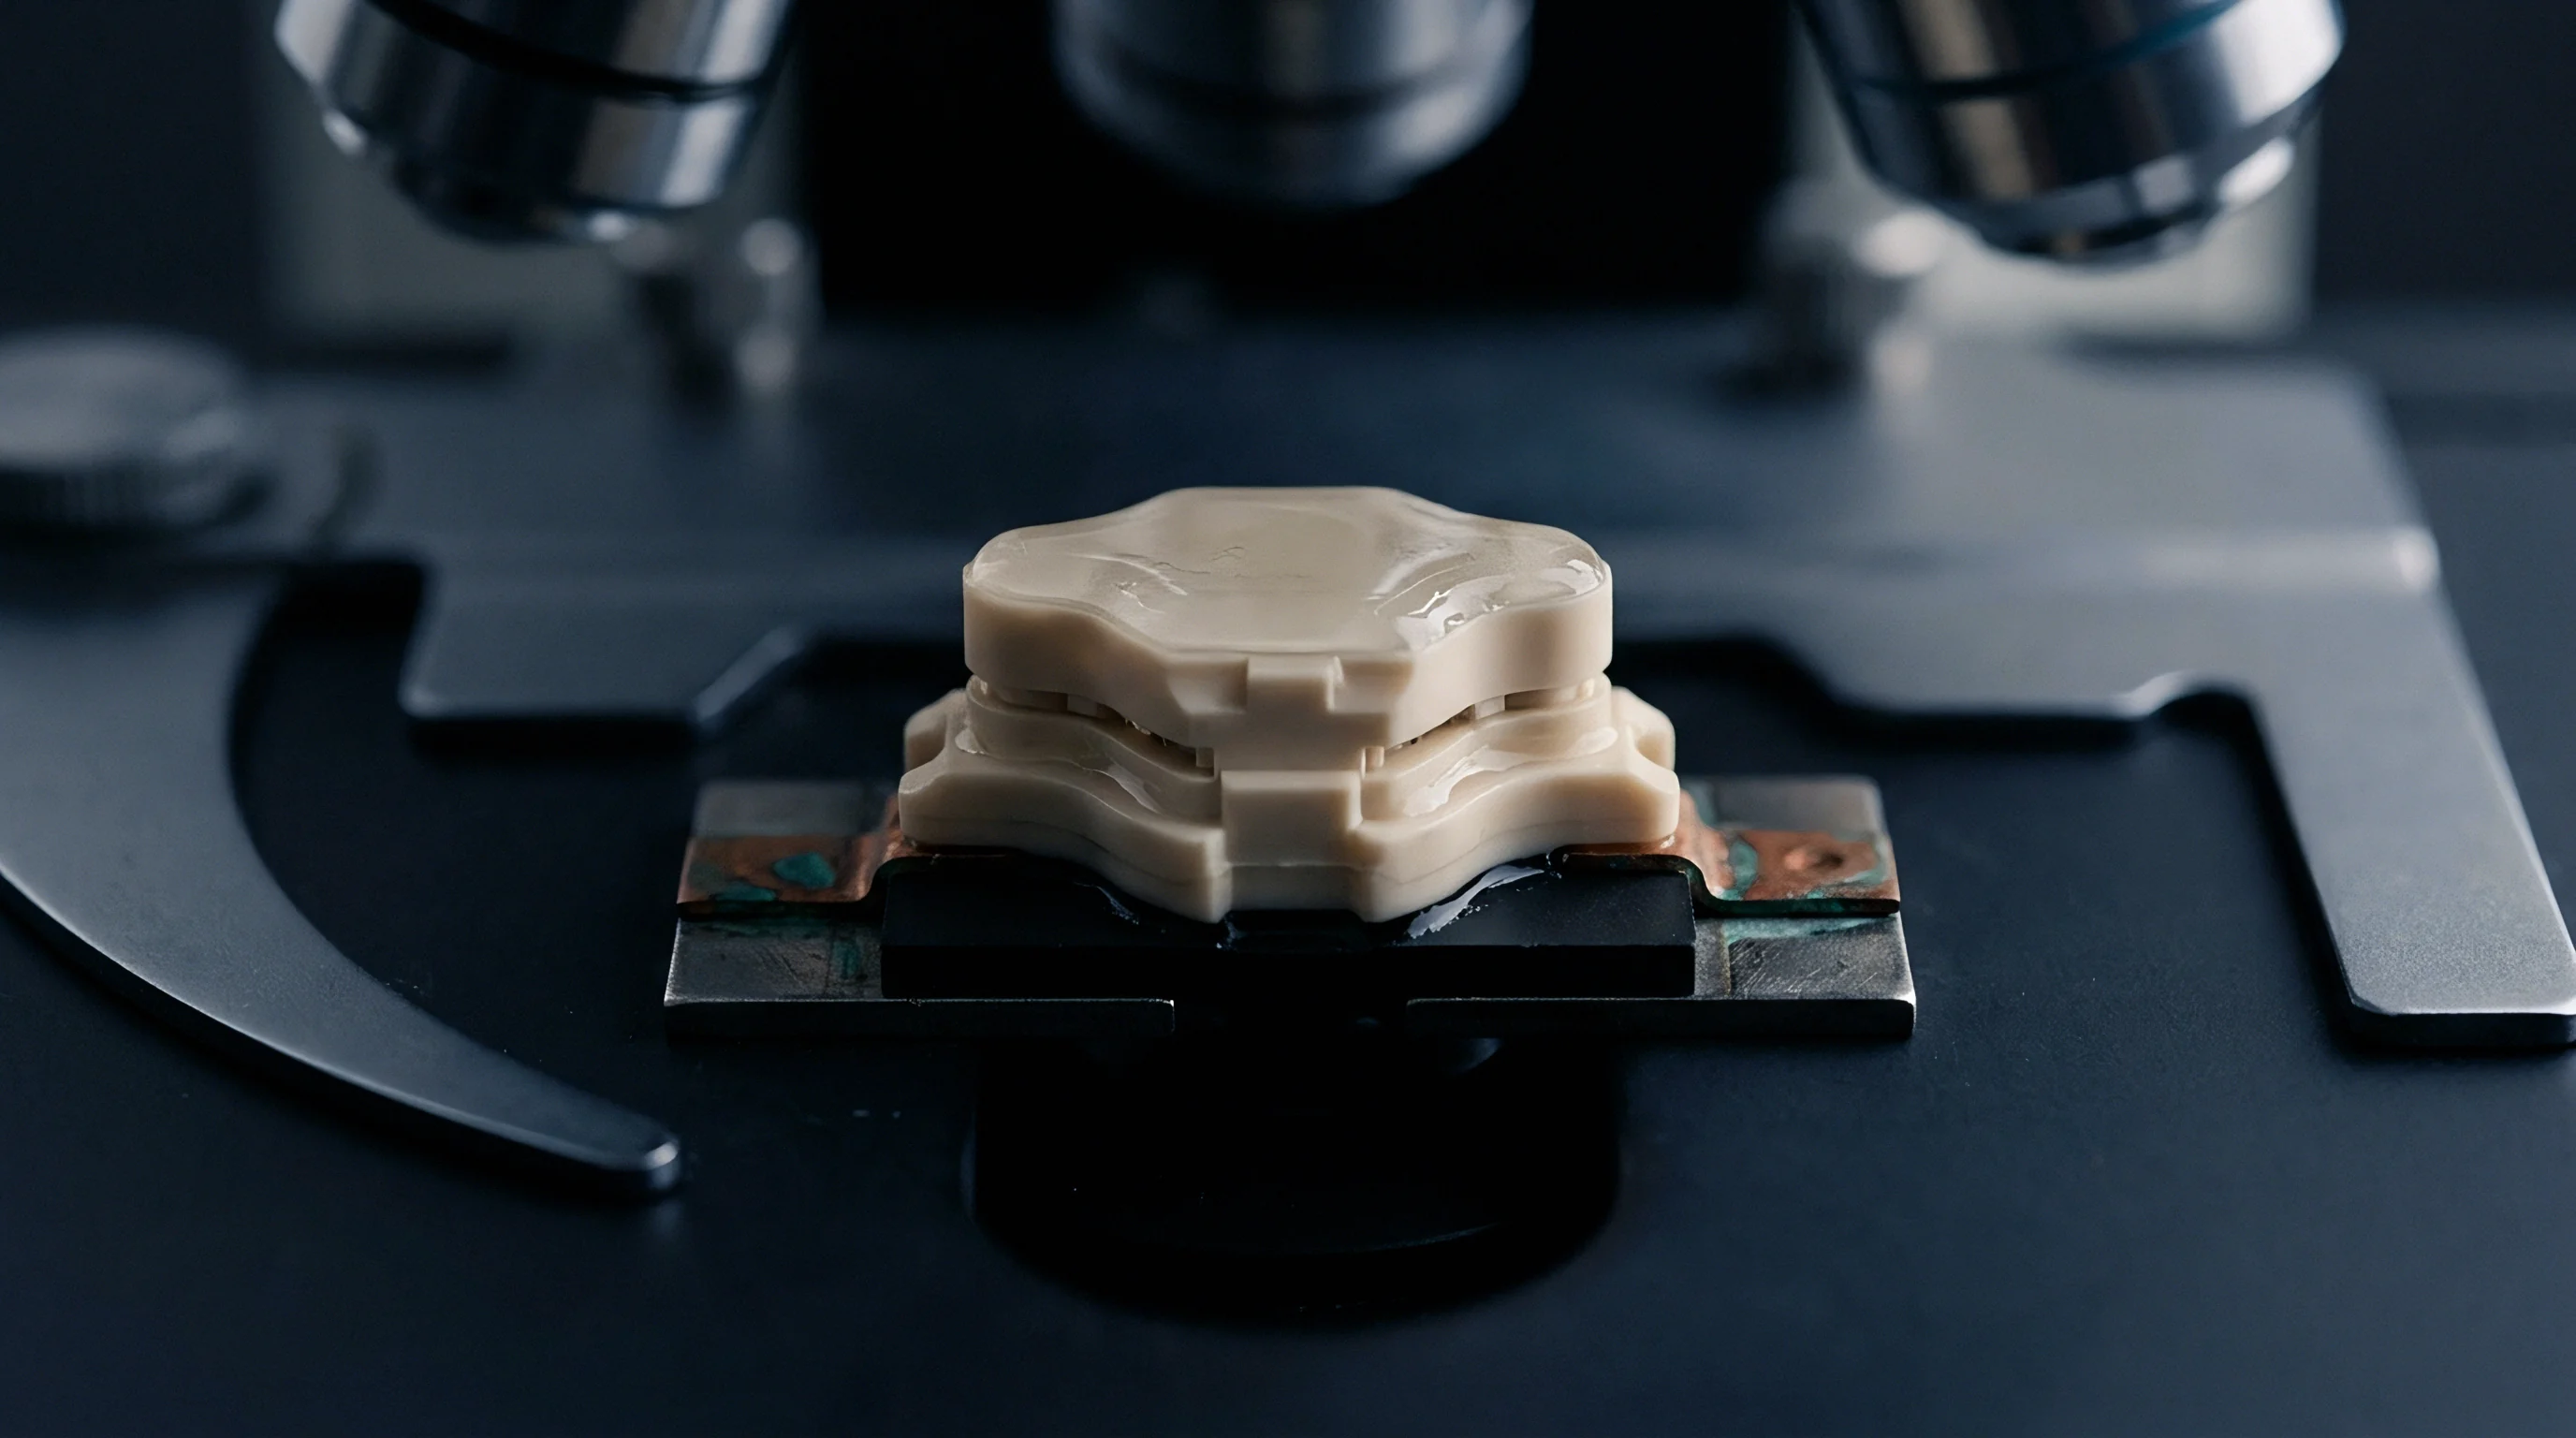
Financial Tradeoffs of On-Site Target Recalibration
A high-speed surface mount assembly line costs between two hundred and four hundred dollars per hour in scheduled line time. Machine calibration routines consume valuable production time, creating tension between thorough process verification and line throughput targets. Line managers balance morning calibration windows against the financial exposure of shipping unverified circuit assemblies.
Investing in automated line-side calibration target changers reduces setup times from fifteen minutes down to ninety seconds. Automated systems pull reference plates from internal clean storage, run dynamic axis and optical checks, and index the targets back into protective enclosures without operator intervention, removing handling risks entirely.
Whether multi-spectral optical degradation across mixed-wavelength inspection heads can be modeled reliably enough to double physical master plate recertification intervals without risking unnoticed assembly escapes remains an open question for assembly engineers.