Spatial Dielectric Variation Impact on High Frequency Core Packaging Structures
Spatial dielectric fluctuations in package substrates drive intrapair skew and return loss degradation, mandating spread glass and off-axis trace routing.
Mesh
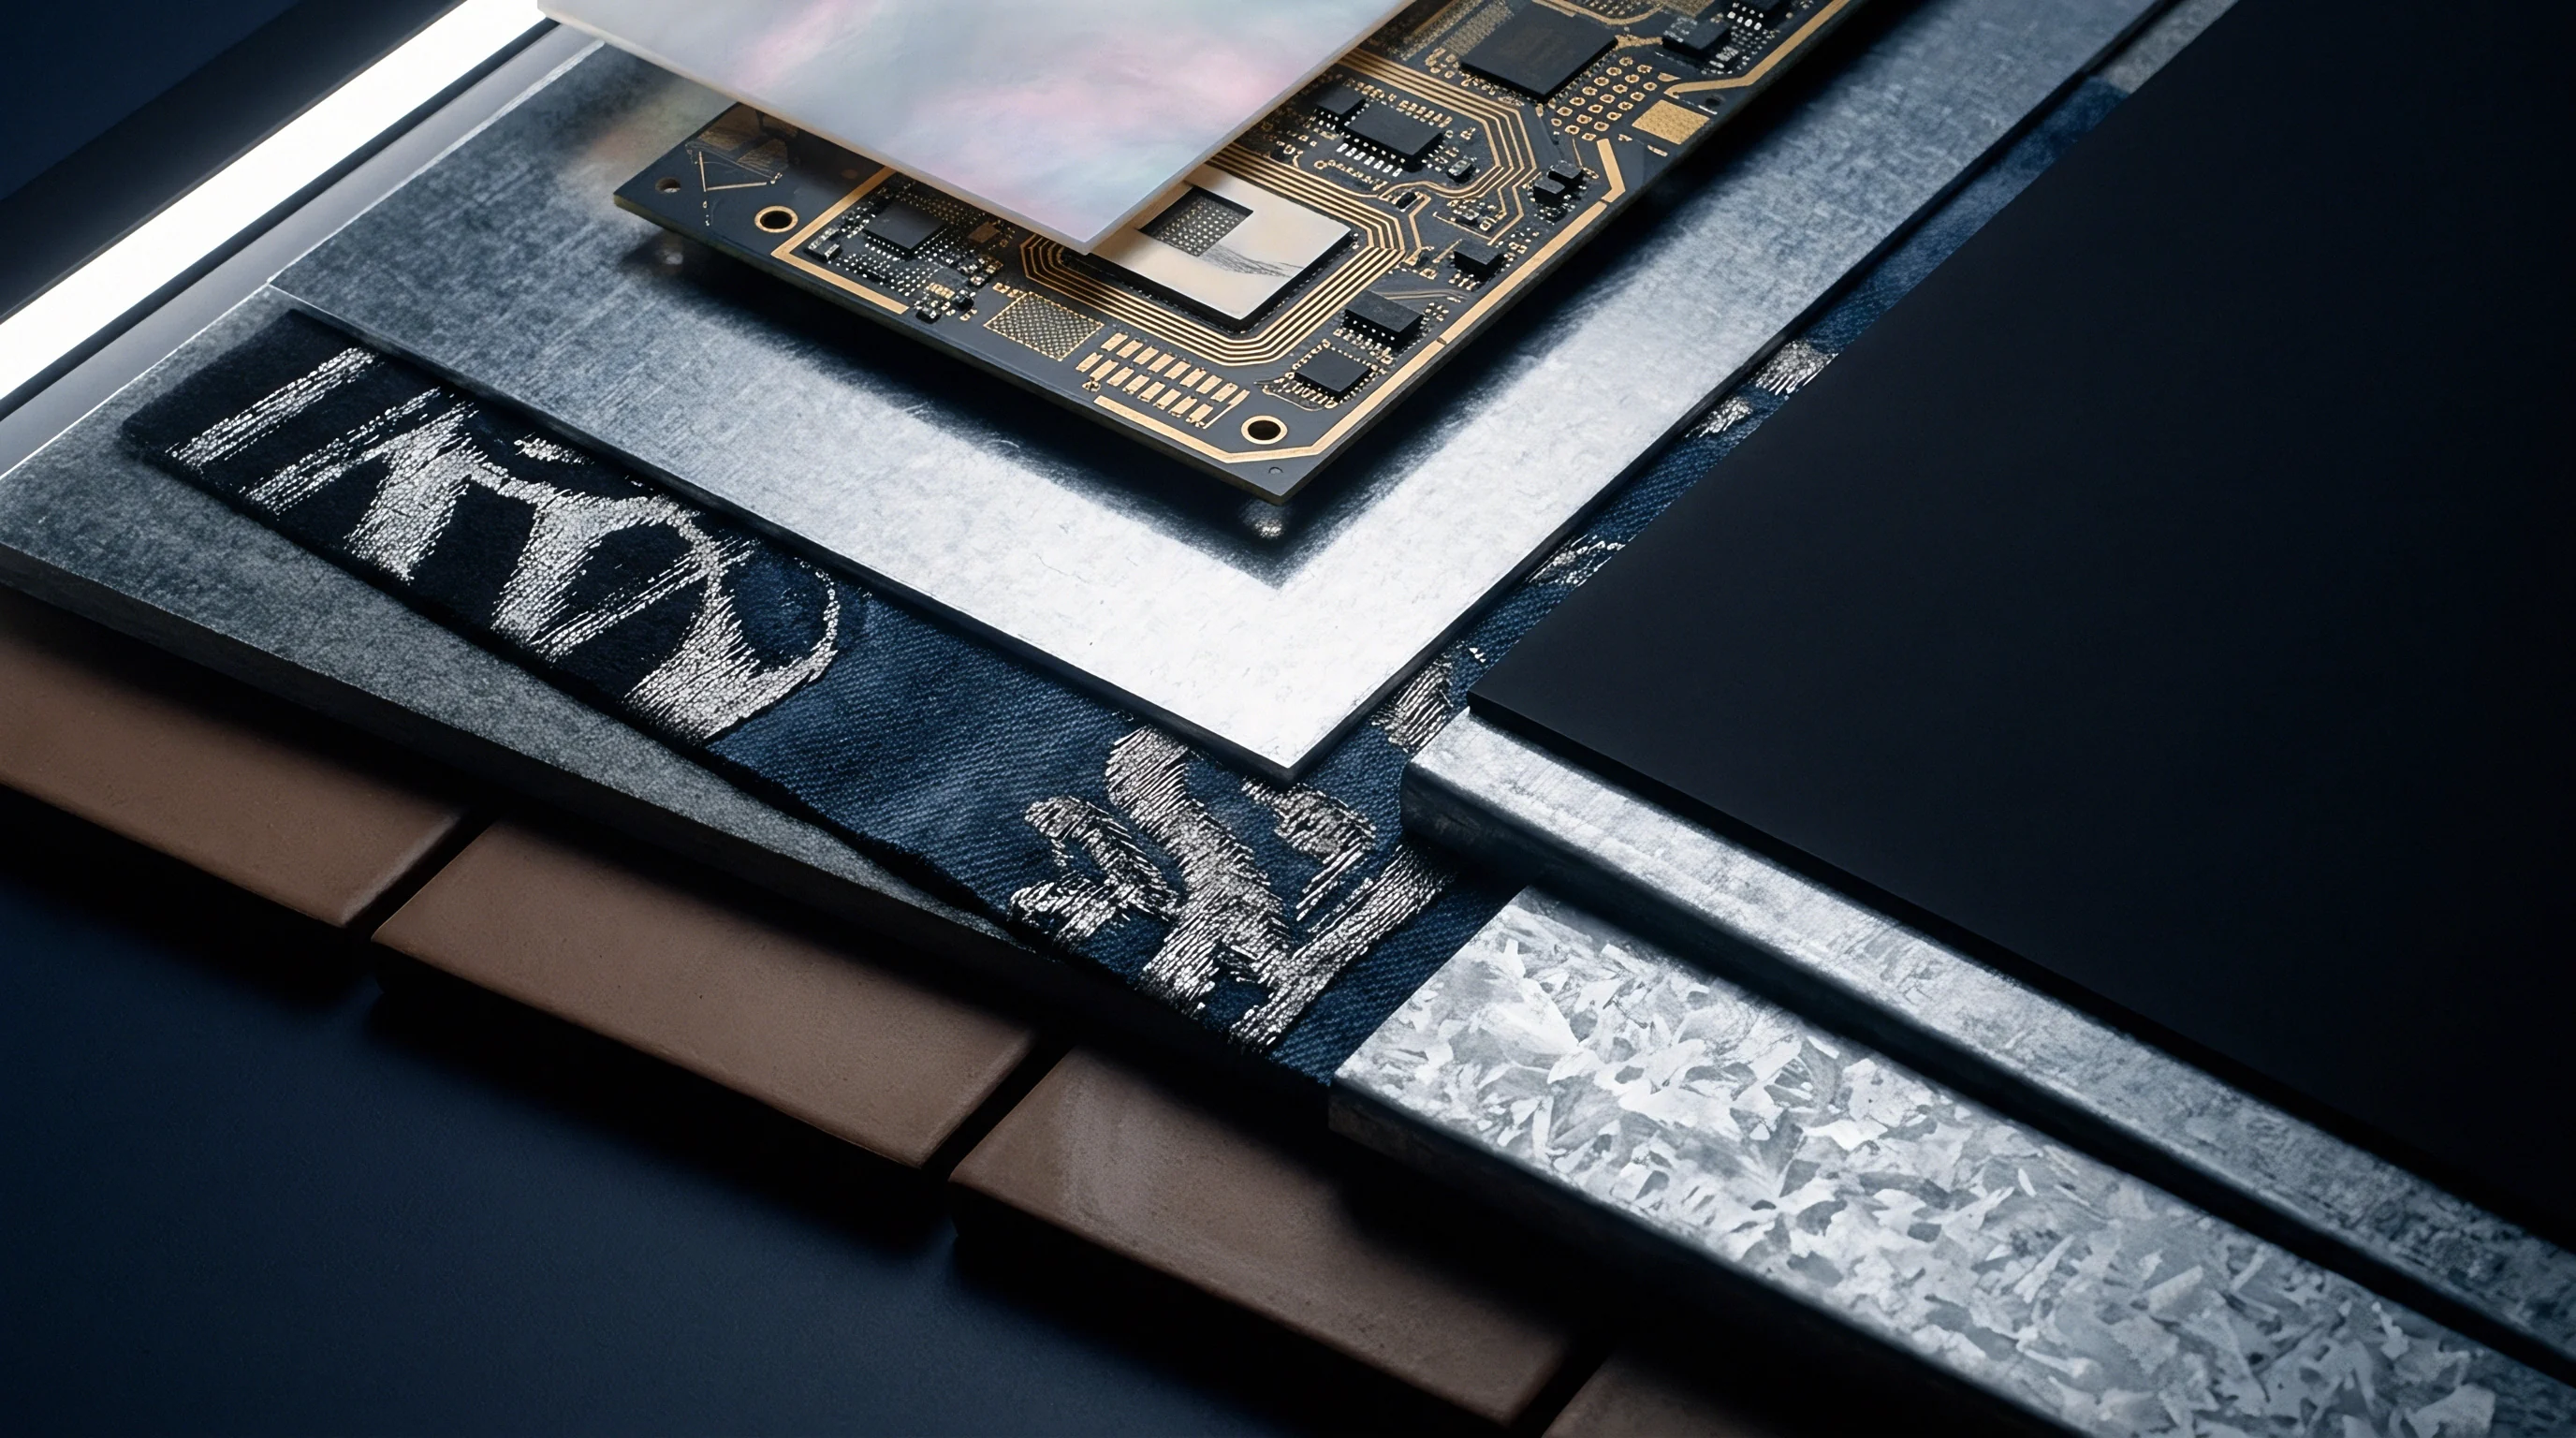
Filament bundles in reinforced substrate laminates create periodic spatial variations in dielectric permittivity across the sub-millimeter scale. Standard E-glass reinforcement fibers carry a relative dielectric constant of 6.8 at 10 GHz, while the surrounding epoxy or polyphenylene ether resin matrix exhibits a relative dielectric constant ranging between 2.8 and 3.1 at the same frequency. When conductor traces run parallel to yarn bundles, a signal line positioned directly over a glass fiber intersection experiences an effective dielectric constant near 4.1.
An adjacent trace running over a resin-rich window experiences an effective dielectric constant near 3.2. This microscopic inhomogeneity creates localized phase velocity shifts and impedance variations along high-frequency interconnects.
Glass Reinforcement Architecture and Dielectric Micro-Zoning
Reinforcement textiles alter local material density depending on yarn count and filament bundle geometry. Style 1080 plain textiles feature warp and fill yarn pitches of approximately 420 micrometers, creating distinct square windows where low-permittivity resin fills the gaps between dense glass bundles. Style 1078 and style 1035 spread glass materials undergo mechanical flattening during production, spreading individual filaments into thin ribbons that minimize open resin windows.
The localized dielectric constant shifts from a binary step function in standard textiles to a continuous, low-amplitude sinusoid in spread fabrics. Selecting a spread textile compresses the spatial peak-to-peak dielectric variation from 0.90 down to less than 0.15 across a 1 millimeter scan path.
High-density packaging substrates utilize composite center laminates to balance mechanical rigidity against electrical performance. Low-loss substrates incorporate hollow glass filaments or modified synthetic compositions, such as L-glass or NE-glass, which exhibit dielectric constants of 4.6 and 4.4 at 10 GHz. Matching the dielectric constant of the glass reinforcement closer to the resin matrix reduces the magnitude of spatial dielectric variation.
A trace traversing an L-glass reinforced substrate experiences less than half the localized permittivity drift compared to an identical layout on standard E-glass, stabilizing propagation speed across tight signal channels.
The spatial periodicity of dielectric variation matches the physical pitch of the reinforcement yarn bundle.

Resin Impregnation Density and Hydrophobic Filler Gradients
Thermosetting polymer formulations incorporate inorganic silica fillers to suppress the coefficient of thermal expansion along the z-axis. Microscopic spherical silica particles, sized between 100 nanometers and 2 micrometers, populate 50 to 70 percent of the resin system by weight. High-shear mixing during resin batching distribution produces localized filler clustering if fluid viscosity drifts during impregnation.
In regions of high silica concentration, the local dielectric constant rises slightly, while the local dissipation factor drops relative to un-filled resin pockets.
Lamination pressure forces liquid resin into the voids between glass filaments during press cycles. Inadequate resin flow leaves micro-voids along filament boundaries, resulting in localized dielectric drops down to 1.0 where air pockets persist. Over-pressurization pushes resin out of central zones, creating resin-starved regions where dense glass filaments dominate the dielectric footprint.
The interaction between fluid dynamics and fabric geometry dictates whether a packaging center substrate achieves spatial electrical uniformity or introduces high-frequency phase distortion.
- Yarn pitch periodicity defines the physical wavelength of dielectric fluctuations along parallel trace runs.
- Resin window voiding creates localized dips in effective dielectric constant where air bubbles nest within glass bundles.
- Silica filler aggregation alters local loss tangent figures across sub-millimeter substrate regions.
- Filament bundle flattening narrows the gap between minimum and maximum effective permittivity across the panel.
| Weave Style | Glass Type | Yarn Pitch (Warp x Fill, µm) | Nominal Dk | Local Dk Variation Range | Primary Package Application |
|---|---|---|---|---|---|
| 1080 Standard | E-Glass | 420 x 420 | 4.20 | 3.25 to 4.15 | Standard RF Package Base |
| 1078 Spread | E-Glass | 450 x 450 | 4.05 | 3.70 to 4.10 | High-Speed Digital Substrates |
| 1035 Spread | L-Glass | 380 x 380 | 3.45 | 3.32 to 3.52 | Ultra-Low-Loss Packaging Cores |
| 1027 Spread | NE-Glass | 330 x 330 | 3.30 | 3.22 to 3.38 | Millimeter-Wave Package Modules |
Selecting spread glass reinforcement represents the primary physical control against spatial dielectric drift. Uniform filament distribution bounds localized dielectric constant variations within manufacturing tolerances.
Velocity
Signal propagation speed in a dielectric medium depends inversely on the square root of the effective relative dielectric constant. When high-speed differential signals travel over non-uniform substrate materials, each conductor leg experiences a different phase velocity. A differential pair operating at 56 Gbps PAM4 requires precise phase alignment to preserve eye height and eye width.
Spatial dielectric fluctuations disrupt this balance, converting differential mode energy into common mode noise along the interconnect length.
Phase Dispersion and Intrapair Propagation Skew
Differential trace routing on a rigid package substrate positions conductors at fixed center-to-center spacings, typically between 50 and 150 micrometers. If trace spacing aligns with the pitch of glass yarn bundles, one leg of the differential pair may lie continuously over glass filaments while the companion leg traverses resin-rich windows. The trace over glass experiences a higher dielectric constant, slowing its signal propagation speed.
The trace over resin transmits its signal faster, creating intrapair skew that accumulates linearly over distance.
Intrapair skew exceeding 10 percent of a signal unit interval degrades system margin significantly. At 112 Gbps PAM4 signaling, a single unit interval spans approximately 17.8 picoseconds. An intrapair skew of just 1.8 picoseconds closes the vertical eye opening by more than 2 dB.
Over a 50 millimeter package routing distance, a dielectric constant difference of 0.4 between trace legs generates over 3.5 picoseconds of skew. This phase mismatch creates skew levels that consume the entire jitter budget of the package interface.
Intrapair skew accumulates linearly over signal length when trace paths align with glass yarn axes.
Resonant Reflections and Attenuation Variations along Package Traces
Impedance stability relies on constant dielectric properties along trace geometry. A microstrip or stripline trace crossing alternating glass yarn and resin zones sees a continuously varying characteristic impedance. Over a resin window, trace impedance shifts upward due to lower capacitance per unit length.
Over a glass bundle, trace impedance drops due to higher capacitive loading. This periodic impedance mismatch acts as a Bragg reflector at specific millimeter-wave frequencies.
Impedance ripples generate periodic S11 return loss notches along the transmission path. When the signal wavelength in the substrate matches twice the yarn pitch, destructive interference occurs, creating sharp attenuation spikes in the frequency response. Localized variations in loss tangent accentuate these filter effects.
Glass filaments exhibit a higher dissipation factor than advanced low-loss resins. Signals passing over glass experience higher dielectric loss per millimeter, introducing localized amplitude fluctuations that complicate receiver equalizer adaptation.
The exact mathematical boundary where spatial dielectric variation transitions from manageable jitter to complete channel closure remains open for multi-layer glass stackups.
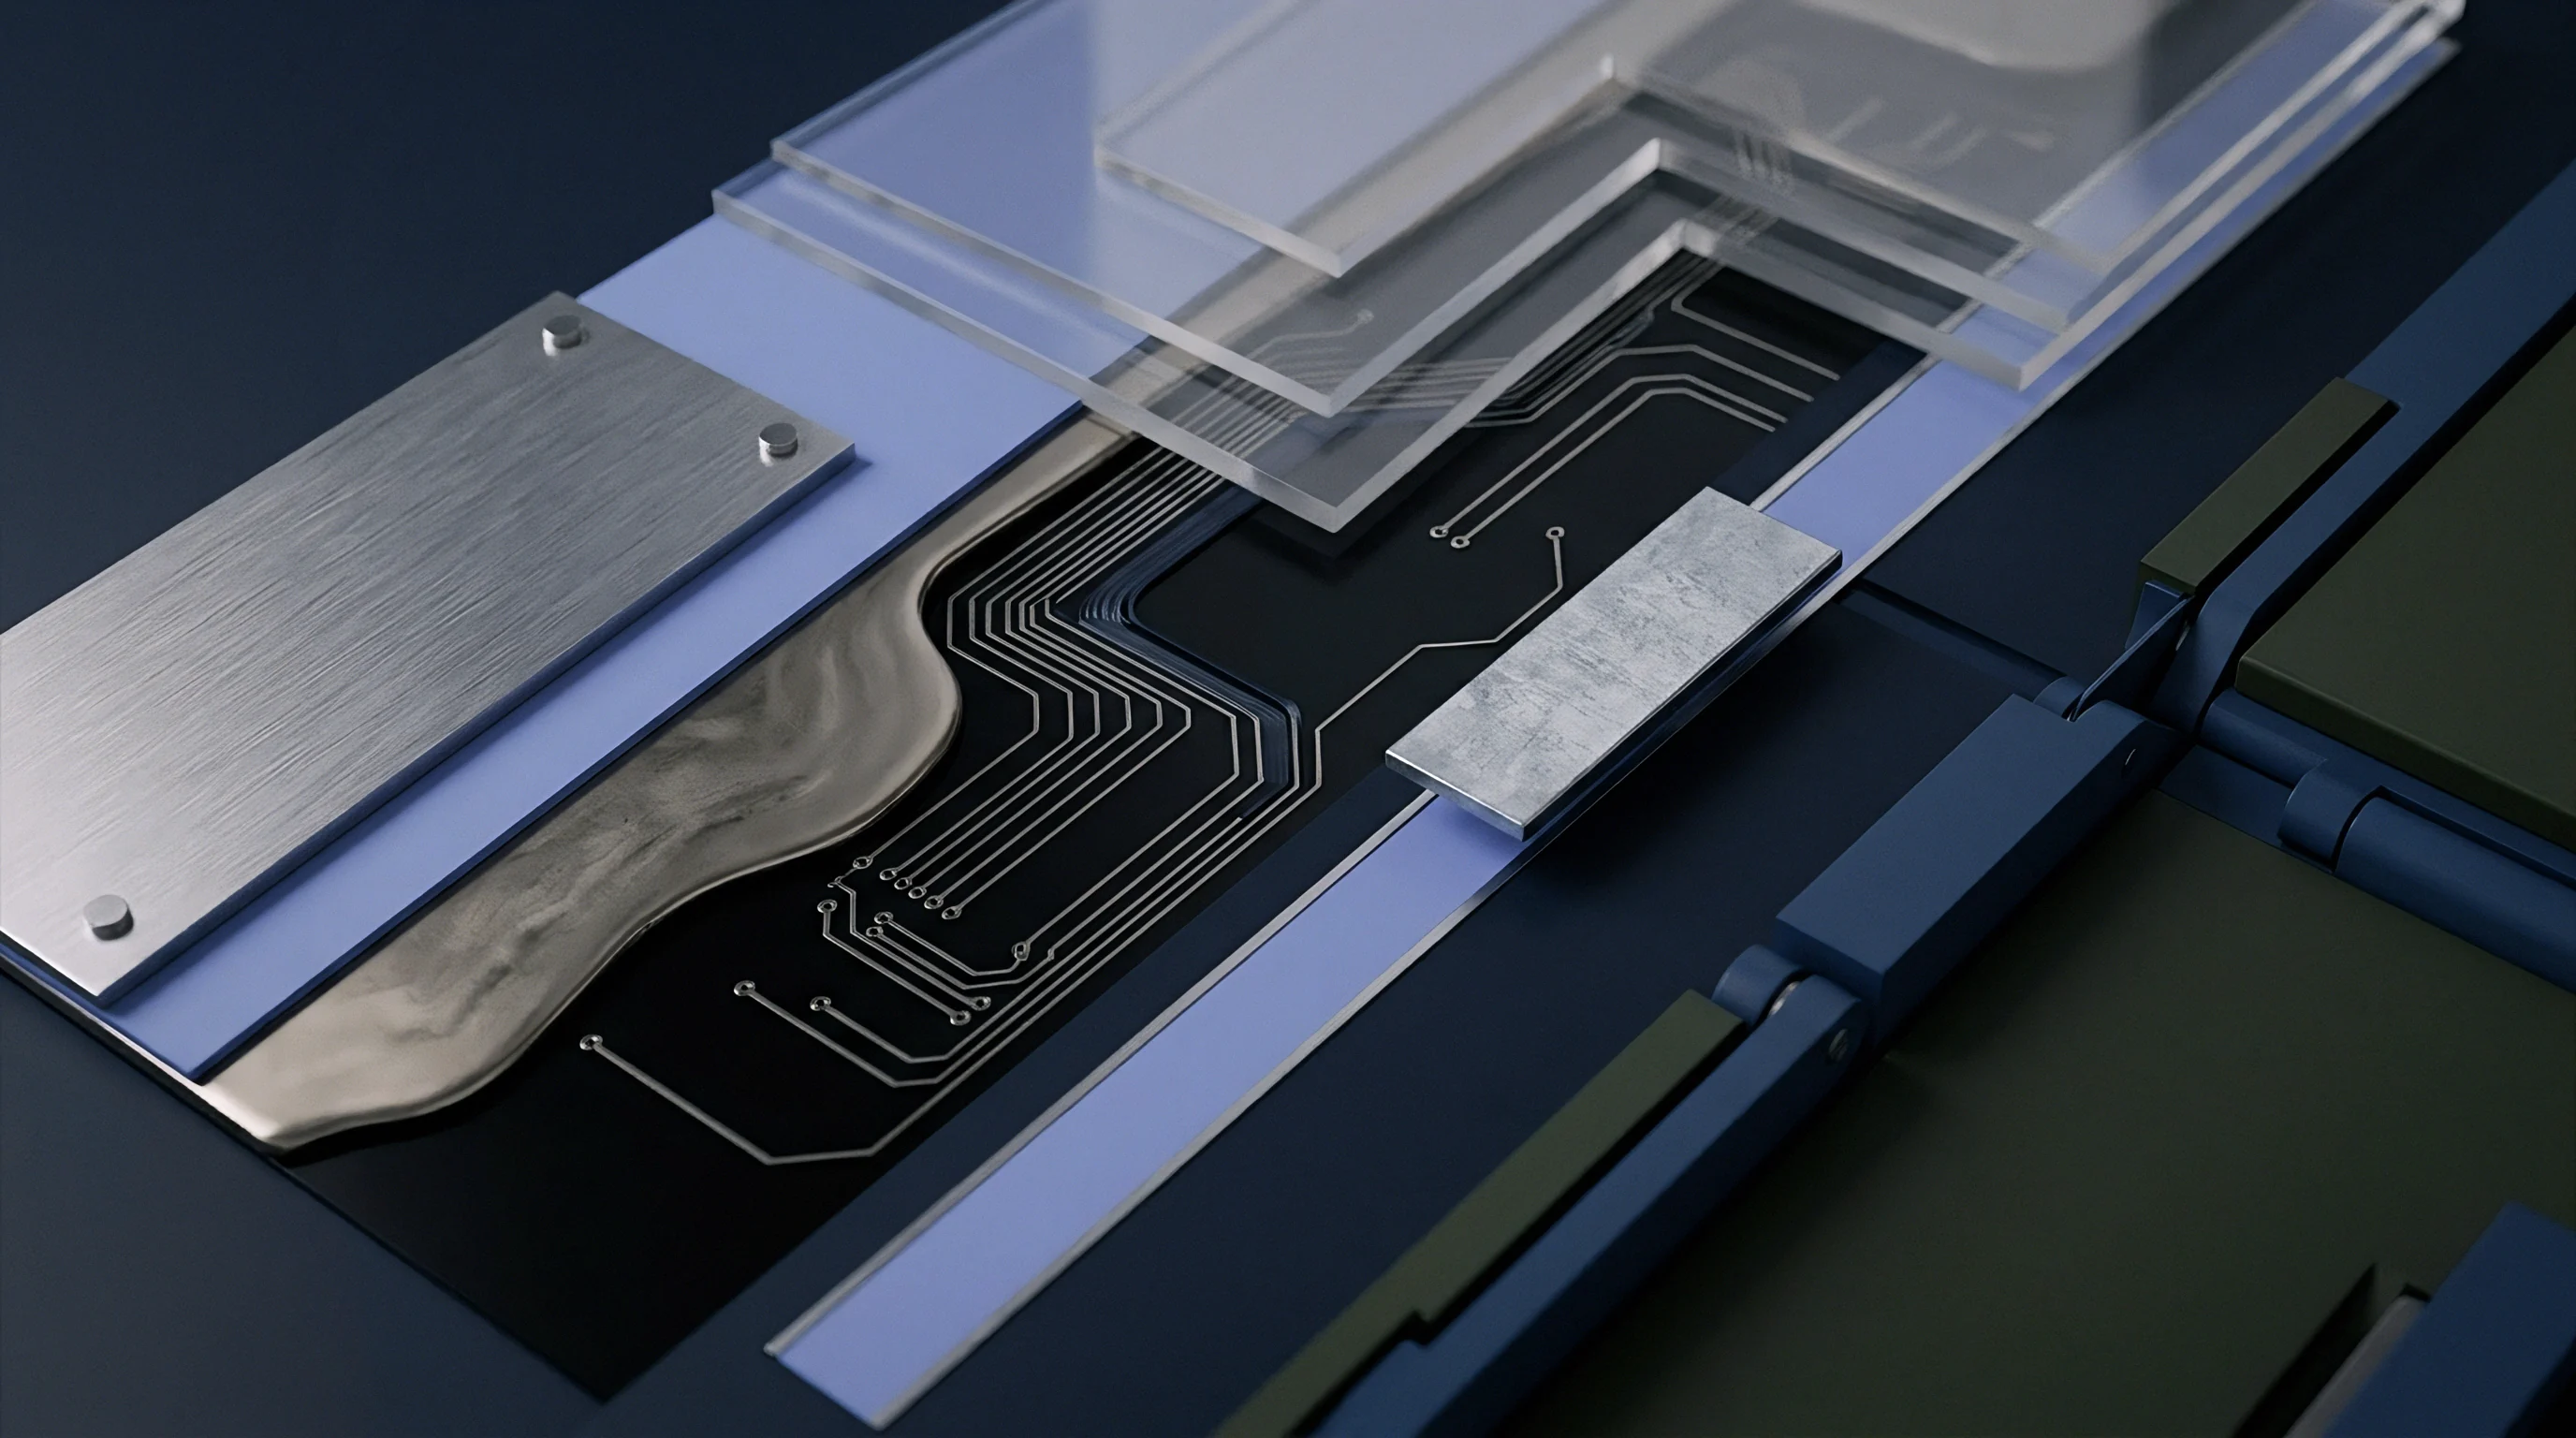
Perturbation
Quantifying localized dielectric disturbances requires mapping transmission line behavior against physical fabric geometry. Standard bulk measurement methods fail to capture micro-scale variations because they average material properties over several square centimeters. High-frequency packaging applications demand microscopic modeling that treats the substrate center layer as a non-uniform medium with localized tensor properties.
Small variations in glass placement yield significant deviations in signal timing and amplitude integrity.
Could Spread Glass Structures Eliminate Microscopic Dielectric Inhomogeneity?
Mechanically flattened textiles redistribute glass filaments across the weave matrix to minimize spatial gaps. Spread glass fabrics reduce open resin windows from 30 percent of the surface area down to less than 2 percent. This structural modification compresses localized dielectric constant spikes, creating a smoother capacitive profile along conductor paths.
Microstrip traces fabricated on spread glass display impedance variations within +/- 1.5 ohms, compared to +/- 4.8 ohms on standard textiles.
Spread glass alone does not eliminate dielectric non-uniformity completely. Variations in filament packing density inside the spread yarn create residual permittivity gradients. Multi-ply substrate constructions mitigate these residuals when fabric layers are offset randomly during lamination.
Stacking two layers of 1078 spread glass reduces the probability of aligned resin windows through the z-axis, averaging out dielectric anomalies across the stackup thickness.
Trace Layout Angle Optimization and Differential Array Tolerances
Routing traces at an angle relative to the substrate yarn axes prevents long-distance alignment with glass filaments. Laying out high-speed differential channels at a 10-degree to 15-degree off-axis angle forces both conductor legs to cross glass bundles and resin windows at identical spatial frequencies. Intrapair skew averages out over short distances, staying below 0.5 picoseconds across a 50 millimeter routing distance.
Off-axis routing imposes commercial trade-offs on panel layout efficiency. Rotating an entire packaging array by 11 degrees on a 510 mm x 515 mm manufacturing panel reduces usable substrate count by 12 to 18 percent. Alternatively, zig-zag routing allows individual traces to bend at off-axis angles while keeping substrate arrays aligned to the panel grid.
Zig-zag routing increases total trace length and consumes routing space on high-density escape layers.
- Laminate baseline screening establishes bulk dielectric properties at 10 GHz using split-post resonator cavity testing.
- Micro-section optical mapping measures exact glass filament spacing, bundle pitch, and resin window dimensions across sample lots.
- Coupon TDR extraction measures localized differential impedance ripple along 100 mm test lines with sub-10 picosecond pulse resolution.
- Intrapair skew verification quantifies timing delays between differential signal legs across extreme temperature ranges.
- Array yield analysis correlates panel layout placement against pass rates at final high-frequency probe test.
Consider a high-density package substrate utilizing a 100-micrometer thick core center laminate with 1/3 oz copper traces operating at 56 Gbps PAM4. In Case A, routing runs parallel to a standard 1080 glass textile on E-glass substrate. Conductor Leg A sits over glass (Dk = 4.10), while Leg B sits over resin (Dk = 3.25).
The propagation speed on Leg A equals 1.482 x 10^8 meters per second. The propagation speed on Leg B equals 1.663 x 10^8 meters per second. Over a 50 millimeter path length, Leg A requires 337.4 picoseconds, while Leg B requires 300.6 picoseconds.
The resulting intrapair skew reaches 36.8 picoseconds. This value exceeds two full unit intervals, collapsing the signal eye entirely.
In Case B, the substrate upgrades to a 1078 spread glass on L-glass substrate with an 11-degree rotated layout. Localized dielectric constant variations shrink to a range between 3.42 and 3.50. Conductor Leg A sees an average effective dielectric constant of 3.46, while Leg B sees 3.45.
Propagation speed on Leg A reaches 1.612 x 10^8 meters per second; Leg B reaches 1.614 x 10^8 meters per second. Over the same 50 millimeter path, Leg A requires 310.1 picoseconds and Leg B requires 309.7 picoseconds. Intrapair skew drops to 0.4 picoseconds.
This performance keeps phase jitter well inside the 1.78 picosecond budget required for PAM4 compliance.
In Case C, the design retains 1078 spread glass on L-glass but reverts to 0-degree unrotated parallel routing under a 2-degree manufacturing alignment error. In production press cycles, panel registration shifts by up to 2 degrees relative to nominal axes. This slight rotation introduces a long-period spatial beat frequency between trace pitch and yarn pitch.
Leg A and Leg B alternate dominance over 15 millimeter intervals. Total accumulated skew measures 2.1 picoseconds over 50 millimeters. This case demonstrates that material selection without rotational layout control remains vulnerable to lamination registration tolerances.
| Layout Strategy | Glass Textile Type | Dielectric Variation (Dk Range) | Accumulated Skew (ps) | Impedance Ripple (Ohms) | Panel Area Efficiency Penalty |
|---|---|---|---|---|---|
| Standard Parallel (0 deg) | 1080 E-Glass | 3.25 to 4.10 | 36.80 | +/- 4.8 | 0% (Baseline) |
| Spread Glass Parallel (0 deg) | 1078 L-Glass | 3.35 to 3.55 | 4.20 | +/- 1.8 | 0% |
| Rotated Layout (11 deg) | 1078 L-Glass | 3.42 to 3.50 | 0.40 | +/- 0.6 | 14.5% Loss |
| Zig-Zag Routing (11 deg) | 1078 L-Glass | 3.40 to 3.52 | 0.75 | +/- 0.9 | 4.0% Trace Length Penalty |
| Parallel with 2 deg Misalignment | 1078 L-Glass | 3.38 to 3.54 | 2.10 | +/- 1.2 | 0% |
High-speed substrate testing relies on published methods under specific environmental controls. Micro-strip ring resonator data extracted at 10 GHz with a 50-ohm line geometry on 100-micrometer cores rests on a 30-sample panel lot test performed at 23 degrees Celsius and 45 percent relative humidity. Lowering substrate moisture content via baking alters baseline resin dielectric constants by 0.08, shifting absolute delay figures while maintaining relative spatial skew ratios.
Spatial dielectric measurements under extreme thermal stress remain uncertain across wide vendor base samples. Standard lab testing confirms low skew at room temperature, but thermal expansion mismatches between resin and glass at 125 degrees Celsius shift yarn spacing dynamically. Buyers managing high-reliability substrate sourcing enforce thermal cycling validation on coupon samples to verify skew limits across operating boundaries.
Specifying off-axis routing notes on fabrication drawings overrides standard panel alignment rules to force rotational positioning.
Failing to account for micro-scale dielectric variation during stackup definition results in package-level bit error rates that exceed system budgets during final test.
Protocol
Verifying spatial material consistency across high-volume production requires specific metrology tools and test coupon designs. Standard broad-area dielectric testing fails to detect sub-millimeter permittivity spikes. Advanced inspection relies on high-resolution resonators and time-domain reflectometry to qualify substrate center materials before release to assembly.
Metrology Methods for Sub-Millimeter Dielectric Characterization
Split-post dielectric resonators measure bulk dielectric constant and loss tangent over sample disks. While accurate to within 1 percent for average material properties, these cavity resonators average over a 20-millimeter diameter spot size. They cannot isolate the 400-micrometer pitch variations caused by glass yarns.
Detecting micro-scale anomalies requires microstrip ring resonators or balanced-type circular disk resonators etched directly onto prototype panels.
Scanning microwave microscopy utilizes a sharp metallic probe to scan substrate surfaces at sub-micron resolutions. The probe measures localized capacitive coupling, constructing a high-resolution map of dielectric constant shifts across glass bundle intersections. Time-domain reflectometry using sub-10 picosecond rise-time step pulses offers a practical bench alternative.
Measuring reflection profiles along tight differential lines reveals local impedance drops corresponding to individual glass yarn crossings.

Coupons and Panel Inspection Standardization
Fabrication drawings for high-speed package substrates incorporate quality verification coupons in panel break-away strips. Skew verification coupons feature long parallel differential lines designed to match the longest signal path on the active packaging die. Passing TDR skew inspection on panel coupons forms a mandatory gating criterion for lot acceptance.
Differential insertion loss testing follows standardized methods such as IPC-TM-650 Method 2.5.5.12 SET2DIL. High-frequency probes measure S-parameter matrices up to 50 GHz, extracting phase delay variances between channel legs. Incorporating SET2DIL structures on every panel enables statistical process control over dielectric homogeneity across multi-layer lamination runs.
- Position the substrate panel inside a temperature-controlled test chamber stabilized at 25 degrees Celsius.
- Connect high-bandwidth TDR probes with sub-10 picosecond rise times to the panel edge skew coupon.
- Inject differential step pulses down both conductor legs simultaneously while recording reflection profiles.
- Extract localized characteristic impedance along the 100 millimeter line length at 0.5 millimeter spatial intervals.
- Calculate intrapair delay difference at the 50 percent voltage threshold point across the full line length.
- Reject panels exhibiting localized impedance deviations greater than +/- 2.5 ohms or total skew exceeding 1.0 picosecond.
Applying IPC-6012 Class 3/3A performance clauses mandates strict adherence to coupon-based phase skew acceptance limits on all production panels.

Contract
Material pricing and panel yields determine the commercial viability of advanced packaging substrates. High-frequency center materials carrying low-Dk glass and spread fabric options command significant cost premiums over standard FR-4 grade laminates. Sourcing teams balance dielectric performance requirements against overall landed board costs during procurement cycles.

Yield Losses and Sourcing Premiums for Homogeneous Substrates
Standard E-glass package center materials cost approximately $85 per panel in standard production volumes. Upgrading to an L-glass spread fabric substrate increases panel material cost to $215 per panel. Non-woven build-up films or glass-free center substrates elevate panel costs further, reaching $340 per panel.
The material cost premium reflects specialized glass filament drawing, chemical purification, and mechanical spreading operations at the mill level.
Rotated array layouts introduce an additional panel efficiency penalty. Tilting substrate patterns by 11 degrees on a square manufacturing panel wastes panel edge real estate, reducing yields per panel by 14 percent. This loss increases unit board cost proportionally.
High-speed package specifications that mandate both spread glass and off-axis layout incur combined price increases of 40 to 60 percent relative to standard parallel packaging designs.

Fabrication Notes and Acceptance Dossiers for High Frequency Cores
Procurement documentation must convey clear technical parameters to bare-board fabricators. Standard fabricator notes referencing generic IPC slash sheets allow shops to substitute equivalent weaves that may compromise spatial dielectric integrity. Explicit drawing notes must dictate glass weave styles, minimum off-axis routing angles, and maximum allowable intrapair skew per centimeter of line length.
Acceptance dossiers accompanying panel shipments must include TDR coupon test data, micro-section inspection reports, and certificate of compliance records for dielectric constant stability. When panel lots pass bulk electrical testing but fail high-frequency phase alignment during final packaged IC test, clear fabrication notes establish legal recourse for lot rejection and commercial remedies.
| Substrate Class | Base Material Cost ($/Panel) | Rotated Layout Scrap Factor | TDR Skew Test Pass Rate | Relative Landed Unit Cost Factor |
|---|---|---|---|---|
| Standard E-Glass (1080) | $85.00 | 0% | 65% | 1.00 (Baseline) |
| Spread E-Glass (1078) | $140.00 | 0% | 88% | 1.28 |
| Spread L-Glass (1078) | $215.00 | 14.5% Loss | 98% | 1.75 |
| Spread NE-Glass (1035) | $270.00 | 14.5% Loss | 99% | 2.10 |
| Glass-Free Silica ABF Film | $340.00 | 0% | 99.5% | 2.45 |
Fabrication suppliers often claim that standard lamination techniques achieve sufficient dielectric consistency without requiring off-axis array rotation. Experience shows that un-rotated standard glass builds introduce high skew failure rates during PAM4 functional testing. Sourcing teams enforce explicit material and layout requirements in purchase contracts to ensure high-frequency package yield stability.