Interconnect Stress Testing Validation for Multi-Layer High Density PCB Microvias
Interconnect Stress Testing isolates microvia target pad separation and barrel cracking by applying direct DC thermal cycling to HDI coupons.
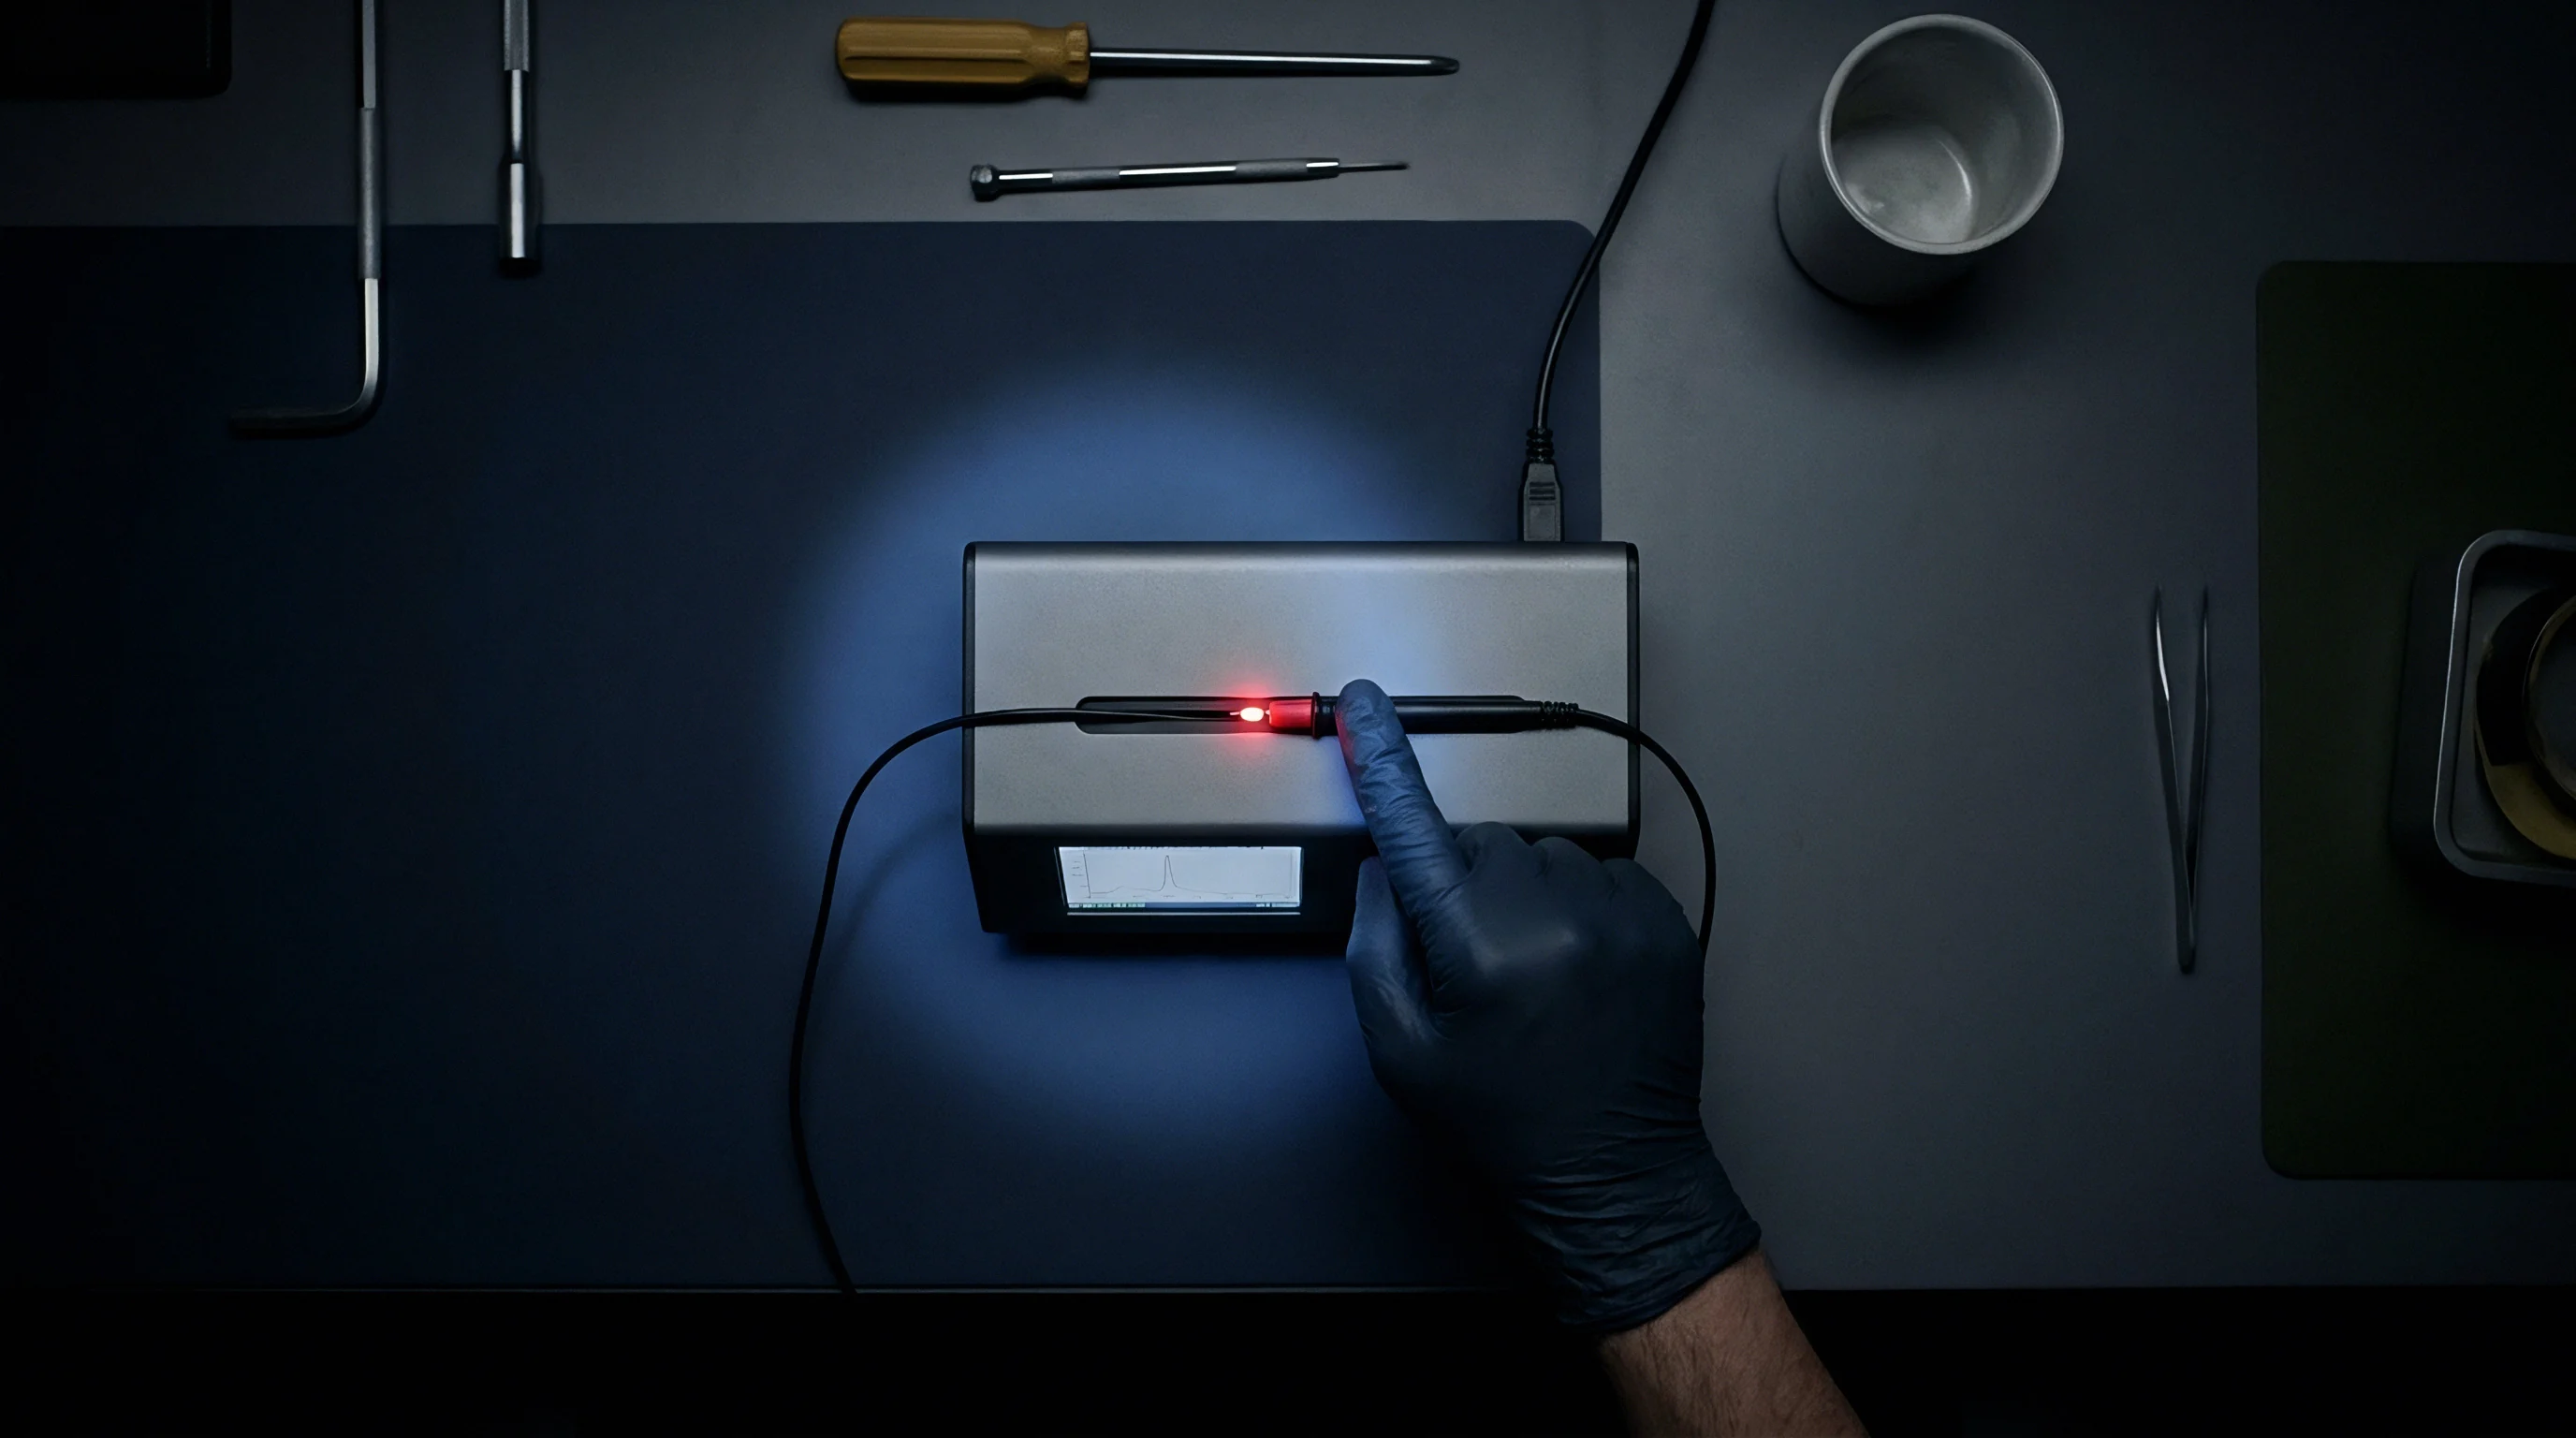

Pulse
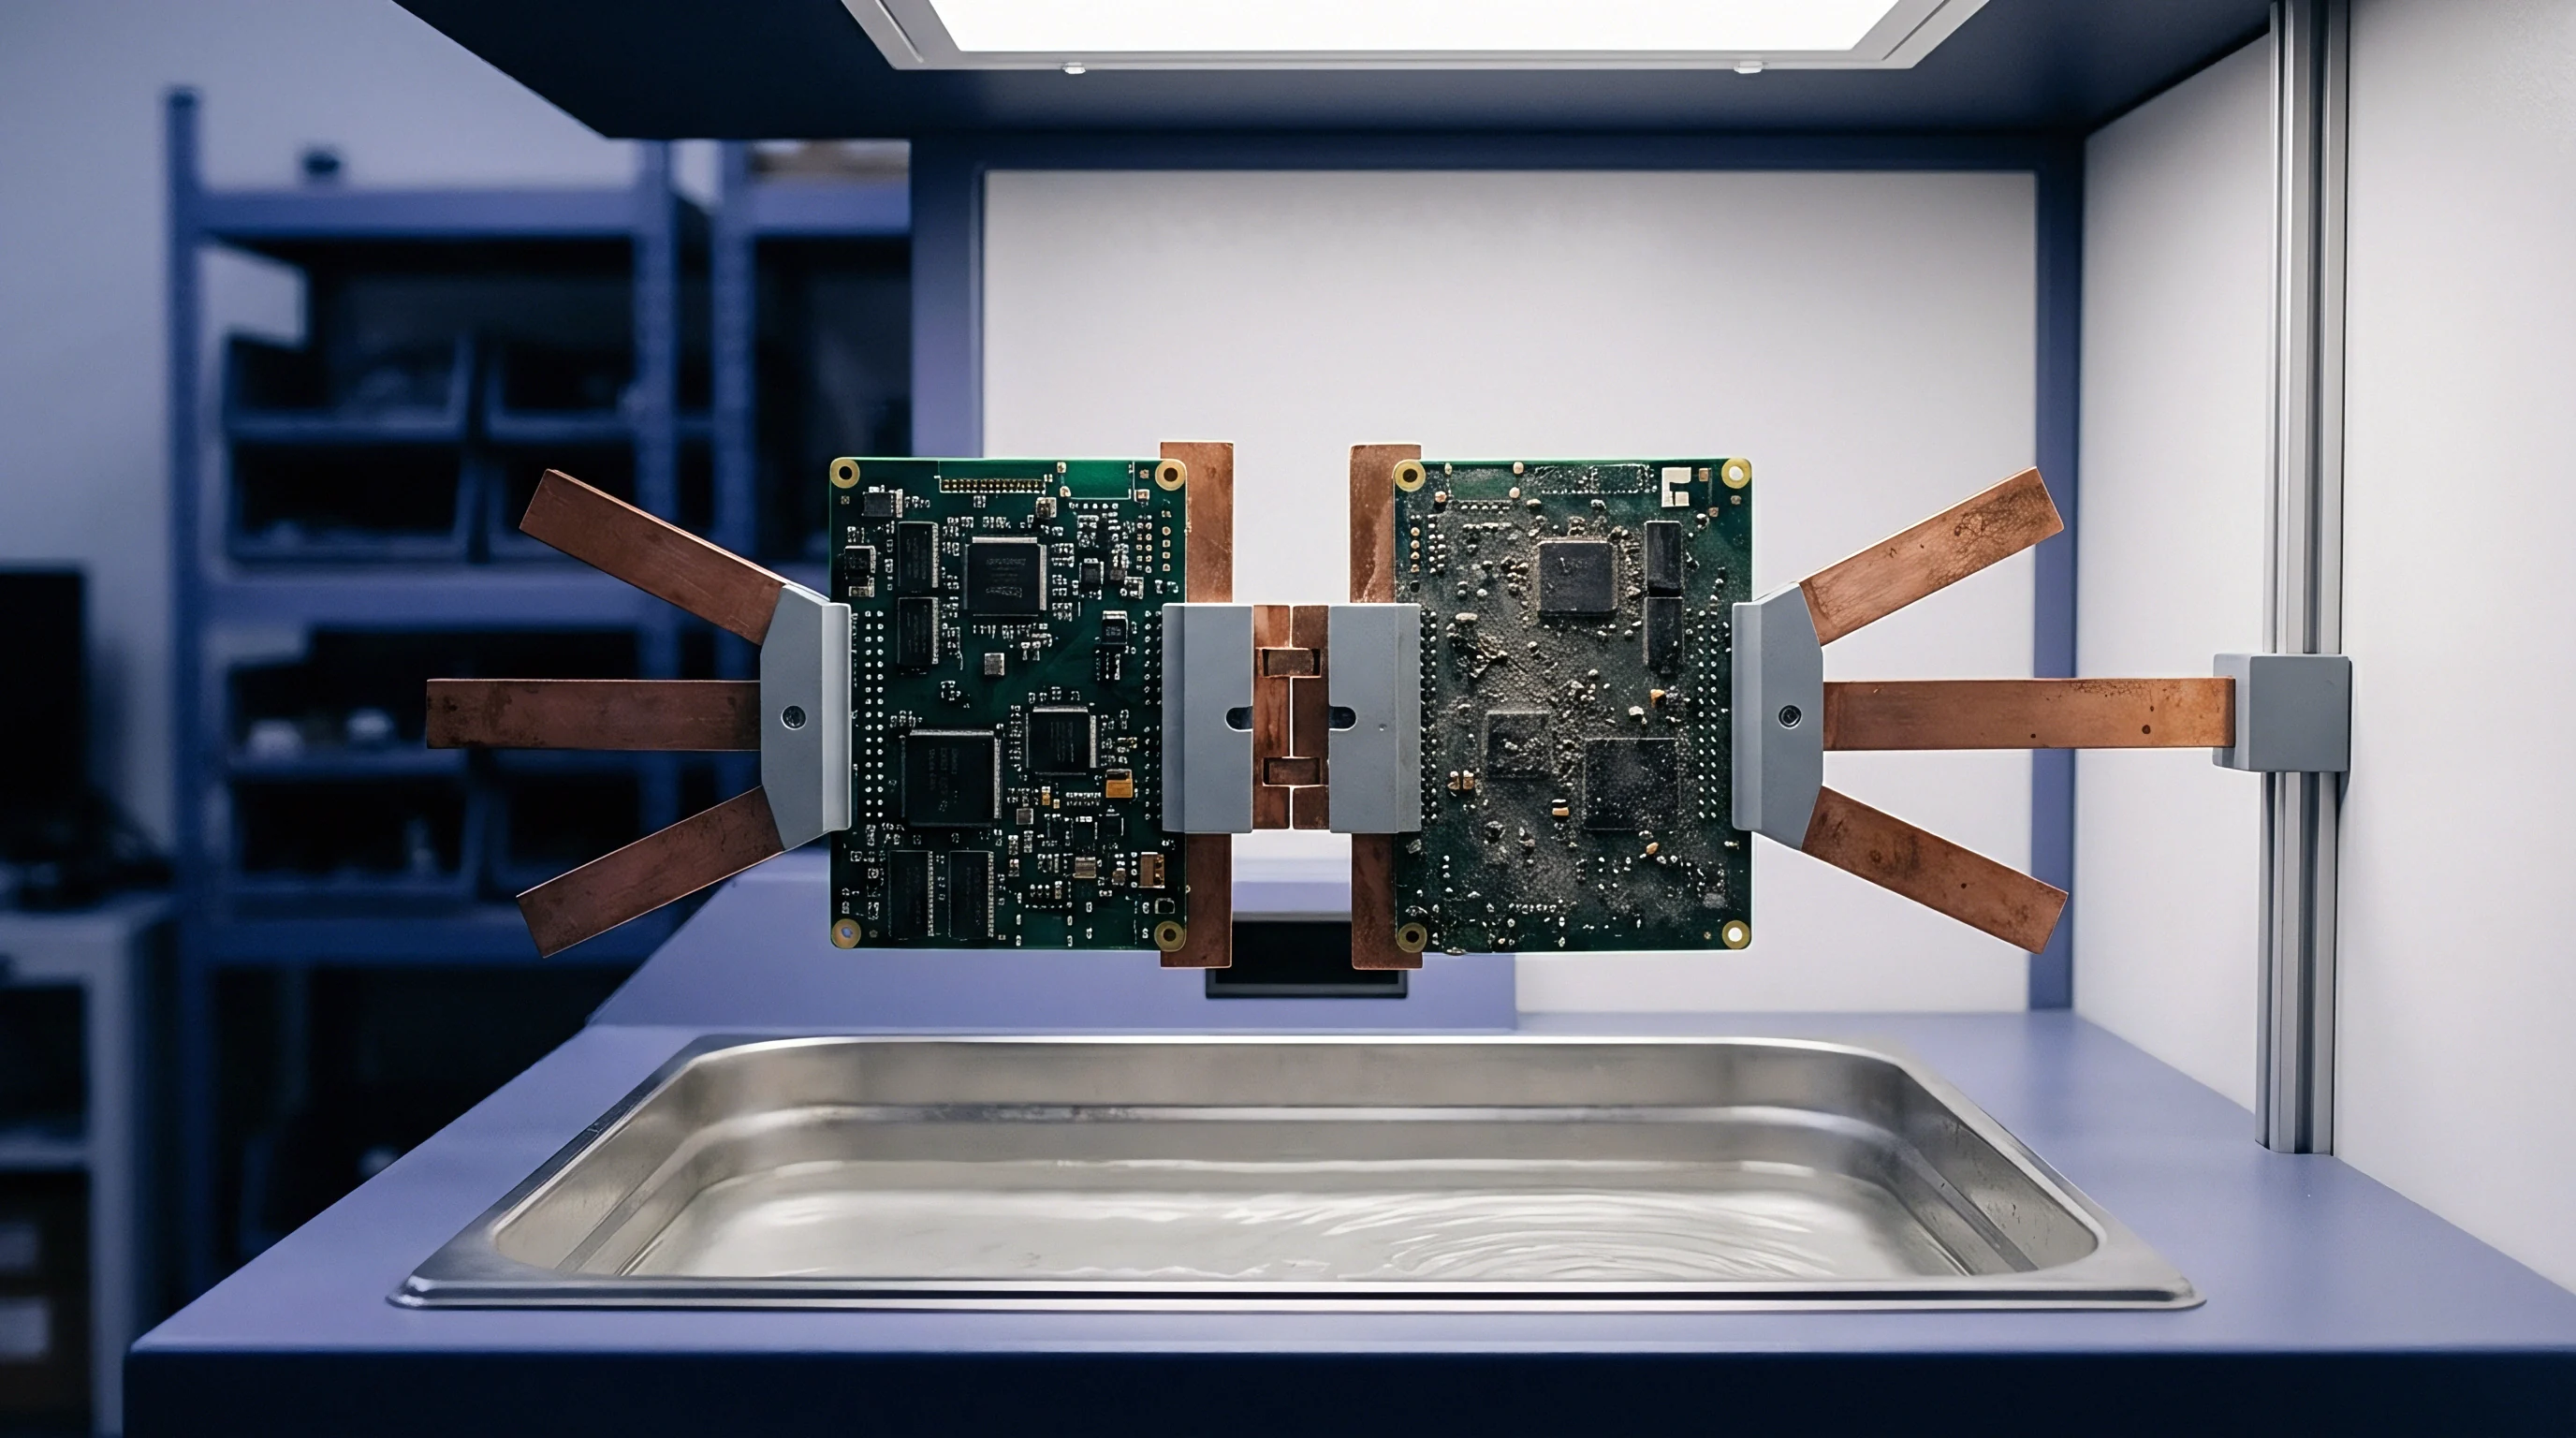
Interconnect Stress Testing isolates microvia structural vulnerabilities by driving direct high-amperage current through coupon traces, inducing rapid internal resistance heating without relying on environmental air transfer. Conventional thermal chamber testing subjects entire printed circuit board assemblies to external heating and cooling cycles, operating at slow ramp rates between 2 and 5 degrees Celsius per minute. Direct current heating inside an Interconnect Stress Testing (IST) machine elevates internal copper temperature from ambient to 150 degrees Celsius within 30 seconds, achieving ramp rates exceeding 150 degrees Celsius per minute.
Direct current heats internal traces. Rapid thermal expansion forces the glass-reinforced resin matrix to expand along its out-of-plane z-axis, applying extreme tensile stress directly to blind and buried microvias.
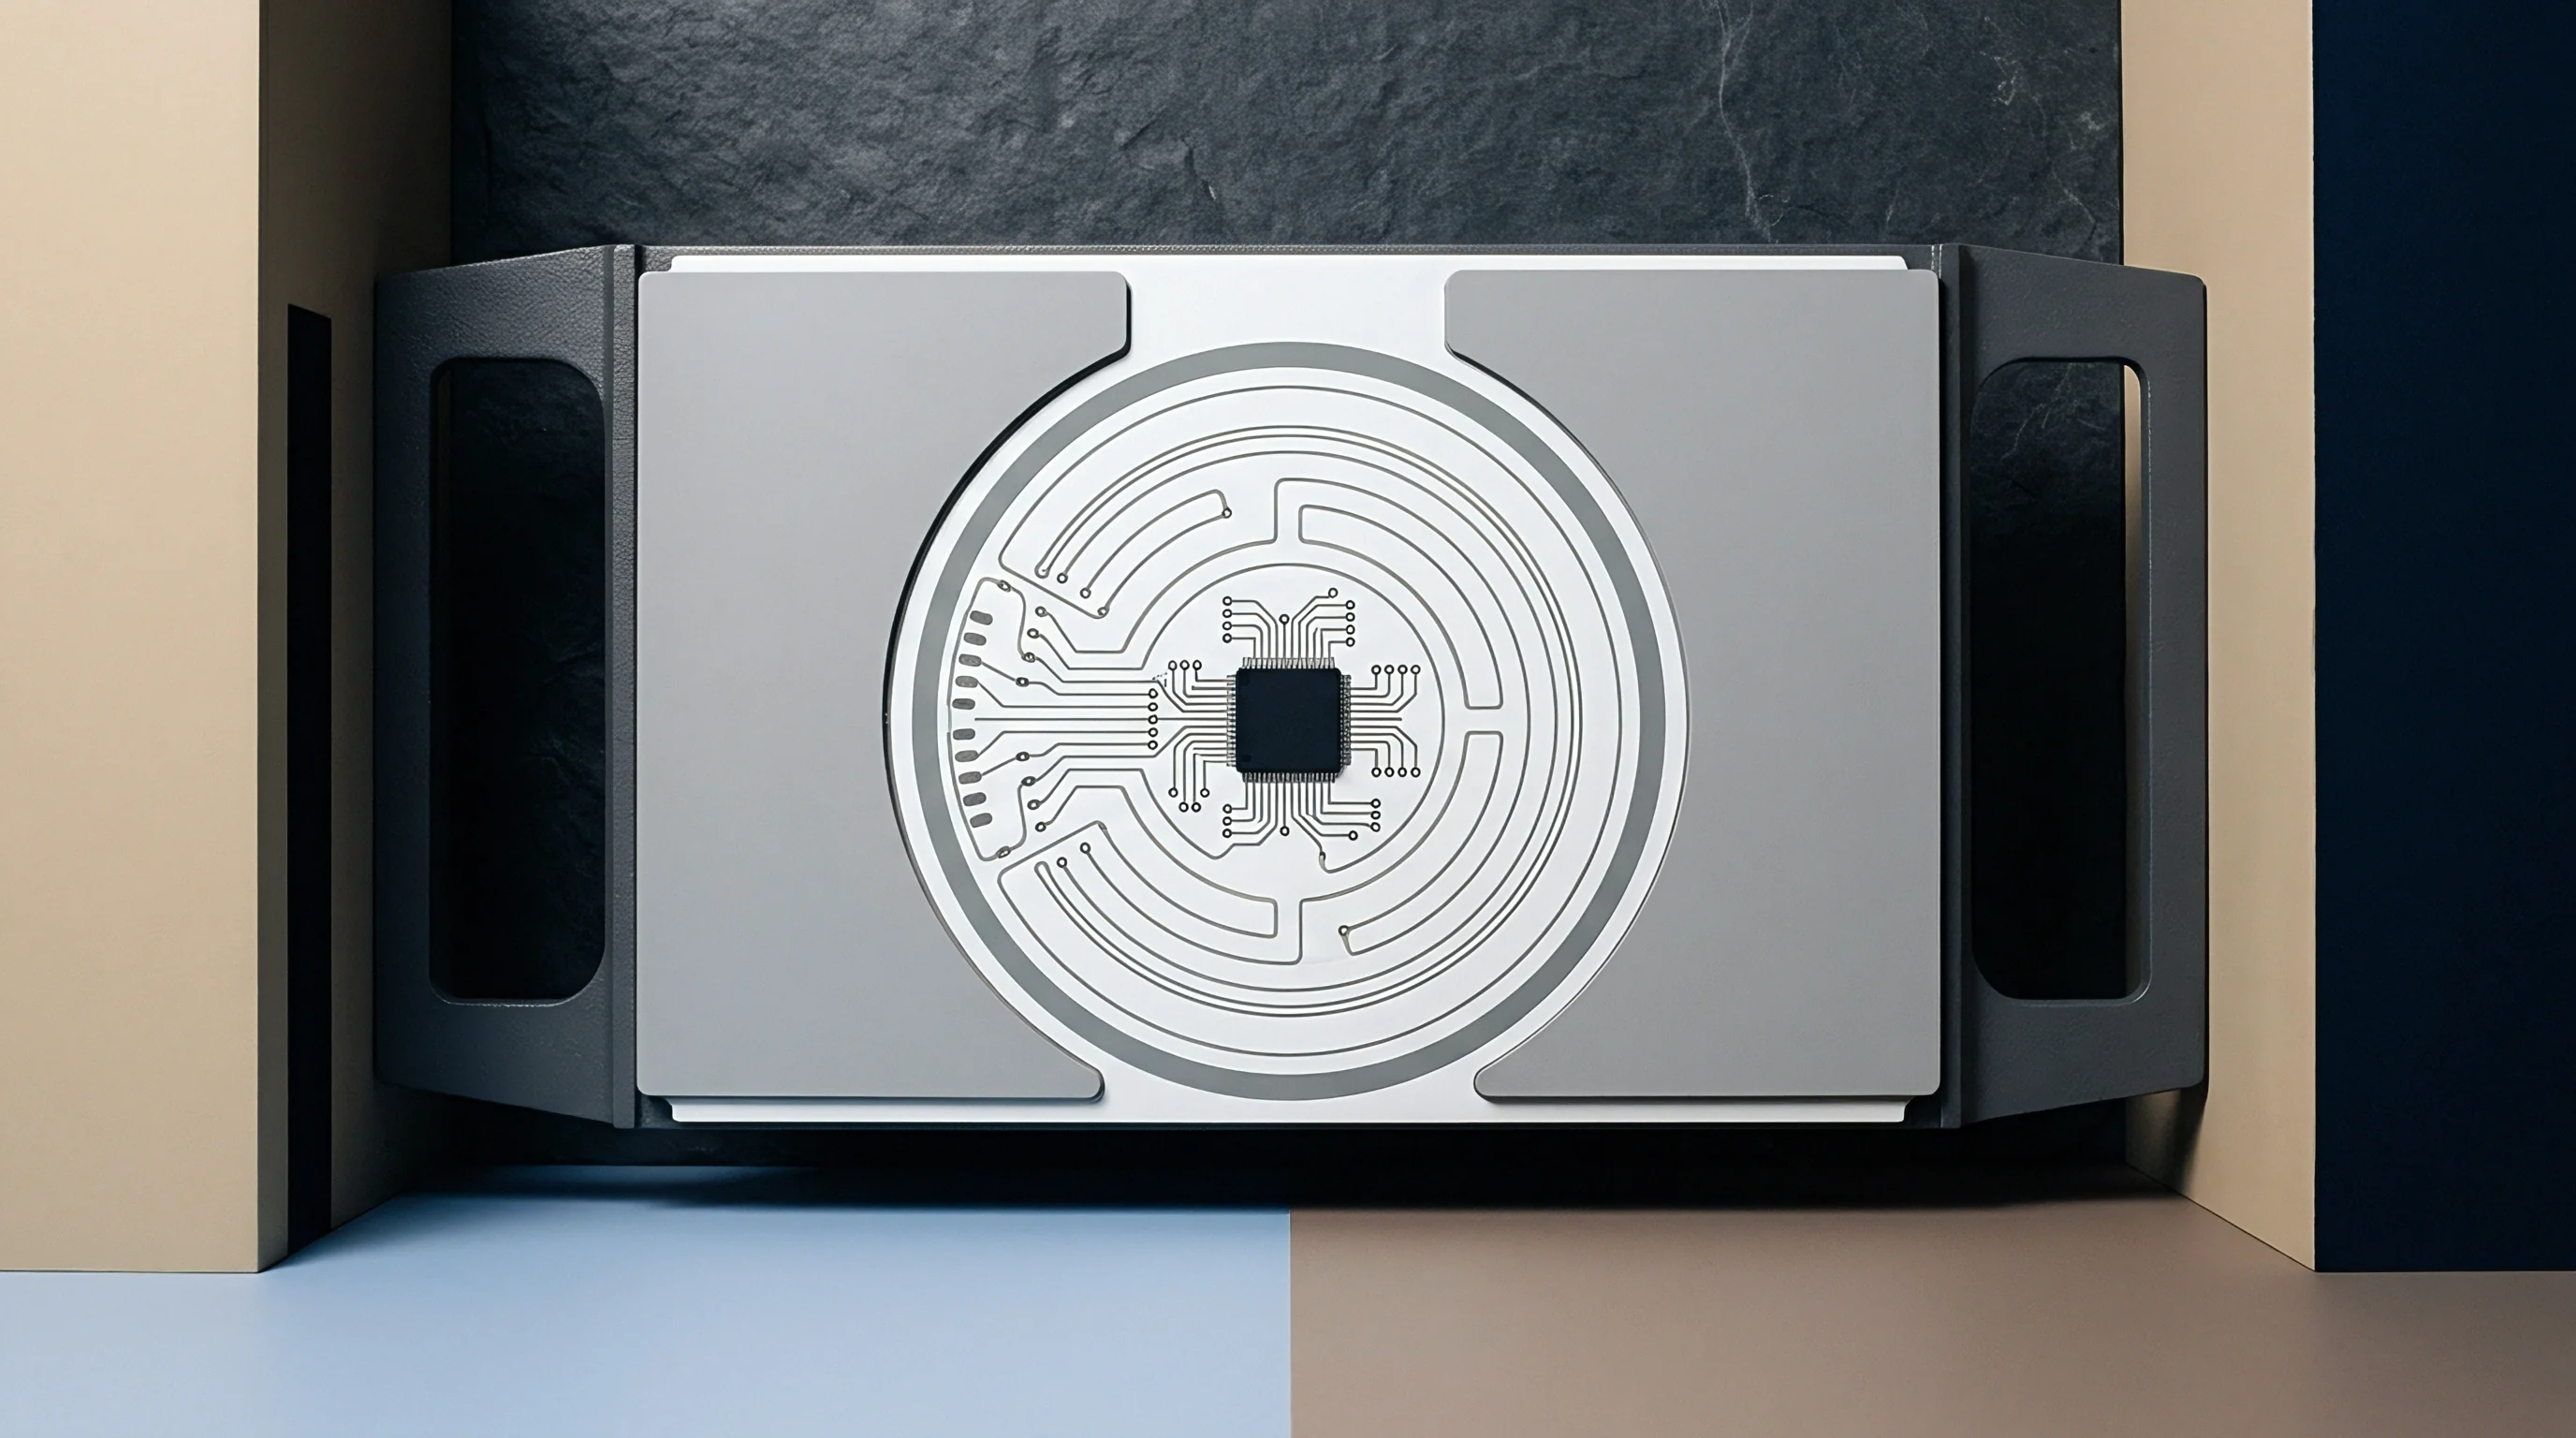
Direct Resistance Heating versus Chamber Cycling
Thermal acceleration efficiency determines how rapidly a test regime identifies latent structural plating flaws. Microvias fail under thermal stress. Environmental thermal chambers require hours to complete a single temperature excursion cycle, causing thermal degradation of surface laminates while delivering low mechanical strain rates to internal interconnects.
IST targets the metal structure directly. Power circuits embedded within specialized test coupons generate localized Joule heating, while adjacent Sense circuits monitor small voltage drops across microvia chains using four-wire Kelvin connections. Cooling occurs through targeted forced air directed over the coupon surface, reducing temperature back to 25 degrees Celsius within 120 seconds.
This combination of targeted DC heating and forced convection allows an IST test engine to complete up to 400 thermal cycles per 24-hour period.
The speed of IST cycles alters how materials respond mechanically. High thermal ramp rates prevent dielectric matrix stress relaxation through viscoelastic creep. Under slow chamber cycling, epoxy resin relaxes under strain, dampening the peak stress delivered to electroplated microvia target pads.
IST thermal pulsing forces the copper deposit to absorb the entire thermo-mechanical displacement generated by z-axis thermal expansion mismatch between copper and laminate. Plating defects ruin HDI yields. The high strain rate isolates weak interfaces, such as electrodeless copper seed layers, target pad interfaces, and barrel wall corner transitions, long before bulk thermal degradation alters the dielectric matrix.
Microvias subject to high thermal expansion mismatch fail predominantly at the target pad interface rather than along the electroplated barrel wall.

Thermal Expansion Strain in High Density Interconnects
High Density Interconnect (HDI) structures concentrate microvias across thin dielectric layers, multiplying local strain fields during reflow and operating temperature spikes. Dielectric resins exhibit a coefficient of thermal expansion (CTE) ranging from 45 to 65 parts per million per degree Celsius below their glass transition temperature (Tg), expanding to 250 to 350 ppm per degree Celsius above Tg. Electrodeposited copper maintains a stable CTE of approximately 17 ppm per degree Celsius. Thermal expansion drives z-axis strain.
This expansion differential induces severe shear and tensile stress concentrations at the microvia base, where the thin plated copper wall lands on the underlying copper capture pad.
| Test Parameter | Interconnect Stress Testing (IST) | Air-to-Air Thermal Shock | Liquid-to-Liquid Thermal Shock |
|---|---|---|---|
| Heating Mechanism | Direct DC Resistance Joule Heating | Convective Hot Air Chamber Transfer | Conductive Liquid Submersion |
| Thermal Ramp Rate | 120 to 180 degrees C / min | 10 to 30 degrees C / min | 50 to 100 degrees C / min |
| Cycle Duration | 3 minutes per cycle | 30 to 60 minutes per cycle | 10 to 20 minutes per cycle |
| Monitoring Method | Continuous 4-Wire Milliohm Logging | Intermittent Offline Resistance Checks | In-Situ Discrete Resistance Channels |
| Failure Isolation | Real-time thermal curve signatures | Post-test electrical verification | Post-test electrical verification |
Microvia failures stem from specific thermo-mechanical drivers embedded within the multi-layer stackup design and fabrication process:
- Z-Axis Expansion Mismatch Differential expansion between high-CTE dielectric resin and low-CTE copper plating forces microvia barrels to elongate vertically during heating cycles.
- Plating Grain Discontinuity Epitaxial growth mismatches between electroless seed copper layers and secondary electrodeposited copper create planar weakness planes along target pads.
- Post-Reflow Residual Stress Multiple lead-free reflow passes at 260 degrees Celsius accumulate residual strain within inner-layer copper interfaces prior to operational deployment.
- Aspect Ratio Strain Focus Microvias with aspect ratios exceeding 0.8:1 experience higher central barrel stress concentrations due to uneven plating thickness distribution across blind hole walls.
Fabrication shops often brush off early microvia failures on IST coupons, arguing that a 150-degree-per-minute DC ramp rate subjects internal copper to artificial thermal shock profiles that never occur during standard field deployment.

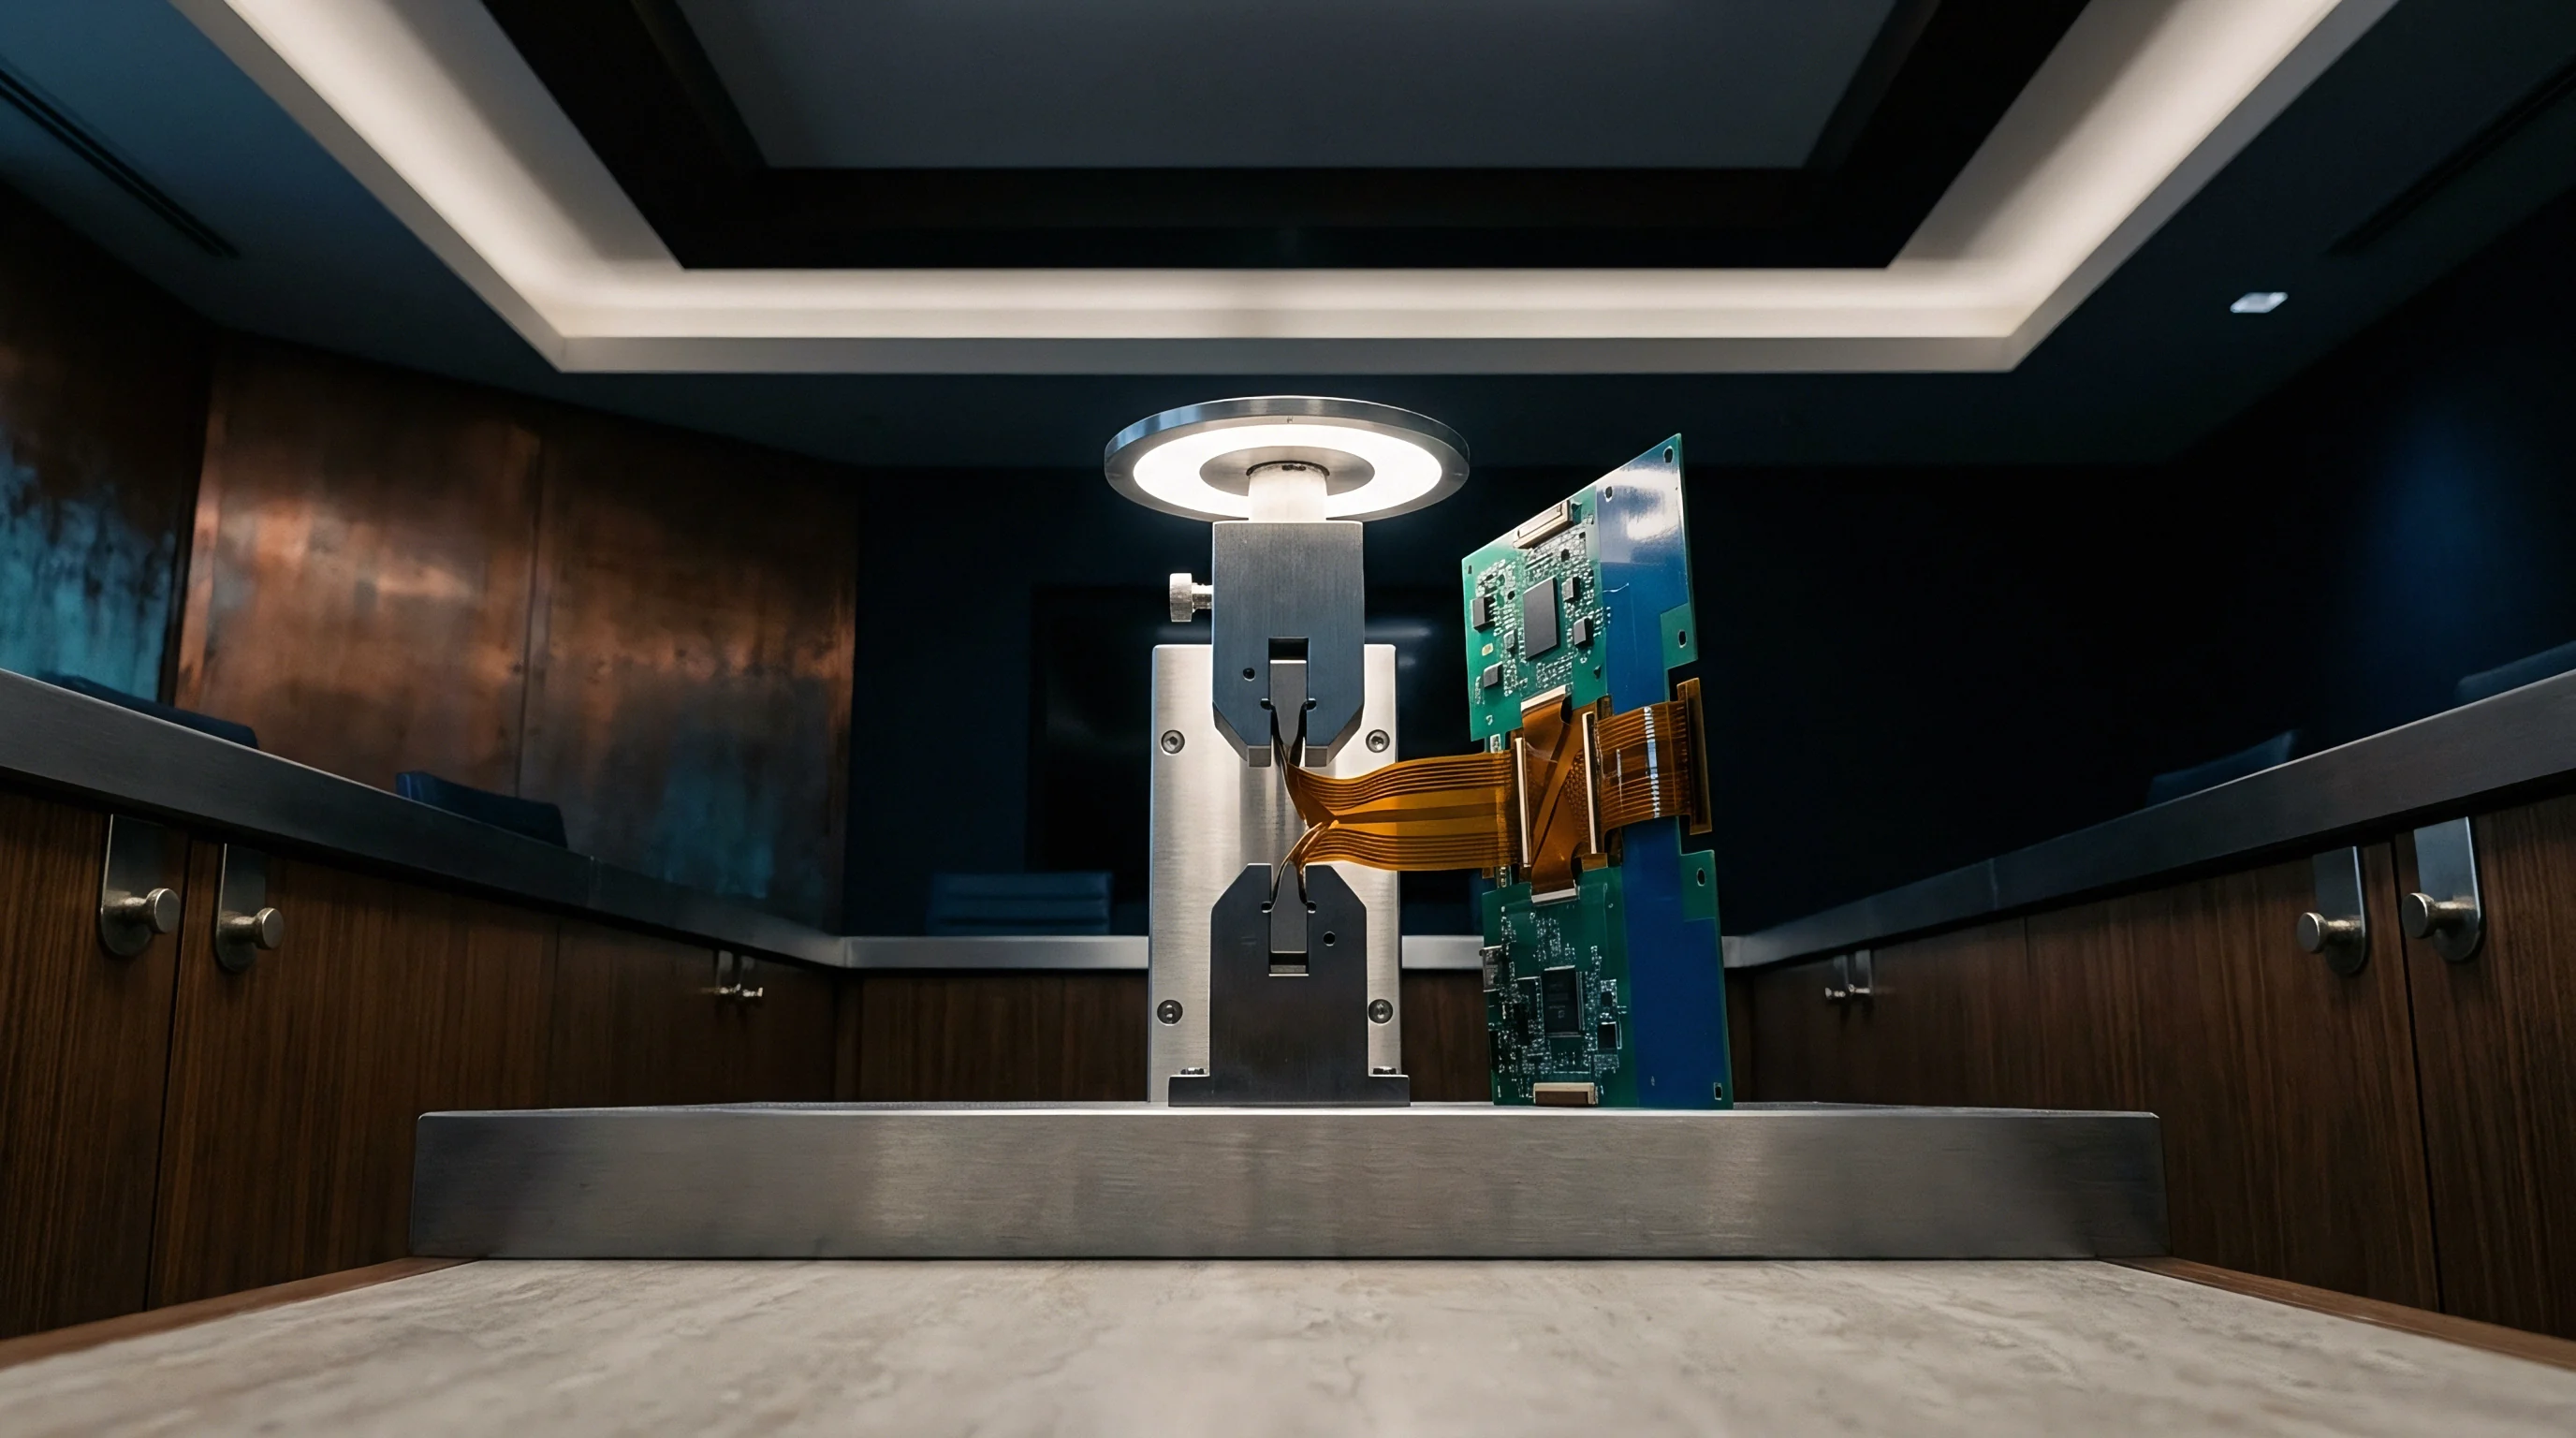
Morphology
Microstructural analysis of microvia failure modes reveals clear metallurgical signatures that differentiate thermo-mechanical fatigue from manufacturing defects. Blind microvias formed by laser direct drilling rely on precise laser pulse power to ablate resin without damaging underlying target copper pads. Post-drill desmear operations clean organic residues from the target pad surface prior to electroless copper deposition.
Defects occurring during drilling, desmear, micro-etching, or electroplating manifest as distinct mechanical failure geometries when subjected to thermal cycling stress.
Microvia Fracture Topographies and Failure Pathways
Inner layer separation, commonly termed target pad separation, represents the most severe microvia defect mode in multi-layer HDI circuits. Microvoids initiate early target separation. Failure occurs along the planar interface between the electroplated microvia copper wall and the underlying inner-layer target copper pad.
Chemical residues left behind by inadequate desmear processing create low-adhesion regions across the pad surface. During thermal cycling, z-axis dielectric expansion pulls the microvia barrel upward, shear-fracturing the weak chemical interface. Microsections pulled from failed coupons display complete horizontal separation across the target pad interface, often showing clean separation without ductile necking of the copper deposit.
Corner cracking occurs at the top transition junction where the microvia wall flares outward onto the outer capture pad. Laser drilling creates a sharp corner radius at this transition point. High local stress concentrations accumulate at this geometric discontinuity.
As the dielectric matrix expands, cyclic bending strain concentrates directly at the corner, initiating microcracks that propagate through the thickness of the electrodeposited copper wall. Barrel walls crack under shear. Microsection analysis under high magnification reveals transgranular fatigue fractures exhibiting characteristic stress-striation patterns across the copper grain structure.
Plating thickness governs fatigue resistance. Microvoiding within electrodeposited copper deposits accelerates localized failure by reducing effective load-bearing cross-sectional area. Gas entrapment during electroless copper plating or organic brightener breakdown during electroplating produces sub-micron voids within the copper matrix.
Under cyclic thermal loading, these voids coalesce into planar micro-cracks under tensile stress, accelerating fatigue life degradation.
A 10 percent resistance increase across an IST microvia coupon during thermal cycling correlates to a 50 percent reduction in copper cross-sectional area.
How Do Thermal Expansion Mismatches Accelerate Microvia Interconnect Fatigue?
Consider a 12-layer High Density Interconnect PCB utilizing a 1-N-1 sequential build-up stackup with stacked microvias spanning Layer 1 to Layer 3. The structural geometry incorporates a microvia target pad diameter of 150 micrometers, an electroplated copper wall thickness of 20 micrometers, and a dielectric out-of-plane coefficient of thermal expansion of 55 ppm per degree Celsius below glass transition temperature (170 degrees Celsius). The total dielectric thickness between Layer 1 and Layer 3 equals 120 micrometers.
During an IST cycle operating from 25 to 150 degrees Celsius, the temperature differential equals 125 degrees Celsius.
Total unconstrained z-axis expansion of the dielectric layer across this temperature differential is calculated as:
Dielectric Elongation = 120 micrometers x 55 x 10^-6 / degree C x 125 degrees C = 0.825 micrometers.
Unconstrained expansion of the copper microvia structure across the same thermal differential is calculated as:
Copper Elongation = 120 micrometers x 17 x 10^-6 / degree C x 125 degrees C = 0.255 micrometers.
The total mechanical displacement mismatch imposed upon the microvia structure equals 0.570 micrometers per thermal cycle. Because the rigid copper target pad anchors the base of the microvia, this displacement translates into a total plastic strain range of approximately 0.475 percent across the microvia barrel and target pad joint. Applying the Coffin-Manson low-cycle fatigue model for electrodeposited copper, a plastic strain range of 0.475 percent per cycle limits microvia fatigue life to approximately 450 thermal cycles before microcrack initiation triggers a 10 percent continuous resistance shift.
Standard acceptance protocols establish a 10 percent direct-current resistance increase across a series-connected coupon microvia chain as the absolute threshold for structural failure. This 10 percent limit rests on high-frequency 4-wire Kelvin sensing applied to 100-microvia series chains under controlled ambient temperature. Shifting the failure threshold to 5 percent catches early micro-crack initiation but introduces measurement noise sensitivity, while extending the threshold to 20 percent permits partial crack propagation to grow into complete electrical open circuits during testing.
Microsectioning of failed coupons categorizes structural defect geometries into four distinct physical classes:
- Inner Layer Separation Horizontal separation cracking along the planar boundary between electroplated copper wall deposition and the underlying inner-layer target land.
- Corner Wall Fracture Fatigue fracture extending through the electroplated copper thickness at the upper shoulder radius where the microvia joins the capture pad.
- Barrel Wall Strain Voiding Coalescence of sub-micron electroplating voids along localized high-strain regions within electrodeposited copper barrel plating.
- Target Pad Lift Physical delamination and upward deflection of the underlying copper target land away from the supporting resin laminate matrix.
Omitting microvia microstructural verification allows latent plating separation to slip through factory testing, producing intermittent high-resistance open circuits on populated assemblies in field operation.

Protocol
Execution of validation testing using IPC-TM-650 Method 2.6.26 requires strict control over test coupon geometry, preconditioning cycles, and electrical measurement parameters. Standard production PCBs cannot undergo direct IST testing because heating requires specific, continuous resistive circuit loops with matched electrical resistances. Dedicated coupons placed on production panel borders replicate the exact layer stackup, drilling parameters, chemistry bath history, and electroplating parameters of the primary circuit board batch.
Coupon Design and Panel Placement Rules
IST coupons utilize standardized layout geometries designated as IPC-2221 coupons or specialized vendor formats such as S1197 layout structures. Each coupon incorporates two independent continuous trace circuits: a Power Circuit and a Sense Circuit. The Power Circuit contains resistive trace paths designed to generate uniform heat when energized by direct current.
The Sense Circuit links microvias or multi-layer via structures in continuous daisy-chain configurations using high-density routing across inner layers.
Panel layout rules mandate placing at least two IST coupons on opposing diagonal corners of every manufacturing panel. Edge-to-center plating variations across electroplating tanks introduce copper thickness gradients across the panel surface. Placement at opposing corners captures the minimum and maximum electroplated copper thickness extremes.
Coupons must feature identical microvia drill diameters, laser pulse profiles, desmear dwell times, and copper plating thicknesses as the primary active circuit area.
Preconditioning Reflow Profiles and Baseline Calibration
Prior to thermal resistance cycling, coupons undergo preconditioning to simulate the assembly reflow environment. Reflow passes induce latent damage. Lead-free surface mount assembly exposes circuit boards to multiple thermal cycles reaching peak temperatures of 260 degrees Celsius.
IPC-TM-650 2.6.26 mandates subjecting test coupons to six preconditioning reflow passes (6x 260 degrees C) using a calibrated convection reflow oven prior to connecting them to the IST test console.
| Execution Variable | Class 2 Standard Board | Class 3 High Reliability | Class 3A Space / Military |
|---|---|---|---|
| Preconditioning Passes | 3 cycles at 230 degrees C | 6 cycles at 260 degrees C | 6 cycles at 260 degrees C |
| High Test Temperature (T-high) | 150 degrees C | 150 degrees C | 150 degrees C |
| Low Test Temperature (T-low) | 25 degrees C | 25 degrees C | 25 degrees C |
| Cycle Count Requirement | 500 cycles minimum | 500 cycles minimum | 1000 cycles minimum |
| Failure Resistance Threshold | 10 percent increase | 10 percent increase | 10 percent increase |
Rigorous test execution follows a sequential procedure to validate microvia structural integrity:
- Fabricate test coupons on panel coupon borders incorporating identical copper plating thickness and microvia drilling parameters as production boards.
- Perform initial DC baseline resistance measurement across Power and Sense circuits at 23 degrees Celsius using a 4-wire Kelvin bridge.
- Subject test coupons to preconditioning reflow simulations consisting of six assembly reflow cycles reaching a peak temperature of 260 degrees Celsius.
- Mount preconditioned coupons into the IST system test head and connect dedicated sensing leads to signal measurement channels.
- Apply cyclic direct current pulses to raise coupon copper temperature to 150 degrees Celsius within 30 seconds followed by 120 seconds of forced air cooling.
- Log continuous milliohm resistance values at peak heating and minimum cooling points across all cycles until a 10 percent resistance increase occurs or target cycle count reaches completion.
IPC-6012 Class 3 qualification mandates that microvia coupons endure six preconditioning reflow cycles at 260 degrees Celsius without exceeding a 10 percent resistance shift.
Standard procurement agreements invoking IPC-6012 Class 3A require immediate lot rejection whenever coupon resistance shifts beyond 10 percent prior to 500 IST cycles.
Diagnostics
Continuous milliohm resistance tracking during thermal cycling provides real-time diagnostic data that pinpoints microvia degradation mechanisms before complete electrical circuit rupture occurs. Analog voltage and current logging channels sample Sense circuit resistance at 10-millisecond intervals throughout both heating and cooling phases. Baseline milliohm values shift fast.
Plotting resistance variation (Delta R) against cycle count produces diagnostic degradation curves that distinguish fatigue crack growth from sudden interface delamination.
Real Time Milliohm Resistance Degradation Signatures
Continuous monitoring isolates transient opens. Structural defects exhibit distinct electrical signatures based on their physical mechanism. Microvia barrel fatigue cracking presents as a smooth, exponential resistance increase across hundreds of thermal cycles.
As cyclic strain propagates fatigue micro-cracks through the copper wall, the effective cross-sectional area decreases continuously, driving a gradual rise in electrical resistance during peak heating phases.
Target pad separation presents a radically different electrical signature characterized by transient resistance spikes occurring exclusively during the cooling phase. During peak heating at 150 degrees Celsius, vertical z-axis expansion of the dielectric matrix pushes the microvia structure downward against the target pad under thermal expansion pressure. As forced air cools the coupon back toward 25 degrees Celsius, the dielectric matrix contracts rapidly, pulling the microvia wall upward.
The cracked target pad interface opens mechanically during cooling, triggering abrupt milliohm resistance spikes. Upon returning to room temperature, elastic recovery brings the cracked surfaces back into physical contact, temporarily restoring low DC resistance readings during offline bench testing.
Modern high-speed interconnects rely on precise copper grain alignment, a physical property that mirrors the stress recrystallization dynamics observed in electrodeposited lithium battery current collector foils under continuous electrochemical flexing. Electrodeposited copper under cyclic thermal stress undergoes dynamic recrystallization, shifting grain orientations and altering electrical resistivity independent of gross mechanical cracking.
Weibull Life Distribution Analysis for HDI Batches
Statistical processing of cycle-to-failure data across panel coupon sets employs two-parameter Weibull distribution modeling to determine batch reliability parameters. The cumulative failure distribution function F(t) is defined as:
Failure Distribution = 1 – exp( – ( t / eta ) ^ beta )
In this equation, t represents the completed IST cycle count, eta represents the characteristic life parameter (the cycle count where 63.2 percent of the test population fails), and beta represents the Weibull shape parameter slope.
A Weibull shape parameter beta value less than 1.0 indicates infant mortality driven by gross manufacturing defects such as severe desmear residue or complete plating voids. Beta values between 1.0 and 2.0 point to random manufacturing flaws. Beta values exceeding 3.0 demonstrate classic end-of-life wearout failure caused by thermo-mechanical copper fatigue.
Evaluating beta allows quality engineers to determine whether early coupon failures stem from isolated process contamination or systemic structural under-design of the stackup.
Establishing baseline cycle-to-failure thresholds for complex multi-tier microvias remains subject to statistical variance. Baseline thermal shock targets often specify a 300-cycle threshold to first failure for 4-layer stacked microvias. The desk cannot fully defend this 300-cycle figure as an absolute universal constant because variations in resin glass-transition temperature and local copper balancing alter local strain fields by up to 40 percent.
A buyer facing this uncertainty applies a mandatory 20 percent cycle-count guardband offset to supplier qualification reports and demands destructive microsections on any coupon exhibiting resistance shifts before cycle 400.
Applying a Weibull shape parameter beta of 3.2 to electrodeposited microvia wearout distributions provides an established baseline for fatigue-dominated failure modes under IPC-TM-650 2.6.26 testing. This 3.2 shape factor rests on empirical qualification testing across 120 control batches of high-Tg FR-4 laminates subjected to 6x 260 degrees Celsius reflow preconditioning. Altering the dielectric substrate to a lower-Tg material shifts the stress state and reduces the shape factor toward 2.1, widening the failure distribution spread.
Resistance spikes occurring exclusively during the cooling phase of IST cycling signify mechanical contact loss driven by compressive elastic recovery of surrounding dielectric resin.
Reliability models continue to struggle with predicting whether localized intermetallic diffusion at the microvia target interface accelerates fatigue cracking faster than cyclic shear stress alone.

Acceptance
Validating multi-layer High Density Interconnect PCB shipments requires converting IST analytical outputs into binding commercial batch acceptance parameters. Technical files accompanying production lots carry zero legal weight if they lack traceably calibrated coupon test reports reflecting the actual panel production run. Integrating IST metrics into quality agreements establishes objective pass/fail boundary conditions that govern lot sign-off, invoice payment, and warranty liability reserves.
Technical Dossier Integration and Acceptance Thresholds
Technical files carry legal weight. A compliant quality dossier for high-reliability HDI boards includes the complete continuous IST resistance log, thermal profile plots, preconditioning reflow verification certificates, and post-test microsection optical micrographs. For IPC-6012 Class 3 applications, the technical file must confirm that all panel coupons completed a minimum of 500 IST cycles without any Sense circuit exhibiting a resistance shift exceeding 10 percent from baseline.
If an IST coupon fails prior to reaching the contracted cycle threshold, the manufacturing panel associated with that coupon is held for non-conformance review. Quality engineers perform microsectioning directly through the failed coupon microvias to confirm the failure mechanism. Detection of target pad separation, corner cracking, or inter-layer delamination results in total lot rejection of all production boards printed on that manufacturing panel.
Commercial Cost Exposure of Unvalidated Microvia Arrays
Shipping unvalidated HDI PCBs into complex electronic assembly streams creates immense financial risk for technology buyers. Field returns destroy gross margin. Microvia failures rarely manifest during initial end-of-line functional circuit testing because partial plating cracks maintain physical contact at room temperature.
Failure occurs months later in field operation as ambient thermal cycling drives crack expansion, producing intermittent system lockups, signal integrity degradation, and total operational failure.
| Evaluation Metric | IST Screening Validation Regime | Unvalidated Field Deployment |
|---|---|---|
| Testing Unit Cost | $150 to $300 per panel coupon set | $0 initial bench screening cost |
| Defect Detection Timing | Factory floor prior to board assembly | Field deployment (6 to 18 months) |
| Escaped Defect Cost Impact | Scrap value of unpopulated bare PCB | Full assembly scrap, warranty repair, freight |
| Yield Exposure Boundary | Isolated to specific defective panels | Entire production lot recall risk |
| Legal and Commercial Recourse | Immediate factory lot rejection per contract | Disputed warranty claims and customer penalties |
Unvalidated boards invite costly recalls. The economic arithmetic of microvia screening demonstrates that spending minor sums on panel-level IST validation eliminates disproportionate commercial liabilities downstream. Integrating continuous resistance monitoring into standard procurement contracts protects buyers from inheriting latent fabrication defects disguised as passing bench-test results.
Batch validation costs always scale as a tiny fraction of the landed capital lost when microvia target pad separations stall field deployment.