Deembedding Multi Port Scattering Matrices for High Speed Board Characterization
De-embedding multi-port scattering matrices removes physical fixture loss and crosstalk to extract accurate printed circuit trace performance for high-speed boards.
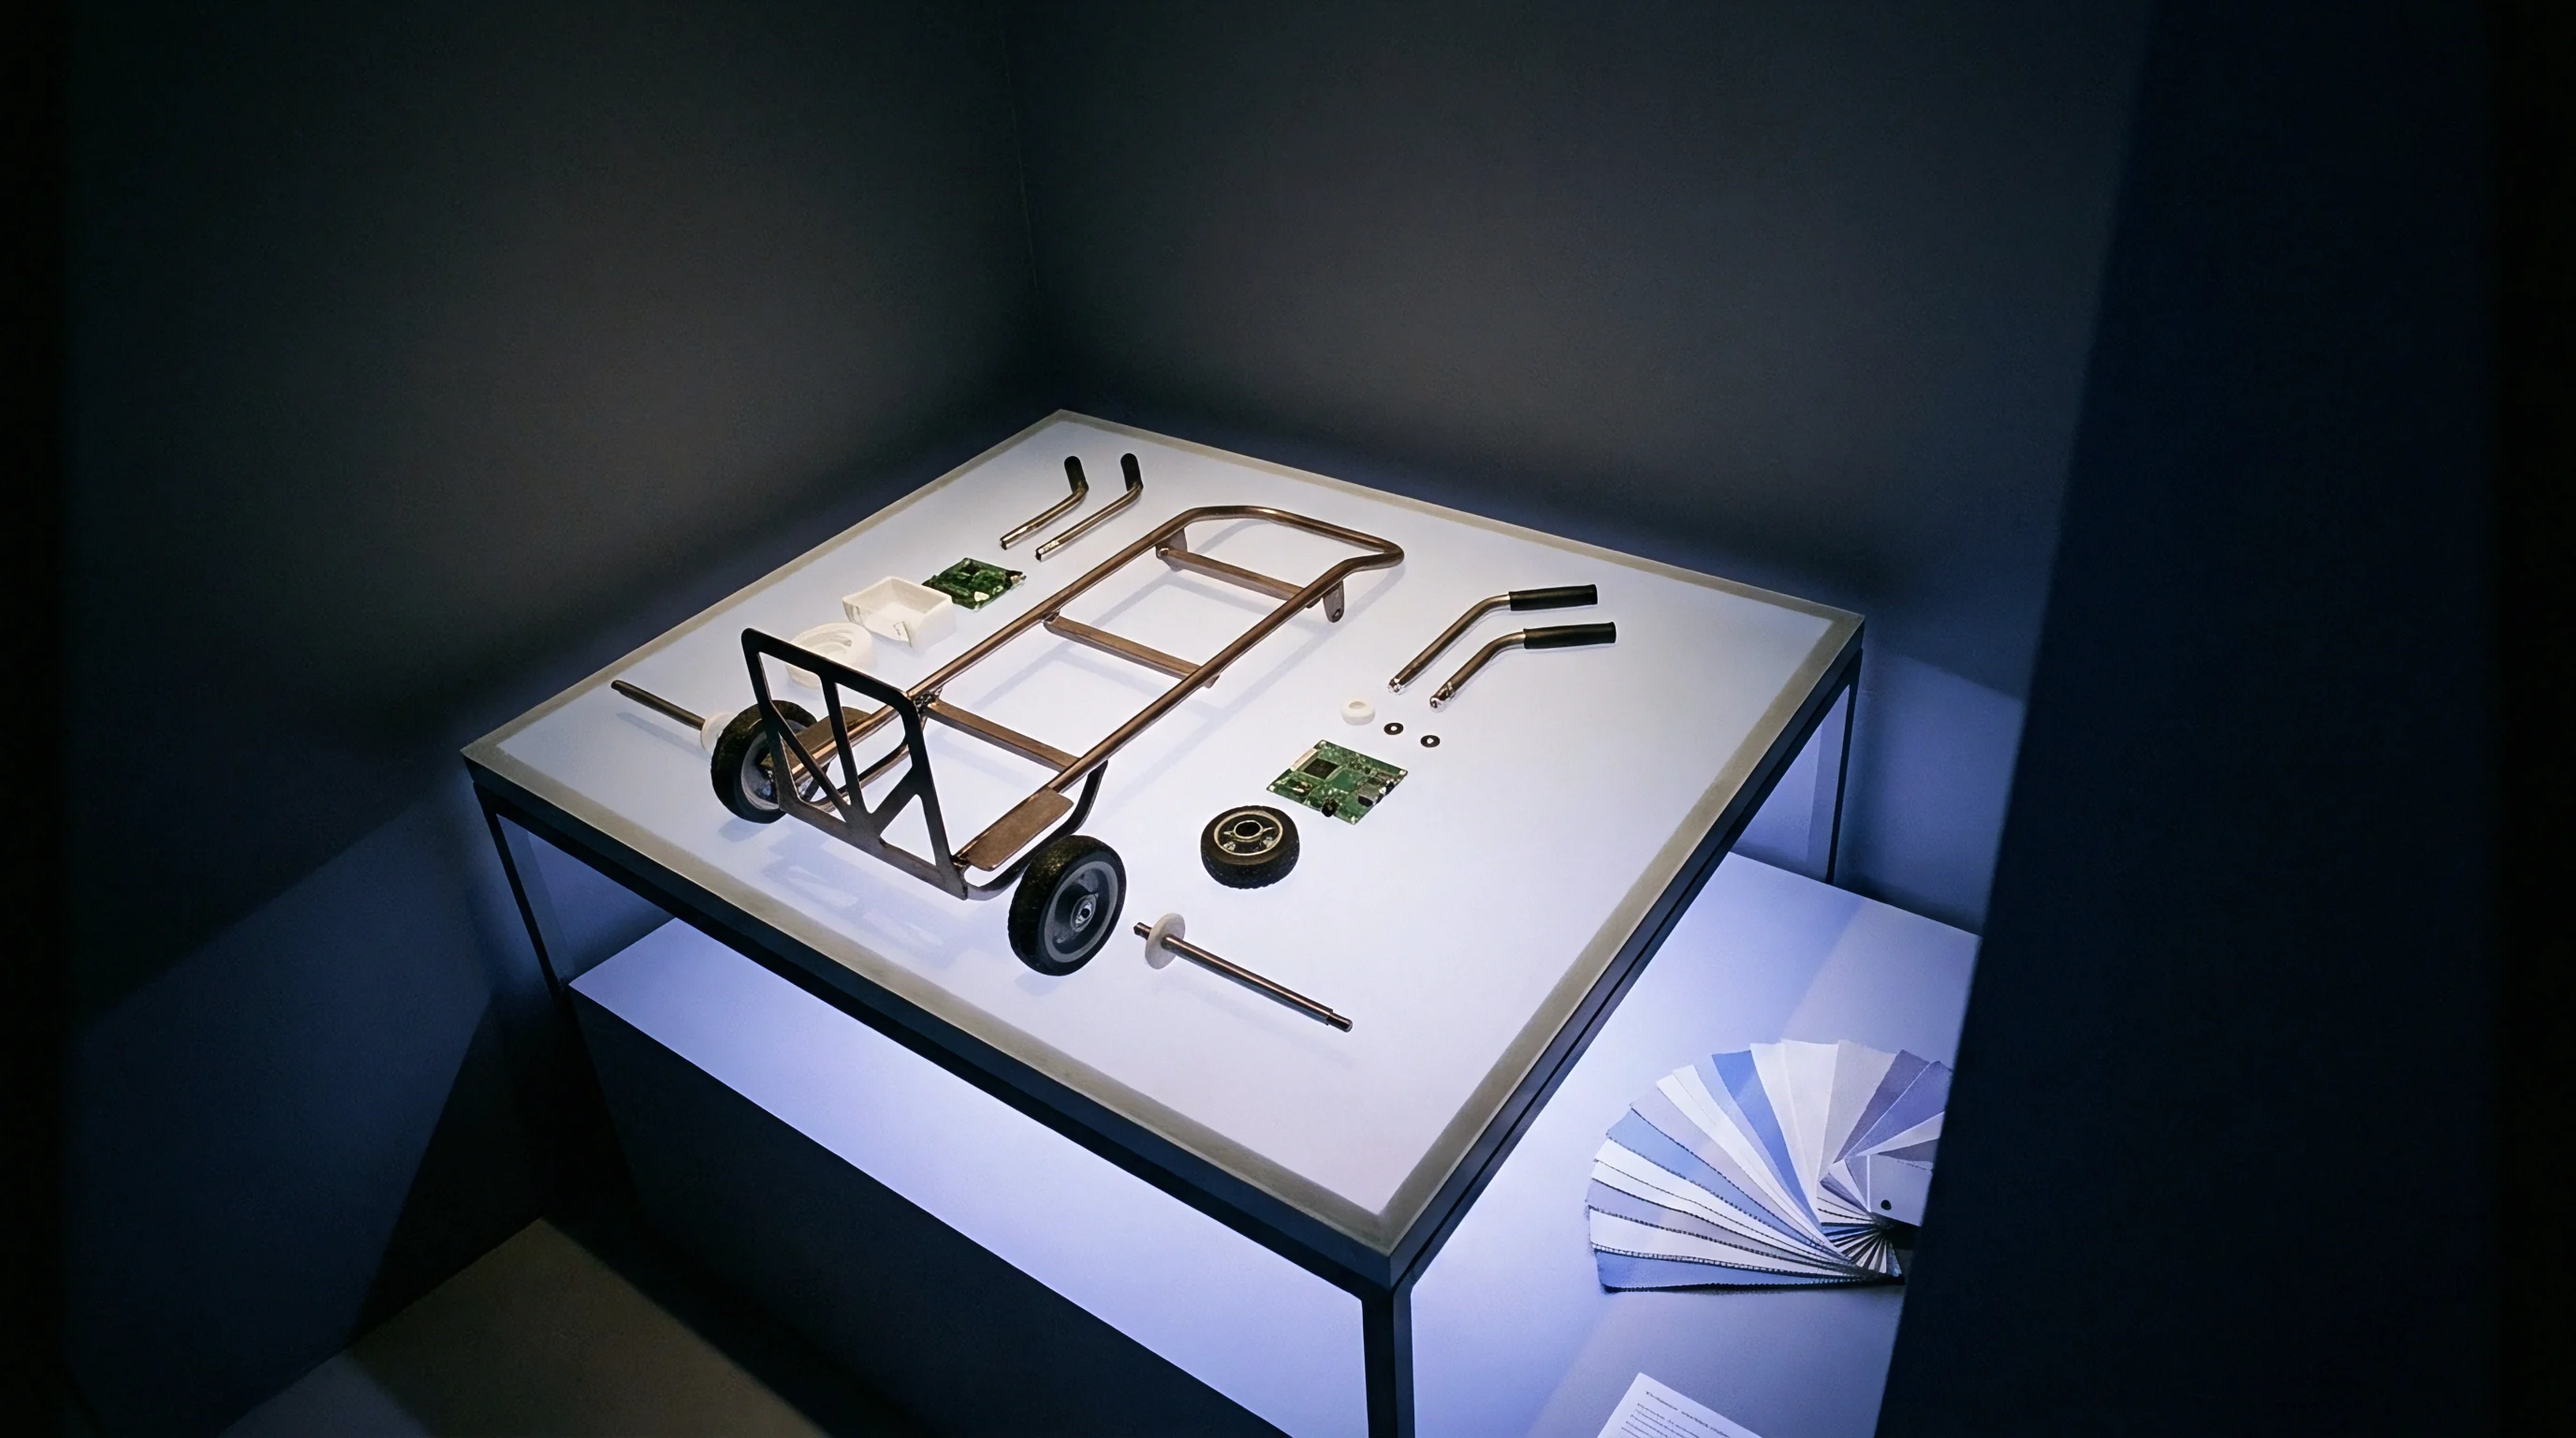

Launch
Microstrip and stripline transmission lines require transition interfaces to connect coaxial test cables to printed circuit board traces. Test fixtures introduce attenuation, phase delay, impedance discontinuities, and modal crosstalk into raw measurement data. Multi-port characterization isolates trace loss.
Vector network analyzers measure composite scattering parameters containing both test fixture behavior and printed circuit trace performance. High-density designs operating at 28 GHz Nyquist frequencies and above cannot tolerate uncorrected launch artifacts. A coaxial connector footprint, probe pad layout, or via transition distorts the true signal degradation of the board layout.
De-embedding removes these parasitic networks mathematically to yield the isolated multi-port matrix of the circuit trace.
De-embedding algorithms extract fixture loss to isolate true printed circuit trace transmission properties across high-frequency frequency sweeps.
Multi-port VNA setups for 4-port differential pairs or 8-port coupled structures rely on precise fixture modeling. Raw measurements retain launcher loss. Applying 2-port de-embedding to coupled differential traces ignores crosstalk within the launch region.
Multi-port matrix extraction isolates both differential insertion loss and mode-conversion terms across adjacent trace paths.
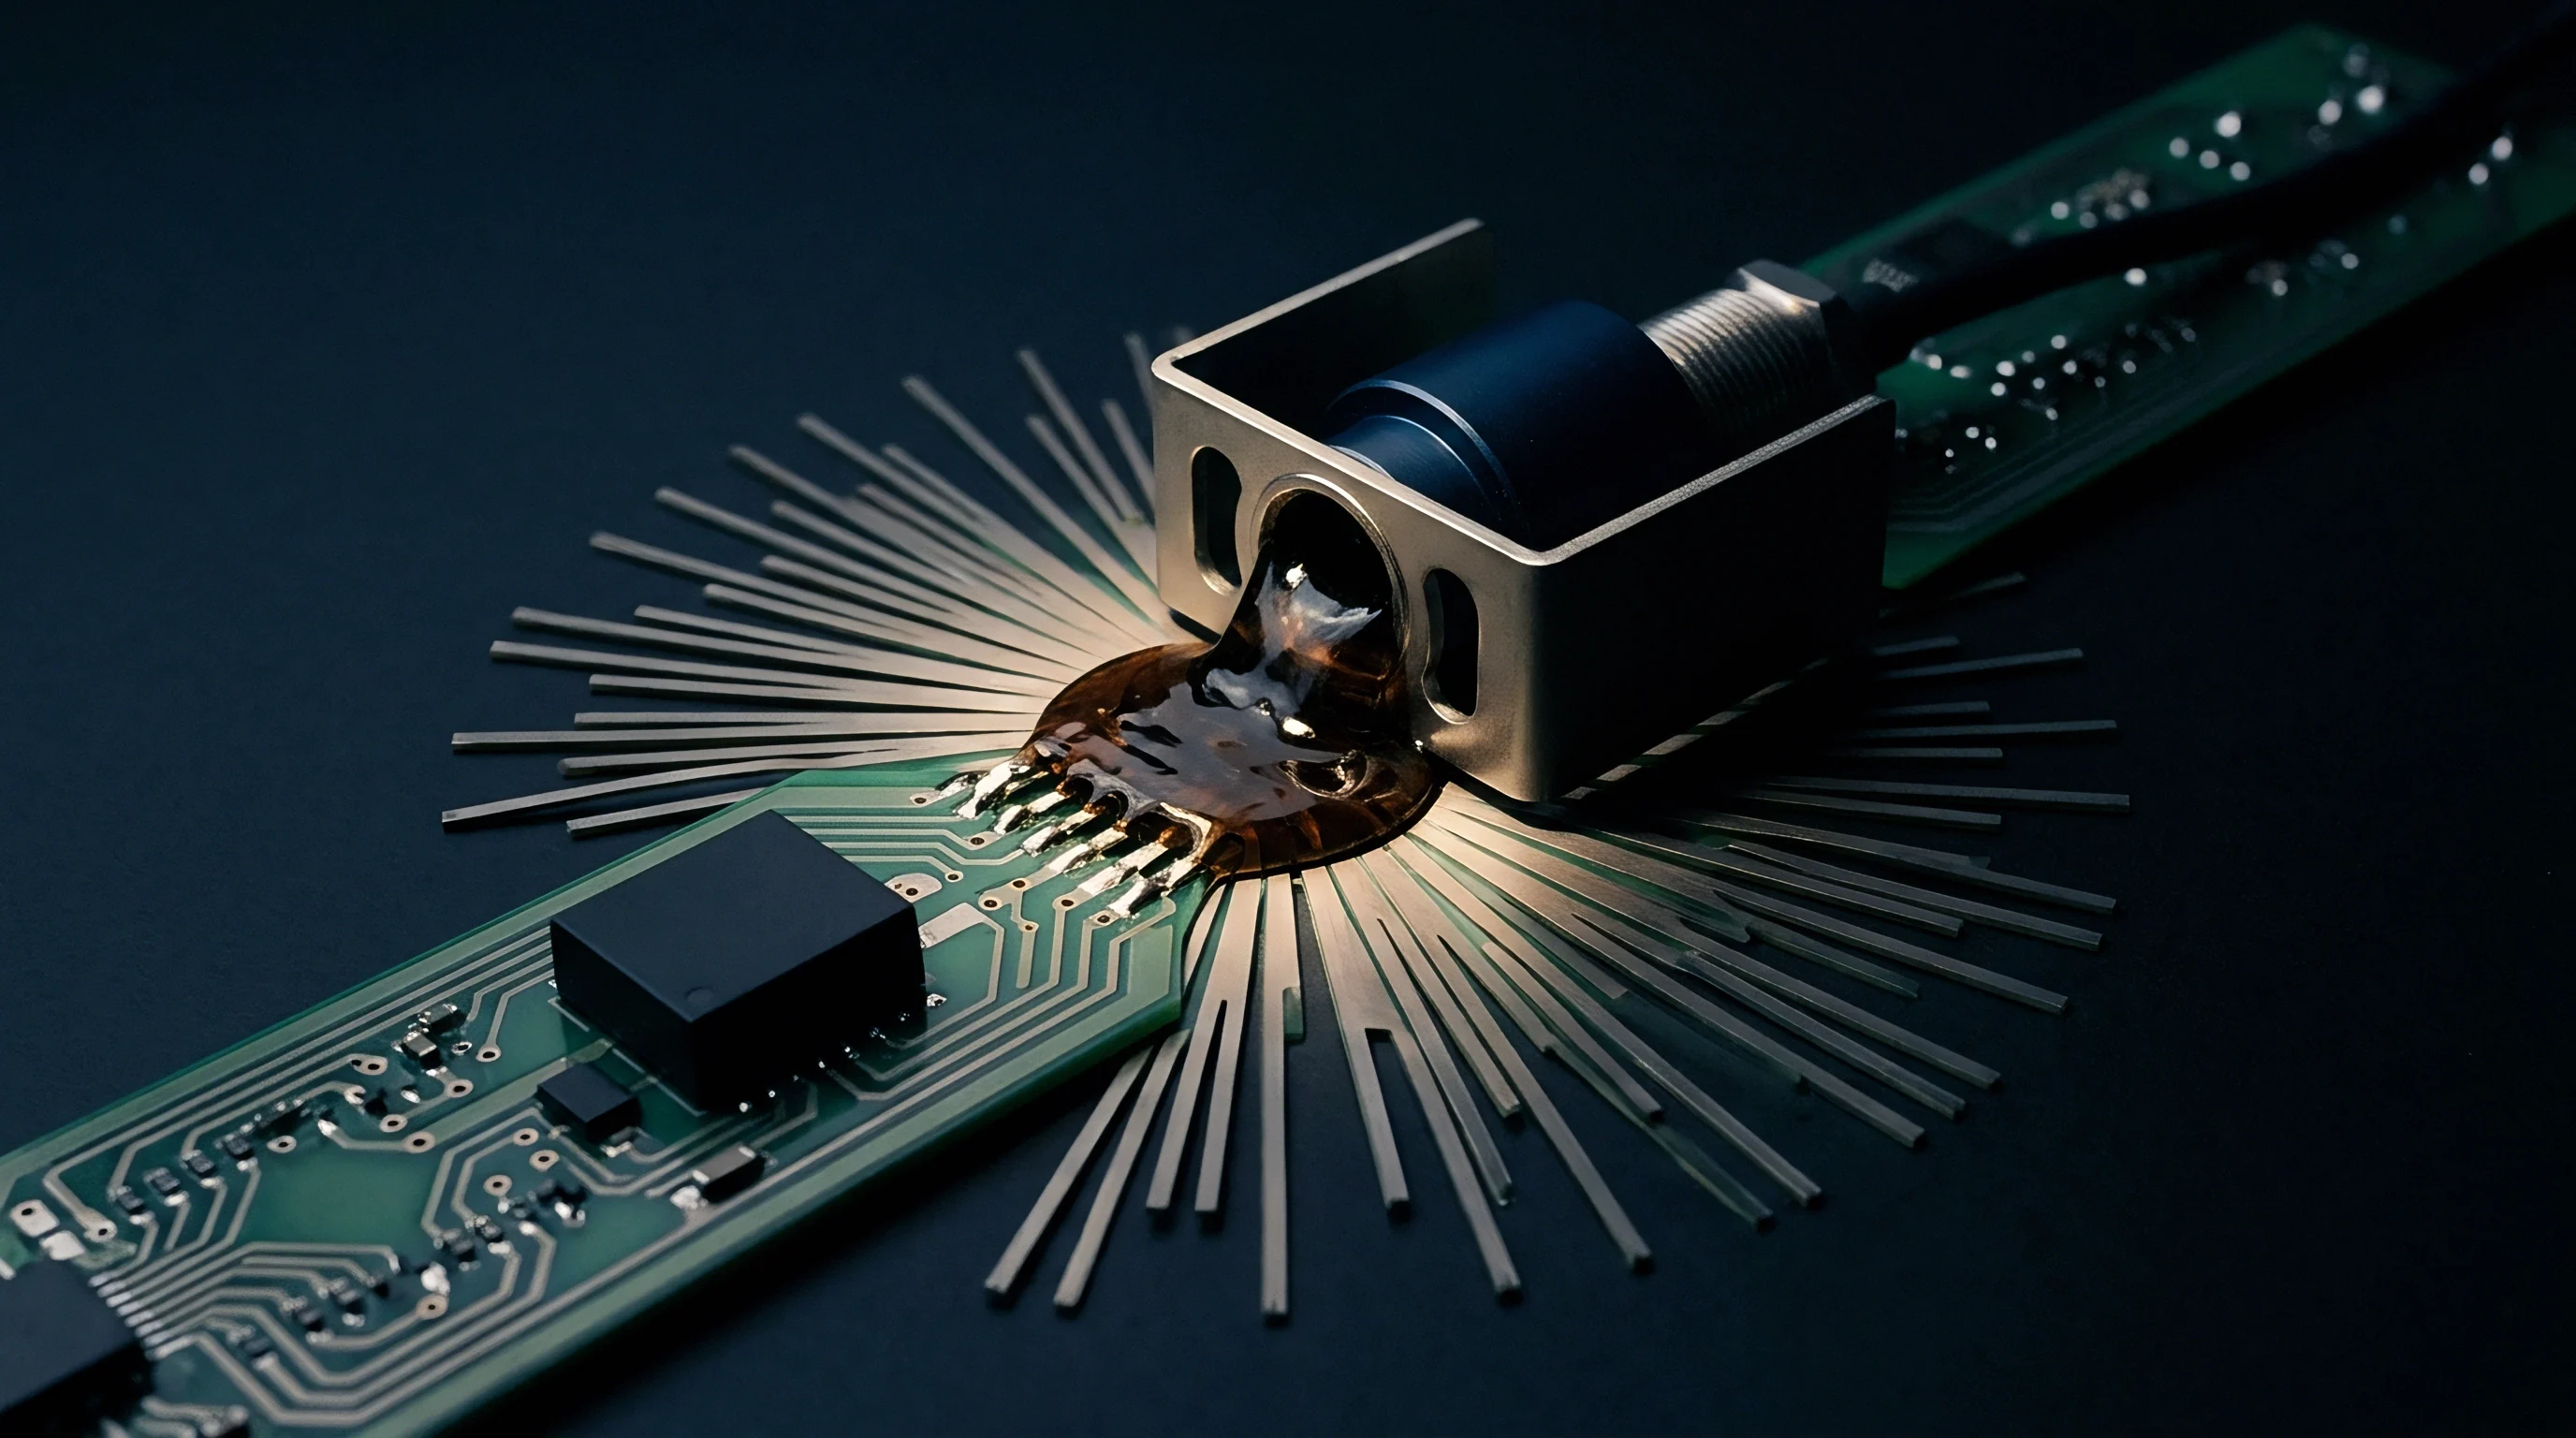
Vector Network Analyzer Fixture Stripping
Coaxial launches introduce localized capacitance and inductance that drop return loss figures below acceptance limits. De-embedding converts raw multi-port parameters into isolated device-under-test matrices. The process models the launch fixture as a 2M-port error network, where M represents the number of differential signal channels.
High-frequency test fixtures require exact electrical modeling of coaxial-to-microstrip transitions to prevent artificial gain or non-causal delay spikes in extracted datasets.
De-Embedding Algorithm Architectural Boundaries
Selection of a de-embedding strategy governs measurement boundary conditions and error tolerances. Physical calibration techniques such as Thru-Reflect-Line require extensive board space for calibration coupons. Alternative mathematical methodologies use half-thru calibration structures to compute fixture error matrices directly from time-domain gating or impedance profile analysis.
| De-embedding Method | Standards Basis | Fixturing Requirement | High-Frequency Limit |
|---|---|---|---|
| Thru-Reflect-Line (TRL) | IEEE 370 Clause 5 | Multi-line calibration coupons on target laminate | 110 GHz |
| 2X-Thru (Method A) | IEEE 370 Annex A | Un-cleaved 2X-Thru calibration structure | 50 GHz |
| 1X-Thru SFD (Method B) | IEEE 370 Annex B | 1X-Thru structure with time-domain reflectometry profile | 40 GHz |
| Automatic Fixture Removal (AFR) | Internal Lab Specs | 2X-Thru or open/short fixture standards | 32 GHz |
Choice of calibration method alters fixture extraction accuracy across high frequencies. TRL provides high accuracy up to 110 GHz but consumes substrate area on expensive production panels. Method A 2X-Thru de-embedding simplifies coupon design while maintaining mathematical consistency up to 50 GHz.
Method B 1X-Thru Smart Fixture De-embedding handles asymmetrical fixtures by synthesizing fixture models through time-domain reflectometry impedance profiles. Calibration errors skew model fit.
What residual phase error remains acceptable when de-embedding asymmetrical probe launches above 40 GHz?
Cascade
S-parameter matrices describe wave reflections and transmissions at network ports without permitting direct algebraic multiplication for series components. Matrix operations require converting scattering parameters into transfer matrices. Transfer parameters concatenate linear network blocks in serial chains.
Multi-port S-parameters for an N-port system partition into incident and reflected wave vectors. Converting a 4-port differential scattering matrix into a 4-port scattering transfer matrix allows sequential matrix inversion. De-cascading subtracts test fixture transfer matrices from measured total transfer matrices.
Converting back yields isolated S-parameters.
- Measure full multi-port scattering parameters of the combined fixture and device under test using calibrated vector network analyzer ports.
- Convert measured N-port S-parameters into N-port transmission T-parameters using linear matrix transformations.
- Extract left-hand fixture transmission parameters and right-hand fixture transmission parameters from dedicated calibration coupon measurements.
- Compute inverse transmission matrices for both left-hand and right-hand fixture networks to prepare for matrix de-cascading operations.
- Multiply inverse left-hand fixture matrix by combined system matrix and inverse right-hand fixture matrix to isolate internal trace transmission parameters.
- Convert resulting isolated N-port transmission matrix back into scattering parameter format for signal integrity characterization and model export.
Inverting ill-conditioned transfer matrices amplifies small measurement errors into major high-frequency noise spikes. Matrix inversion amplifies high-frequency noise.
Conversion of Multi-Port Scattering to Transfer Parameters
Mathematical conversion relies on precise port ordering definitions. For a 4-port network with input ports 1 and 3 and output ports 2 and 4, the scattering matrix maps incoming voltage waves to outgoing voltage waves. The equivalent T-parameter matrix re-arranges wave variables to map input-side waves directly to output-side waves.
Matrix dimensions scale quadratically with port counts, requiring 16 elements for 4-port systems and 64 elements for 8-port differential crosstalk analysis.

De-Cascading Matrix Operations for Coupled Interfaces
Multi-trace arrays exhibit mutual inductance and capacitive coupling. Simple 2-port de-cascading applied separately to individual signal paths neglects cross-talk terms between adjacent lines. Multi-port de-cascading preserves off-diagonal coupling terms during matrix subtraction.
Omitting multi-port coupling matrices during fixture removal causes false pass or fail calls during batch release testing.
Multi-port matrix de-cascading preserves off-diagonal coupling terms during fixture removal operations.
Incorrect matrix ordering during T-parameter conversion produces non-reciprocal system responses that invalidate downstream signal integrity simulations and incur extensive board redesign expenses.

Coupling
Energy transfer between adjacent trace paths creates complex multi-port interaction that single-ended 2-port extraction methods ignore. Multi-port characterization isolates trace loss while measuring differential and common-mode conversion. High-density circuit boards run differential pairs with tight edge-to-edge spacing, generating trace-to-trace crosstalk inside fixture regions.
Fixation structures contribute parasitic electromagnetic coupling alongside the target transmission lines. Single-ended 4-port matrices transform into mixed-mode S-parameter matrices. Differential insertion loss, differential return loss, common-mode rejection, and differential-to-common mode conversion characterize signal propagation behavior.
Crosstalk alters true insertion loss.
- Fixture Near-End Crosstalk distorts raw single-ended reflection data, leading to overestimated differential return loss across adjacent channels.
- Fixture Far-End Crosstalk corrupts forward transmission parameters, producing artificial ripple in extracted differential insertion loss traces.
- Asymmetrical Mode Conversion converts differential signal power into common-mode noise within the launcher transition region, obscuring substrate imbalance.
- Phase Skew Imbalance between physical fixture channels shifts mode-conversion frequencies, creating fake resonance nulls in high-frequency spectral sweeps.
Impure reflections shift phase angles. Fixture asymmetry degrades mode isolation.

Differential Mode Conversion in Multi-Trace Arrays
Symmetric differential transmission lines produce zero mode conversion under ideal conditions. Physical manufacturing variances introduce copper etch asymmetry and glass-weave fiber bundle variations. These microstructural variations cause differential-to-common mode conversion.
Multi-port de-embedding must separate fixture-induced mode conversion from trace-induced mode conversion.
A 4-port fixture extraction algorithm must bound mode-conversion error below minus 40 dB up to the target Nyquist frequency.
Alien Crosstalk Extraction across High-Density Launchers
Characterizing 8-port or 16-port high-speed backplane connectors requires isolating alien crosstalk inside test fixtures. Fixture channels placed close together on test boards transfer electromagnetic energy directly between launchers. Multi-port de-embedding matrices extract crosstalk terms from test fixtures, isolating true trace-to-trace interaction on internal substrate layers.
Multi-port fixture crosstalk must be extracted as a unified matrix rather than subtracted as scalar power magnitudes.

Discrepancy
De-embedded scattering matrices frequently exhibit mathematical artifacts when raw vector network analyzer measurements contain calibration errors. Non-physical responses violate fundamental physical laws. De-embedded models showing power gain or non-causal time responses disrupt system-level channel simulation tools.
Passivity violations occur when an isolated S-parameter matrix yields singular values greater than unity. Magnitude values exceeding 0 dB indicate that the network creates energy. Causality violations manifest as real-time impulse responses appearing before time zero.
Passivity violations generate non-physical gain. Time-domain precursors violate physical causality.
Do Mixed Mode S Parameters Hide Asymmetric Fixture Crosstalk?
Mixed-mode conversions average single-ended scattering parameters to compute differential and common-mode performance. Asymmetric coupling inside fixture launches creates unequal cross-talk terms between single-ended paths. Converting asymmetric single-ended matrices to mixed-mode formats masks localization of coupling sources.
Multi-port matrix extraction must evaluate single-ended cross-terms prior to mixed-mode conversion to isolate fixture asymmetries.

Causality Enforcement and Passivity Corrections
De-embedding algorithms utilize Hilbert transform relations and Kramers-Kronig equations to verify and enforce causality across broadband data sweeps. When fixture loss is overestimated, mathematical subtraction removes excessive attenuation, producing passivity violations in the de-embedded transmission matrix. Standard algorithms enforce passivity by truncating singular values or applying constrained optimization methods.
| Frequency Band | Max Passivity Violation | Time-Domain Precursor Limit | Reciprocal Error Limit |
|---|---|---|---|
| DC to 10 GHz | +0.001 linear magnitude | -60 dB relative to peak | 0.05 dB magnitude difference |
| 10 GHz to 28 GHz | +0.005 linear magnitude | -50 dB relative to peak | 0.10 dB magnitude difference |
| 28 GHz to 56 GHz | +0.010 linear magnitude | -40 dB relative to peak | 0.25 dB magnitude difference |
| 56 GHz to 110 GHz | +0.020 linear magnitude | -30 dB relative to peak | 0.50 dB magnitude difference |
Enforcing passivity without correcting underlying measurement error introduces phase distortion into time-domain pulse responses. Verification requires clean test structures. Standard compliance protocols check passivity before exporting Touchstone models to simulation tools.
IEEE 370 Annex E mandates that de-embedded Touchstone files must pass passivity enforcement algorithms without altering phase response by more than 2 degrees.
Supplier technical support often claims that minor passivity spikes above Nyquist frequencies represent harmless measurement noise that signal integrity simulators automatically filter out during transient analysis.


Validation
Quality assurance procedures for high-speed printed circuits depend on verifying de-embedded scattering data against real physical trace structures. Panel edge test coupons provide standardized trace geometries for lot acceptance testing. Manufacturing variances in dielectric thickness, copper roughness, and line width alter transmission properties across production batches.
Fabrication tolerances shift line impedance.
De-embedding integrity checks compare extracted trace parameters against physical coupon standards. 2X-Thru validation structures verify fixture removal accuracy. Panel coupons carry physical traces.
Comparing the mathematically de-embedded 2X-Thru structure against an ideal short circuit or line verification standard identifies extraction errors before batch release.
- Verification Structure Matching verifies that de-embedded 2X-Thru structures resolve to a zero-length line with less than 0.2 dB insertion loss up to 50 GHz.
- Impedance Profile Uniformity confirms via time-domain reflectometry that de-embedded trace profiles match target system impedance within 2.5 ohms.
- Reciprocity Verification checks that inverse port transmission parameters satisfy matrix symmetry within predefined spectral tolerances across all frequencies.
- Broadband Causality Check validates that time-domain step responses exhibit no signal precursors prior to physical propagation delay limits.

Panel Test Coupon Fabrication Specifications
Test coupons must mirror target signal path stackups exactly. Placing coupons on panel margins subjects them to plating variations and etch rate differentials that differ from internal board locations. 2X-Thru calibration coupons must match signal trace widths, reference layer spacings, and copper weight specifications of active board channels.
Failure to match geometry invalidates fixture subtraction models.
Batch Acceptance Procedures for High Speed Substrates
High-frequency board qualification requires submitting multi-port Touchstone files with raw fixture measurements and extracted matrix data. Receiving inspection uses automated parsing scripts to check passivity, causality, and insertion loss tolerances. Batch release requires full compliance with IPC-9252 electrical test standards and IEEE 370 verification metrics.
Quality verification requires de-embedded coupon data to match physical trace attenuation within plus or minus 5 percent across the target operational bandwidth.
IPC-6012 Class 3 high-frequency addendums specify that batch acceptance requires verified multi-port S-parameters for all high-speed coupon structures before panel routing and final shipment.

Settlement
Board fabricators and system integrators incur substantial financial exposure when unverified de-embedded matrices enter production workflows. Inaccurate de-embedding hides manufacturing defects or generates false non-conformance failures on acceptable circuit panels. Signal integrity models derived from flawed de-embedded matrices cause expensive system re-spins, missed product launch windows, and warranty liability for failed backplane links.
Financial Risks of Uncalibrated Signal Integrity Models
Sourcing high-speed printed circuit boards without validated de-embedding procedures exposes buyers to yield disputes. Fabricators using inaccurate fixture removal software may claim substrate compliance when physical trace attenuation exceeds system budgets. Alternatively, over-correcting fixture loss scrap acceptable production panels unnecessarily.
Resolving these disputes requires auditing measurement fixtures, calibration algorithms, and raw VNA datasets.
Worked Calculation of Lot Rejection Allocation
Consider a production lot of 200 high-speed server backplanes priced at 1,500 dollars per panel, representing a lot value of 300,000 dollars. Receiving inspection evaluates 8-port differential trace coupons operating at 56 GHz PAM4 Nyquist frequencies. Initial uncalibrated VNA measurements indicate an average differential insertion loss of 1.45 dB per inch at 28 GHz, exceeding the target specification limit of 1.20 dB per inch.
Applying an unverified, simplified 2-port de-embedding algorithm subtracts estimated launch loss but underestimates fixture crosstalk. The resulting de-embedded matrix reports trace attenuation of 1.15 dB per inch, passing the batch. Subsequent system assembly reveals high bit-error rates on backplane channels.
Laboratory re-evaluation using IEEE 370 Method A multi-port 2X-Thru de-embedding extracts true fixture loss and crosstalk, revealing actual trace attenuation of 1.32 dB per inch.
Re-testing confirms that 45 percent of the production lot exceeds maximum loss allowances due to resin-content variation during lamination. Scrapping 90 non-conforming panels results in a direct substrate loss of 135,000 dollars. Secondary costs include 40 hours of engineering re-test time at 250 dollars per hour, totaling 10,000 dollars, alongside assembly line downtime penalties of 25,000 dollars.
The failure to mandate verified multi-port matrix de-embedding during initial lot release creates a total financial exposure of 170,000 dollars on a single 300,000-dollar procurement batch.