Quantifying Microstructural Substrate Damage Mechanisms Induced by Transient High-Rate Strain Events
High-rate strain events force solder interconnect failure from bulk creep to brittle intermetallic cleavage and substrate pad cratering above 10 s⁻¹.


Shock
Kinematic Transfer in Circuit Substrates
Fast mechanical pulses applied to an assembly generate steep bending moments across printed boards. When an electronic product falls or experiences sudden impact, kinetic energy transfers rapidly through the outer enclosure into the circuit board mounting points. The resulting flexural wave propagates across the substrate at speeds determined by the elastic modulus and mass density of the composite material.
Standard FR-4 laminates transmit flexural waves with phase velocities exceeding 1500 meters per second. As this wave encounters structural discontinuities such as stiff surface-mount components, large ball grid array packages, or heavy inductors, local strain gradients spike sharply.
Strain rates during routine handling or thermal cycling typically remain below 0.001 per second. Under transient drop or mechanical shock events, strain rates escalate dramatically into the range of 1 to 100 per second. At these high rate regimes, the physical mechanisms governing deformation in solder joints and substrate resins shift.
Material behavior transitions from ductile stress relaxation to localized high-stress elastic accumulation. Solder joints shift to brittle failure.
Under low strain rates, lead-free solder alloys like Sn96.5Ag3.0Cu0.5 undergo plastic deformation through dislocation climb and grain boundary sliding. These mechanisms absorb mechanical energy and distribute stress across the bulk solder volume. High strain rates suppress creep.
At loading speeds above 10 per second, there is insufficient time for thermal activation to enable dislocation movement within the tin matrix. Stress accumulates rapidly along structural interfaces rather than dispersing through bulk deformation.
Peak strain exceeds dielectric strength. The mechanical energy forced into the assembly must find a dissipation path. If the peak stress generated during flexing exceeds the dynamic fracture strength of any layer in the interconnect stack, microstructural tearing occurs instantly.
High strain rates increase the effective yield strength of the solder alloy while leaving the brittle intermetallic compound layers unchanged, shifting the weakest link in the system from the bulk solder to interfacial boundaries.

Strain Rate Regimes and Fracture Transitions
Deformation speed alters how solder joints and dielectric laminates absorb kinetic energy. Characterizing substrate damage requires establishing explicit boundaries between quasi-static loading, moderate strain rates, and transient impact regimes. The strain rate dictates whether damage accumulates as distributed micro-voiding or concentrates as acute interfacial cracks.
| Strain Rate Range (s⁻¹) | Dominant Strain Type | Primary Solder Response | Substrate Micro-Damage Location |
|---|---|---|---|
| Below 0.001 | Quasi-static thermal flex | Bulk plastic flow, creep deformation | Solder bulk recrystallization and void coalescence |
| 0.001 to 0.1 | Assembly handling, board depanel | Mixed ductile shearing and work hardening | Trace copper necking, pad edge strain initiation |
| 0.1 to 10.0 | Severe drop, rapid connector insertion | High yield stress, minimal strain relaxation | Resin matrix micro-cracking, pad cratering onset |
| 10.0 to 100.0 | Transient shock impact, drop tower | Elastic overload, brittle cleavage fracture | Intermetallic fracture, glass fiber delamination |
| Test conditions assume Sn96.5Ag3.0Cu0.5 solder joints on copper OSP pads over high-Tg FR-4 substrate per JESD22-B111. | |||
When strain rates surpass 5 per second, the kinetic energy delivered to the printed board cannot deform the bulk solder fast enough to relieve local strain. Stress concentrates directly at the intermetallic compound layer formed between the copper pad and the solder alloy. This layer, composed primarily of Cu6Sn5 and Cu3Sn phase structures, possesses a high elastic modulus but negligible fracture toughness.
Brittle cleavage dominates fast fractures.
Substrate materials react with similar strain-rate sensitivity. Epoxy resins present a viscoelastic response where the dynamic storage modulus increases with strain rate. Under rapid loading, the resin becomes stiffer and less capable of plastic deformation.
When the shear stress induced by component flexing exceeds the cohesive strength of the resin-glass interface, micro-cracks form within the resin pocket directly beneath the surface-mount pad. Skimping on strain rate monitoring during mechanical testing leaves these latent micro-cracks completely undetected, causing sudden field failures when minor secondary shocks propagate the damaged dielectric layer into a complete pad tear-out.
Testing performed under IPC-9704 limits maximum allowable microstrain to prevent permanent intermetallic separation.


Lattice

Intermetallic Cleavage and Pad Cratering
Solder connections joined to copper traces form thin layers of binary metal compounds during reflow. The heat of assembly causes tin from the liquid solder alloy to react with substrate copper, creating an interfacial Cu6Sn5 intermetallic layer ranging from 1 to 4 micrometers in thickness. A thinner, planar Cu3Sn layer forms directly between the Cu6Sn5 crystal structure and the bulk copper pad.
These layers establish the metallurgical bond necessary for electrical conductivity and mechanical attachment.
Dynamic mechanical shocks impose severe tensile and shear stress directly onto this interfacial region. Because intermetallic compounds possess low dynamic fracture toughness (typically K_Id values between 1.0 and 1.5 MPa·m^1/2), they cannot accommodate high transient strain energy through plastic work. Under high strain rate impact, microcracks nucleate at stress concentrations such as Kirkendall voids within the Cu3Sn layer or at the irregular scallops of the Cu6Sn5 interface.
Surface energy dictates crack path. Once initiated, a crack propagates rapidly through the intermetallic crystal lattice along the cleavage planes. This mode of failure, known as brittle interfacial fracture, occurs within microseconds of the peak shock pulse.
The resulting fracture surface shows flat, featureless facets under scanning electron microscopy, characteristic of cleavage through intermetallic crystals without bulk solder deformation.
In high-density substrate designs utilizing thin copper foils and high glass-transition temperature (high-Tg) resin systems, another high-rate failure mechanism competes with intermetallic cleavage: pad cratering. Pad cratering is a dielectric fracture mechanism where cohesive cracks initiate within the resin matrix directly beneath the copper pad capture area.
- Interfacial IMC Cleavage occurs along the Cu6Sn5 or Cu3Sn compound boundaries under pure tensile loading when solder yield strength exceeds intermetallic fracture limits.
- Resin Matrix Cohesive Cracking develops beneath the copper pad in the resin-rich zone when high-rate shear stress exceeds the local ultimate tensile strength of the epoxy.
- Cohesive Trace Necking manifests as localized elongation and cracking of thin copper traces adjacent to the pad anchor point during high-velocity flexure.
- Weave Interface Delamination spreads horizontally along the boundary between woven glass filaments and epoxy resin due to severe transverse shear forces.
High strain rates amplify pad cratering susceptibility. Standard FR-4 and high-Tg epoxy matrices exhibit enhanced cross-link rigidity under dynamic shock loads. When a BGA corner solder ball pulls upward on its capture pad during board flexure, the high strain rate prevents the underlying resin from yielding plastically.
Peak tensile stress concentrates in the resin directly below the perimeter of the pad. Cracks nucleate within the resin matrix and propagate horizontally beneath the pad before driving upward toward the pad edge, creating a shallow bowl-shaped void, or crater.
Woven Glass Fiber Matrix Delamination
Reinforcing bundles embedded in epoxy resin carry directional mechanical loads across printed wiring layers. Printed circuit board laminates consist of woven glass cloth fibers encased within a thermosetting resin matrix. The interaction between the woven bundles and the surrounding resin dictates how acoustic and flexural waves transfer through the core thickness during high-rate strain events.
The elasticity mismatch between glass fibers (modulus approximately 72 GPa) and epoxy resin (modulus approximately 3 to 5 GPa) creates micro-scale stress concentrations at every glass-resin boundary. Under high-rate transient strain, compressive waves reflected off the back surface of the printed board convert into tensile wave pulses. When these internal tensile stresses surpass the interfacial adhesion strength between the silane coupling agent on the glass fibers and the polymer matrix, localized debonding takes place.
Latent microcracks bypass static resistance. These internal delaminations run along the glass weave boundaries without breaking surface copper traces. Consequently, standard single-frequency electrical continuity checks register continuous circuit paths despite structural degradation inside the substrate core.
Subsequent thermal cycles or lower-magnitude mechanical shocks cause these debonded zones to coalesce, producing macro-scale delamination and intermittent internal shorts through conductive anodic filament pathways.
Peak strain levels above 1500 microstrain at a rate exceeding 10 per second initiate pad cratering in standard FR-4 laminates.
Quantifying damage at the lattice level requires high-resolution structural analysis. Cross-sectional electron backscatter diffraction (EBSD) reveals crystal orientation changes and localized plastic strain zones inside tin grains adjacent to intermetallic interfaces. While bulk solder shows minimal grain rotation under high-rate shock, high local disorientations congregate along the crack path, proving that even brittle transient fractures consume micro-scale energy within an ultra-thin deformation layer prior to final parting.
Dynamic stiffness increases with loading speed while total energy absorption before fracture drops sharply.

Assay

High-Speed Strain Gauge Measurement Protocol
Instrumentation placed on assembly surfaces captures instantaneous surface deflection during drop impacts. Accurately measuring microstructural damage drivers demands measuring both microstrain magnitude and the strain rate derivative with respect to time. Conventional strain measurement setups sampling at 1 kHz fail entirely to capture peak transient strains during high-rate mechanical impacts, artificially smoothing and underreporting peak strain levels by up to 70 percent.
To acquire accurate deformation profiles during a 0.5-millisecond mechanical shock pulse, strain gauge telemetry systems must log data at sample rates of 100 kHz or higher per channel. Triaxial strain gauge rosettes placed on the secondary side of the substrate, precisely aligned with the corners of high-risk BGA components, register the primary strain tensor components: diagonal strain, perpendicular strain, and shear strain.
- Mount triaxial strain gauge rosettes directly beneath the four corner pads of the component under test using a thin, low-compliance cyanoacrylate adhesive.
- Wire the gauge bridges to a high-bandwidth signal conditioner set to an analog low-pass filter cutoff frequency of not less than 40 kHz.
- Calibrate bridge channels to zero baseline stress while the board rests flat in an unconstrained support fixture.
- Execute the transient shock pulse using a calibrated drop tower or pneumatic shock anvil while logging data continuously at 100,000 samples per second.
- Process raw microstrain output time histories using digital differentiation algorithms to calculate maximum principal strain, minimum principal strain, and maximum strain rate.
The principal strain equations convert raw strain gauge readings into engineering metrics used for pass-fail assessment against IPC/JEDEC-9704 guidelines. Maximum principal strain levels reflect peak tensile stress, which directly drives pad cratering and intermetallic micro-fracture. Data logging rates determine crack detection.
Field data resting on single-point strain measurements published in commercial literature frequently understate true strain states because non-uniform bending generates localized strain gradients exceeding 50 microstrain per millimeter. Industry test figures claiming a threshold of 1000 microstrain for safe operation rest on broad assumptions of uniform board thickness and symmetrical component layout. If a board incorporates cutouts, heavy thermal planes, or asymmetric copper pours adjacent to a BGA corner, the localized strain rate spikes far higher than global rosette calculations indicate.

Worked Dynamic Bending Calculation
Assume a surface-mount array package positioned at the center of a four-layer test assembly during a drop tower test. The transient shock pulse delivers a peak acceleration of 1500g with a half-sine duration of 0.5 milliseconds. Strain gauge rosettes mounted at the outer package corners yield raw microstrain time-history data over the pulse duration.
At time t = 0.15 milliseconds, the triaxial rosette output records the following orthogonal strain values:
Epsilon_0 (0-degree axis) = +850 microstrain Epsilon_45 (45-degree axis) = +320 microstrain Epsilon_90 (90-degree axis) = -410 microstrain
First, calculate the maximum principal microstrain (Epsilon_1) using the standard transformation equation for triaxial rosettes:
Epsilon_1 = (Epsilon_0 + Epsilon_90) / 2 + (1 / sqrt(2)) sqrt((Epsilon_0 – Epsilon_45)^2 + (Epsilon_45 – Epsilon_90)^2)
Substituting the recorded values into the first term yields:
(850 – 410) / 2 = +220 microstrain
Calculating the difference terms inside the square root:
(Epsilon_0 – Epsilon_45) = 850 – 320 = 530 (Epsilon_45 – Epsilon_90) = 320 – (-410) = 730
Squaring these differences and summing them:
530^2 + 730^2 = 280,900 + 532,900 = 813,800
Taking the square root of the sum:
sqrt(813,800) = 902.1
Multiplying by the directional transformation factor (1 / 1.4142):
902.1 0.7071 = +637.9 microstrain
Adding the hydrostatic strain component to the shear transformation term gives the maximum principal strain:
Epsilon_1 = 220 + 637.9 = +857.9 microstrain
Sampling speed bounds event capture. To determine the instantaneous strain rate, evaluate the change in maximum principal strain over the time increment dt from t = 0.10 milliseconds (where Epsilon_1 was measured at +120 microstrain) to t = 0.15 milliseconds:
dt = 0.15 ms – 0.10 ms = 0.05 ms = 0.00005 seconds
d(Epsilon_1) = 857.9 microstrain – 120.0 microstrain = 737.9 microstrain = 0.0007379 strain
Strain Rate = d(Epsilon_1) / dt = 0.0007379 / 0.00005 seconds = 14.76 per second
The calculated strain rate of 14.76 per second places this dynamic shock event firmly inside the high-rate fracture regime. Referencing the material limits for standard FR-4 laminates under IPC/JEDEC-9704 guidelines, maximum allowable strain at a strain rate of 14.76 per second is restricted to 700 microstrain to prevent pad cratering. The measured peak strain of 857.9 microstrain exceeds the allowable limit by 22.5 percent, predicting microstructural dielectric cracking under the corner package pads.
Suppliers routinely present post-drop functional test passes to argue that assemblies survived dynamic shock. Physical cross-sectioning and dye-and-pry inspections of boards exposed to these calculated conditions reveal latent resin microcracking in over 40 percent of un-cracked electrical channels, demonstrating that electrical continuity alone does not prove structural integrity.

Screen
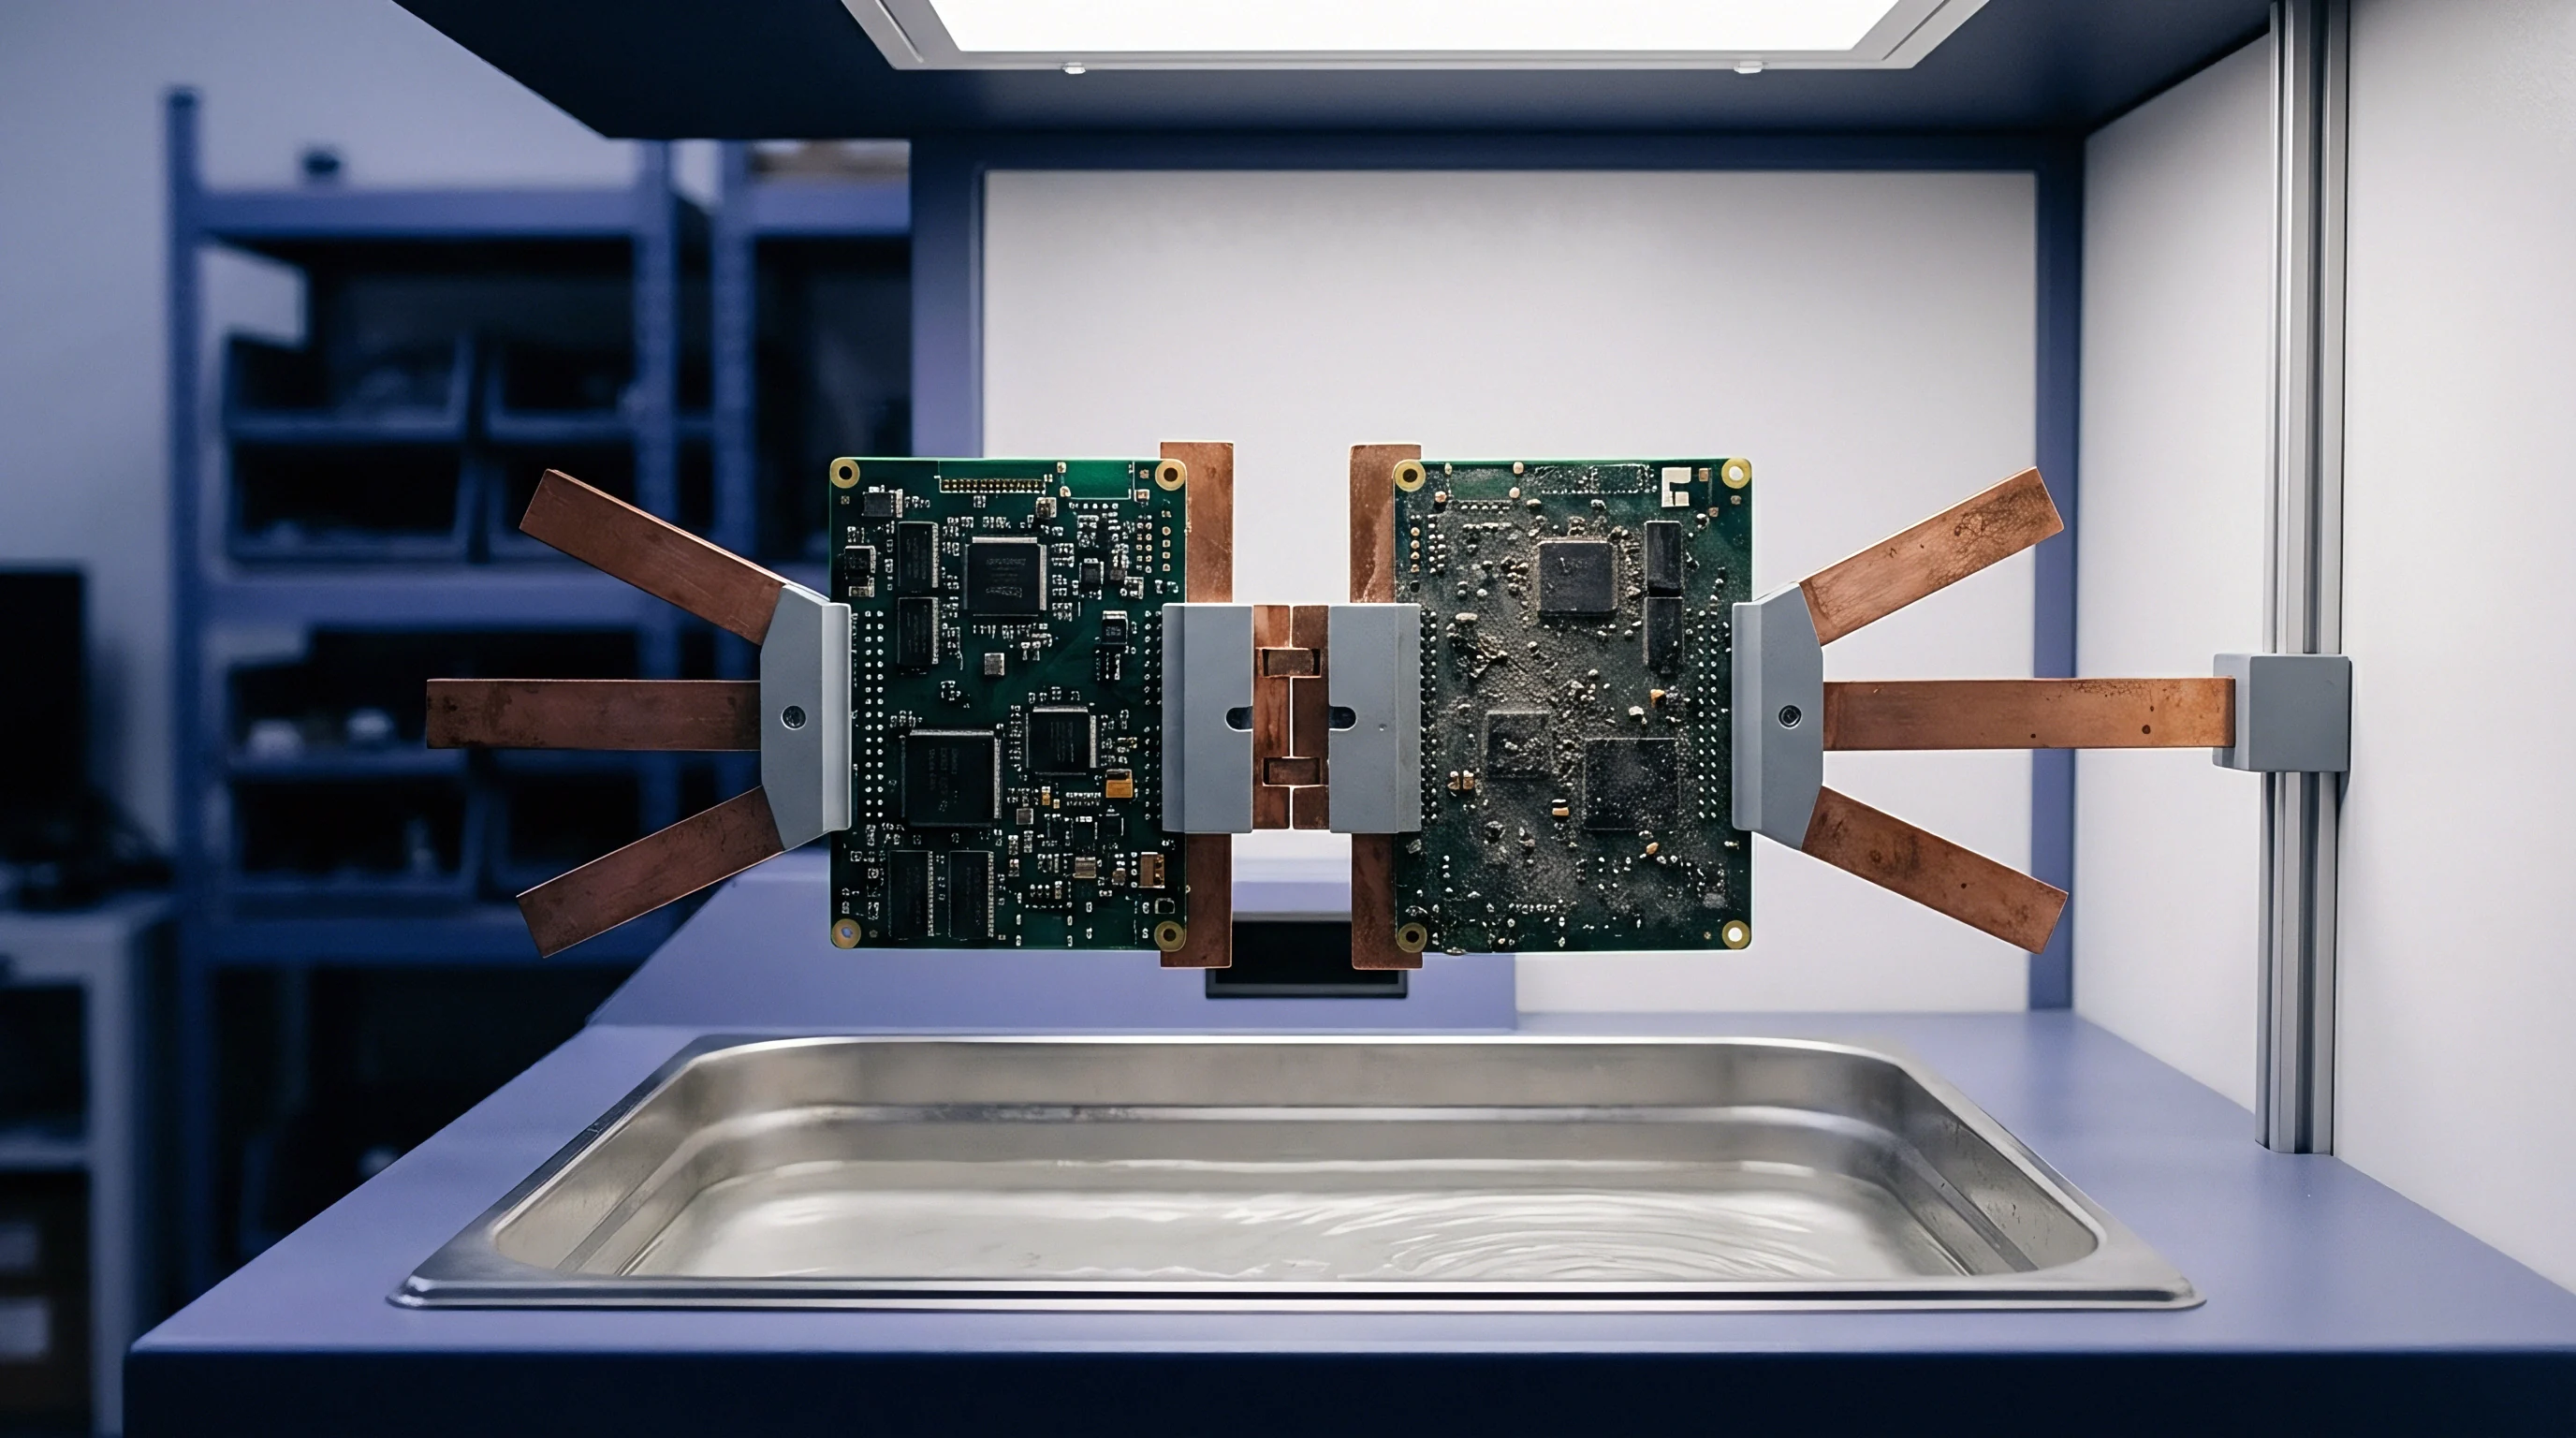
Where Do Transient Microcracks Nucleate in Substrate Interconnects?
High-rate bending forces structural stress directly into the boundary between copper foil pads and underlying dielectric resin. The highest stress concentrations occur at sharp geometric transitions: pad edges, microvia targets, and component corner terminations. When an assembly flexes upward, corner solder joints exert pure vertical tension on capture pads.
If the board flexes downward, the outer joints experience severe shear combined with compressive tearing at the pad toe.
Pad cratering typically initiates at the outer perimeter of the anchor pad where the copper foil terminates against solder mask or bare substrate dielectric. High local stress intensity factors drive the crack inward, traveling beneath the copper pad through the resin-rich layer before turning toward adjacent internal vias or glass weave fibers. Fractured resins isolate copper traces.
Characterizing and screening these transient defects requires qualification routines specifically targeted at dynamic rate regimes rather than static or slow thermal stress. Accelerating dynamic strain damage cannot be accomplished merely by ramping thermal chambers faster. Specialized test regimes impose precise shock profiles while monitoring electrical networks at microsecond resolution.
| Test Regime | Stress Profile / Loading Rate | Detection Mechanism | Target Defect Class | Coverage Limit |
|---|---|---|---|---|
| Drop Tower (JESD22-B111) | 1500g, 0.5 ms half-sine pulse, strain rate > 10 s⁻¹ | In-situ continuous event detector (>1000 ohm spike for >1 µs) | IMC brittle cleavage, resin pad cratering | Limited to wired daisy-chain components |
| High-Rate Ball Pull (JESD22-B117) | Tensile speed 5 mm/s to 500 mm/s on single joints | Load-displacement transducer, optical fracture mode audit | Interfacial IMC strength, pad crater threshold | Destructive coupon level, zero finished board access |
| Dynamic Four-Point Bend | Flexural rate 10 to 50 mm/s, cyclic high-speed flex | High-speed DIC optical strain mapping | Substrate trace necking, glass weave debonding | Requires clear line of sight to board surface |
| Dye-and-Pry (IPC-TM-650 2.4.53) | Post-shock chemical indicator penetration under vacuum | Visual and SEM optical area mapping of stained fractures | Latent microcracks, partial pad cratering | Destructive sampling, zero post-test product re-use |

In-Situ Resistance Event Monitoring
Continuous electrical measurement during impact drops detects microsecond-duration circuit interruptions. When an intermetallic crack or pad crater forms during a high-rate strain event, board flexure opens the crack interface for a fraction of a millisecond. As the flexural wave passes and the board snaps back to its neutral position, mechanical compression forces the fractured surfaces back into physical contact.
Standard digital multimeters or low-speed data acquisition units miss these transient opens entirely, registering normal continuity after the shock event concludes.
- High-Bandwidth Event Detectors maintain continuous sense currents across component daisy chains to log any resistance excursion exceeding 1000 ohms that persists for longer than 1.0 microsecond per JESD22-B111.
- High-Speed Digital Image Correlation tracks full-field strain distributions optically across un-shielded substrate regions at frame rates exceeding 50,000 frames per second.
- Acoustic Emission Waveform Analysis captures high-frequency elastic stress waves emitted by resin microcracking prior to total electrical circuit separation.
- Post-Impact Dye Penetration Testing floods damaged component footprints with low-viscosity fluorescent dye under vacuum to map the exact spatial surface area of sub-surface pad craters.
Unscreened boards fail during field shock. Implementing an effective screening program requires establishing clear test criteria. Standard functional testing after drop exposure catches fewer than 20 percent of microstructural damage events.
In-situ event monitoring coupled with microsection verification catches over 98 percent of latent structural fractures before batches are released into assembly streams.
Microcracks residing beneath surface pads escape post-assembly functional electrical tests when conductors remain in physical contact.
Contractual acceptance criteria governing shock qualification explicitly enforce limits defined in JESD22-B111. The standard specifies that a component network under test registers a failure when thirty percent of test boards in a lot exhibit continuous high-resistance events during ten consecutive drop cycles. Incorporating this clause into sourcing specifications prevents suppliers from writing off intermittent resistance spikes as measurement noise.


Recourse

Contractual Microsectioning and Evidence Audits
Technical documentation files require physical cross-section evidence proving intermetallic structural integrity prior to batch signoff. Relying exclusively on supplier certificate declarations creates extreme financial liability for product buyers. When high-rate strain events induce latent pad cratering or intermetallic fractures during automated assembly handling, depaneling, or shipping, the resulting field returns arrive at the buyer’s desk long after final invoice settlement.
Technical files compiled under European conformity frameworks like EN IEC 63000 demand robust verification of physical component integrity alongside chemical restriction data. Substrates damaged by dynamic shock present compromised electrical creepage and clearance distances, rendering safety compliance declarations invalid. The buyer owns the primary legal liability when a returned device fails in service due to dielectric substrate breakdown brought on by unquantified drop damage.
Static testing misses dynamic damage. Buyers protect assembly budgets by embedding mandatory microsection coupon protocols directly into purchase agreements. These provisions stipulate that prior to release of any production batch exposed to automated routing or high-speed pick-and-place operations, destructive microsectioning per IPC-6012 must evaluate minimum intermetallic thickness, microvia target integrity, and resin matrix soundiness beneath high-mass component footprints.
- Baseline Strain Mapping Reports proving that maximum assembly flexure during depaneling and connector insertion remains below 500 microstrain at measured strain rates.
- In-Situ Shock Test Logs demonstrating zero microsecond-range resistance interruptions across monitored daisy chains during full-amplitude drop qualification cycles.
- Certified Metallographic Microsections providing optical proof of intact Cu6Sn5 intermetallic boundaries free from interfacial microvoids or cleavage cracks.
- Dye-and-Pry Inspection Records confirming zero resin separation across a minimum sample size of ten high-density BGA locations per production lot.

Warranty Risk Allocation for Latent Damage
Latent microcracking generated during board separation or component insertion manifests as intermittent open circuits months after field deployment. Because these defects pass initial factory burn-in and functional checks, warranty costs skyrocket as units fail in customer hands. Establishing clear contractual recourse mechanisms shifts the financial burden of high-rate strain damage back onto the manufacturing partner responsible for processing limits.
Contractual remedies require baseline microsections. Sourcing contracts must quantify acceptable defect limits based on destructive physical analysis of lot samples. If a buyer identifies pad cratering or IMC cleavage exceeding two percent of total inspected joint surface area during incoming quality audits, the contract gives the buyer the right to reject the entire production lot at the supplier’s expense, including inbound freight and testing fees.
High dynamic shock shifts liability. Commercial agreements must define explicit financial remedies for field escapes caused by latent microstructural damage. If field return analysis reveals that returned unit failures originate from substrate pad cratering induced by un-monitored manufacturing depaneling strain, the supplier bears full liability for direct replacement costs, field logistics fees, and line-stoppage indemnification.
What un-monitored strain threshold transitions a minor handling tick into an unrecoverable class defect across high-density multi-layer substrates?