Coupled Strain Energy Continuum Damage Mechanics Modeling for Multi Reflow Ball Grid Arrays
Coupled strain energy damage models quantify multi-reflow solder joint degradation by partitioning plastic and creep energy to predict thermal fatigue life drops.

Warp
Repeated reflow passes subject plastic ball grid arrays and multi-layer printed circuit boards to cumulative thermal excursions exceeding liquidus temperatures. During primary surface mount assembly, the board enters the reflow oven to solidify bottom-side passive components and secondary ICs. Secondary reflow flips the assembly to attach complex, high-density ball grid array packages.
Localized rework operations introduce a third or fourth thermal cycle to single components. Substrate resins soften rapidly. When oven temperatures surpass the glass transition temperature of the laminate matrix, out-of-plane deformation accelerates due to coefficient of thermal expansion mismatches between the silicon die, organic package substrate, and printed wiring board.
The interface shifts. Silicon displays a low thermal expansion coefficient near 2.6 ppm per degree Celsius. Organic BGA substrates expand at 12 to 15 ppm per degree Celsius, while standard FR-4 circuit boards expand at 16 to 18 ppm per degree Celsius in the plane of the board.
Below liquidus, these expansion differentials build residual elastic and plastic shear strains in the solder spheres. Above liquidus, the solder alloy melts into a molten state, releasing accumulated elastic strain but exposing the joint geometry to dynamic package bowing. Solder spheres situated at package corners experience vertical elongation or compressive collapse depending on whether the board and package bow in a concave or convex mode.
Shear strains concentrate at package corners. Solder joint shapes solidified under high warpage conditions lock in irregular geometry, asymmetric wetting angles, and non-uniform volume distribution across the pin matrix. Subsequent thermal processing cycles this irregular geometry, accelerating local strain concentrations.
Microstructural changes reduce fatigue resistance. The initial reflow pass forms a baseline copper-tin intermetallic compound layer at the pad interface, but secondary and tertiary reflow passes coarsen this layer, creating a thick, brittle interface before the finished assembly ever leaves the factory floor.
- Corner Joint Dynamic Lift ~ Tensile forces during board flexing pull peripheral solder spheres away from substrate pads while the alloy passes through its liquidus-to-solidus transition band.
- Intermetallic Interface Cracking ~ Multiple thermal passes drive thick copper-tin intermetallic growth, creating brittle fracture pathways along the pad contact plane.
- Substrate Delamination Driven Strains ~ Cumulative out-of-plane resin expansion splits interior board laminates, concentrating thermomechanical strain directly into adjacent ball columns.
Line managers frequently claim that package bowing remains within supplier datasheet tolerances despite repeated thermal exposures. Component vendors attribute corner joint fractures to aggressive heating profiles rather than substrate deformation during secondary processing.
Partition
Continuum damage mechanics treats the solder joint matrix as a degrading thermodynamic volume where work density translates into microstructural disruption. In thermomechanical analysis, total strain energy splits into distinct recoverable and irrecoverable components. Elastic strain energy drives immediate reversible deformation.
Plastic strain energy represents time-independent inelastic deformation occurring when local stresses exceed alloy yield boundaries. Creep strain energy accounts for time-dependent plastic flow dominated by grain boundary sliding and dislocation climb at elevated homologous temperatures.
Creep strain energy dominates elevated temperatures. Under lead-free SAC305 reflow histories, high temperature exposures accelerate grain coarsening within the tin matrix. This microstructural softening shifts the dominant inelastic deformation mode during subsequent thermal cycling.
Creep deformation absorbs a higher fraction of total strain energy compared to time-independent plastic deformation. Calculating the partition of strain energy involves integrating the stress tensor over the inelastic strain increment for each incremental loading step.
Total strain energy density per cycle equals the sum of elastic energy density, plastic work density, and creep work density. Mathematical energy formulations express this relationship directly:
W_total = W_elastic + W_plastic + W_creep
Plastic work rate equals stress multiplied by plastic strain rate. Creep work rate equals stress multiplied by creep strain rate, modeled using double-power creep expressions or Garofalo hyperbolic sine functions:
d(epsilon_creep)/dt = A (sinh(alpha stress))^n exp(-Q / (R T))
Energy density partitioning separates these terms during finite element sub-modeling. Plastic strain energy accumulates primarily during rapid temperature ramps. Creep strain energy accumulates during thermal dwell periods at upper and lower temperature extremes.
Multiple reflow cycles increase total inelastic energy accumulation per operational thermal cycle by altering matrix yield strength and grain morphology.
| Reflow Pass Count | Plastic Energy Density (mJ/mm³) | Creep Energy Density (mJ/mm³) | Elastic Energy Density (mJ/mm³) | Intermetallic Layer (µm) |
|---|---|---|---|---|
| 1 Pass (Baseline) | 0.14 | 0.38 | 0.06 | 1.4 |
| 2 Passes (Double-Sided) | 0.18 | 0.46 | 0.06 | 2.2 |
| 3 Passes (Selective Rework) | 0.24 | 0.58 | 0.05 | 3.1 |
| 4 Passes (Heavy Rework) | 0.31 | 0.72 | 0.05 | 4.3 |
A third reflow pass increases accumulated inelastic strain energy density at the critical solder ball corner by twenty-four percent under Standard IEC 60749-25 thermal cycling conditions.
Higher peak reflow temperatures systematically shift the primary strain dissipation mechanism from plastic slip to creep relaxation during subsequent field operation.

Degradation
Continuum damage mechanics introduces a continuous scalar variable D representing the internal damage density of the solder joint continuum. Unblemished material corresponds to D equal to zero, while complete local structural fracture occurs when D reaches a critical threshold D_crit, typically assigned between 0.80 and 1.00. The effective elastic modulus drops as damage accumulates, defined by E_eff = E_0 (1 – D).
Damage parameter D grows non-linearly. Thermodynamic potential drives damage growth. Free energy release rate Y governs the evolution rate of damage variable D per thermal cycle N:
Y = (1 / 2) (stress_eq^2) / (E_0 (1 – D)^2) R_v
The variable R_v represents the triaxial stress factor. Coupling damage evolution to strain energy partitioning yields a damage rate kinetic equation:
dD/dN = ( (W_plastic / W_p_ref)^a + (W_creep / W_c_ref)^b ) (1 – D)^(-m)
The parameters W_p_ref and W_c_ref represent material damage reference constants. Exponents a, b, and m control damage acceleration as effective load-bearing area diminishes. Micro-voids coalesce into interior micro-cracks.
Multiple reflow passes accelerate microstructural degradation prior to thermal cycling. Thermal excursions promote coarsening of Ag3Sn intermetallics and matrix tin grains, while increasing phase segregation along grain boundaries. Pre-existing micro-voids formed during liquidus cooling serve as initial damage sites, establishing an initial non-zero damage state D_0 before thermal cycling begins.
Class 3 high-reliability assembly standards mandate that maximum solder joint damage parameter limits remain below zero point two five after all multi-pass thermal processing.
Engineers continue to debate whether scalar damage modeling sufficiently captures anisotropic crack growth along oriented tin grain boundaries in low-Ag solder formulations.

Calibration
Determining constitutive parameters for creep damage models requires empirical curve fitting across dynamic strain rates and thermal profiles. Standard uniaxial tensile tests, isothermal creep tests, and strain-controlled fatigue tests supply mechanical raw data for SAC alloys across temperatures ranging from minus forty degrees Celsius to one hundred fifty degrees Celsius. Model parameters fit empirical test loops.
What Limits Strain Energy Partitioning Calibration Accuracy?
Isothermal test data fails to capture dynamic phase transformations occurring during multi-reflow thermal histories. Testing solder specimens cast in bulk forms yields different creep constants than testing real micro-scale solder joints on printed circuit boards. Micro-scale joints exhibit constrained grain orientations and immediate access to substrate metallization copper, which rapidly alters alloy composition during liquidus phases.
Consider a worked calculation for a 1152-pin plastic ball grid array with a 0.8 mm ball pitch mounted to a 1.6 mm thick FR-4 circuit board. The operational environment imposes thermal cycling between minus forty degrees Celsius and plus one hundred twenty-five degrees Celsius with fifteen-minute dwell times. Calculate the reduction in crack initiation fatigue life between a single-reflow baseline assembly and a three-reflow assembly history using coupled continuum damage energy partitioning.
Thermal history alters solder ball compliance. Assume a baseline single-reflow initial damage state D_0 equal to 0.00. Solder initial elastic modulus E_0 equals 42 GPa.
Plastic strain energy dissipation per cycle W_plastic equals 0.18 mJ/mm³. Creep strain energy dissipation per cycle W_creep equals 0.42 mJ/mm³. Total inelastic strain energy density W_inelastic equals 0.60 mJ/mm³.
Critical damage threshold D_crit equals 0.85. Reference damage capacity W_ref equals 120 mJ/mm³.
Using the linear energy damage accumulation relation N_f = W_ref / W_inelastic:
Baseline fatigue life N_f_1 = 120 / 0.60 = 2000 cycles to crack initiation.
Now consider the three-reflow historical state. Microstructural coarsening and solidification micro-voiding establish an initial pre-damage state D_0 equal to 0.08. Intermetallic layer growth consumes base copper, reducing effective pad load-bearing radius by six percent and elevating local stress concentration factor k_t from 1.0 to 1.12.
Elevated stress increases plastic work per cycle to W_plastic equal to 0.24 mJ/mm³ and creep work per cycle to W_creep equal to 0.58 mJ/mm³. Total inelastic strain energy density W_inelastic increases to 0.82 mJ/mm³.
Adjusting fatigue life calculation for initial damage capacity loss and elevated strain energy dissipation:
N_f_3 = ( W_ref (1 – D_0) ) / W_inelastic = ( 120 (1 – 0.08) ) / 0.82 = 110.4 / 0.82 = 134.6 tens of cycles, or 1346 cycles.
The three-reflow thermal history reduces crack initiation life from 2000 thermal cycles down to 1346 thermal cycles, representing a 32.7 percent drop in fatigue endurance. Finite element calibration scripts must incorporate this pre-damage history to avoid severe overestimation of field life.
Thick multi-layer printed wiring boards subjected to multiple thermal excursions accumulate severe shear gradients at package perimeters before functional life testing even begins.
Ignoring pre-existing reflow strain damage in fatigue models produces overly optimistic life predictions that result in premature field failures and expensive warranty recalls.
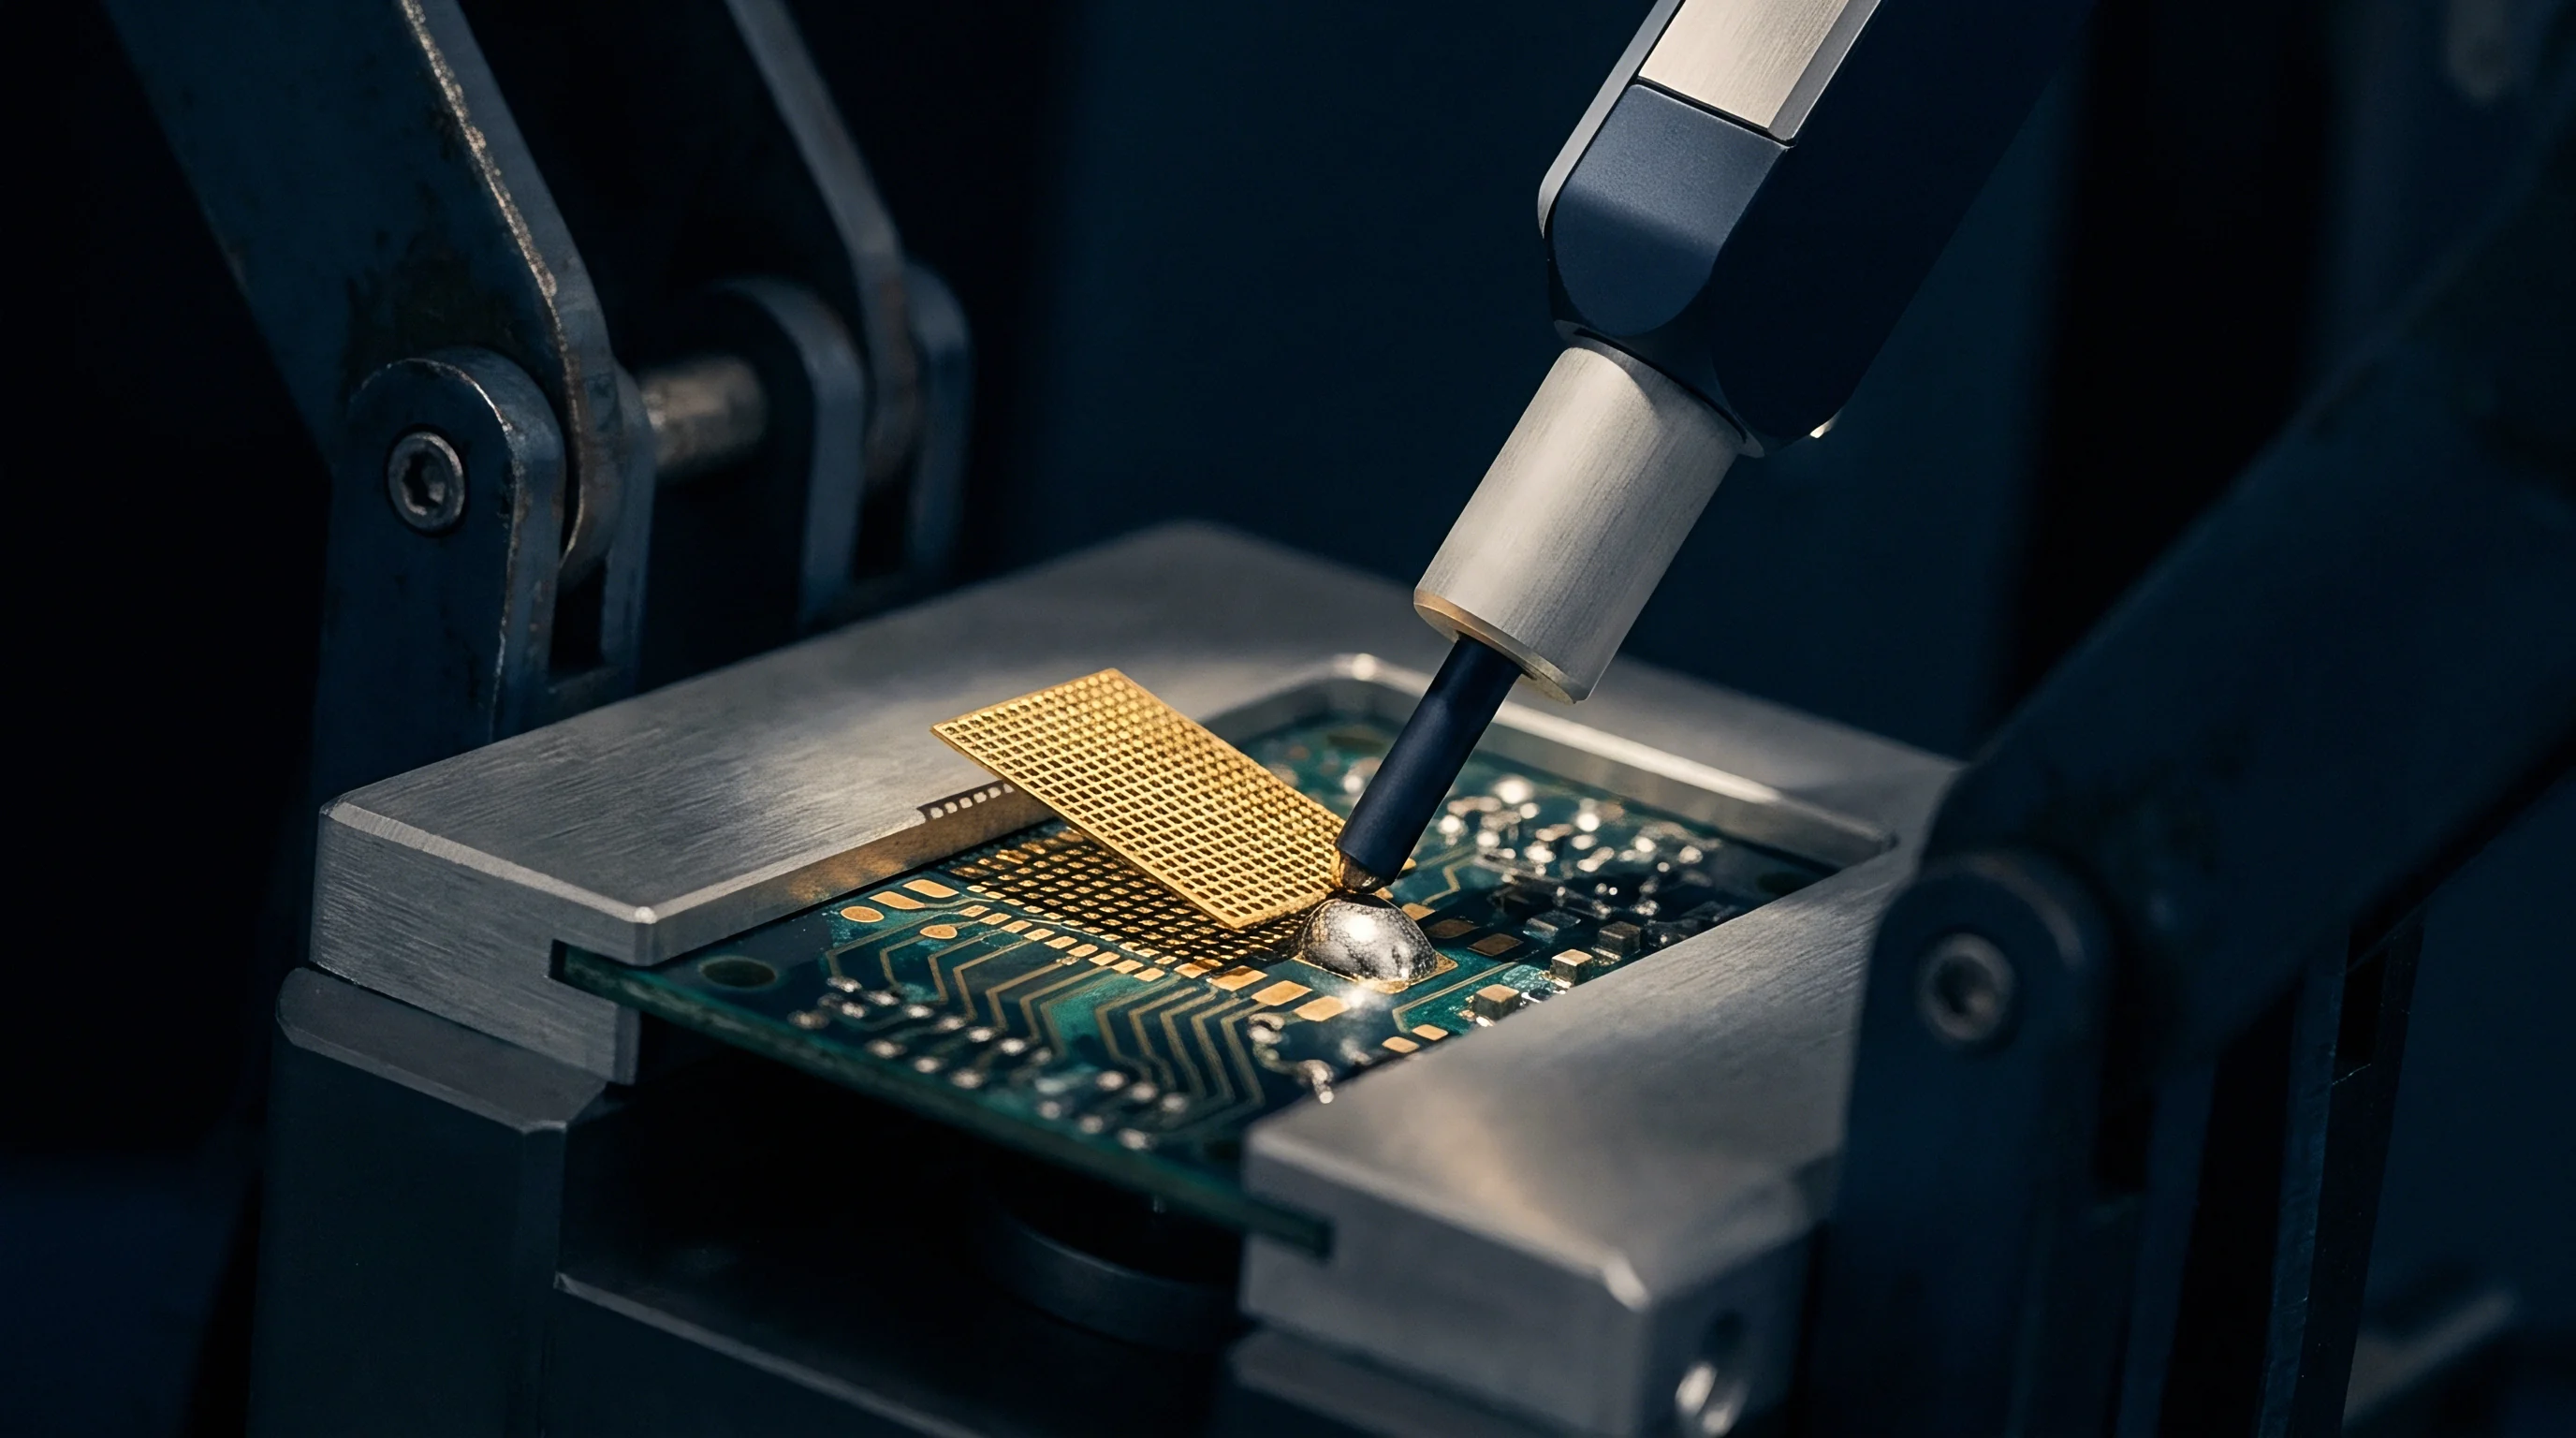
Inspection
Physical verification methods confirm finite element continuum damage predictions on actual hardware subjected to multi-reflow processing and thermal shock testing. Optical inspection tools identify external joint anomalies, but internal microstructural degradation demands advanced microsectioning and non-destructive evaluation techniques. High-resolution micro-focus X-ray computed tomography provides three-dimensional volumetric maps of internal solder voids, pad cratering micro-cracks, and structural deformation.
Microsectioning confirms intermetallic growth rates.
Planar Cu3Sn layers promote brittle failure. Metallographic cross-sectioning combined with scanning electron microscopy and energy-dispersive X-ray spectroscopy measures intermetallic compound layer thickness at the copper-solder interface. Multi-reflow processing converts scalloped Cu6Sn5 intermetallics into planar Cu3Sn layers adjacent to the copper land.
Cu3Sn layers feature elevated Kirkendall void densities, creating brittle fracture planes under mechanical shock. Polarized light microscopy reveals tin crystal orientation, showing how large single-grain or interlaced twin domains respond to strain energy accumulation.
| Method | Verification Type | Spatial Resolution | Defect Detection Capability | Cost per Module |
|---|---|---|---|---|
| High-Resolution Micro-CT | Non-Destructive Volumetric | 1.0 µm | Volumetric voiding, internal cracks | High |
| Cross-Sectional SEM/EDS | Destructive Microstructural | 5 nm | IMC thickness, Kirkendall voids | Medium |
| Polarized Optical Microscopy | Destructive Metallographic | 0.5 µm | Grain orientation, twin boundaries | Low |
| In-Situ Resistance Tracking | Continuous Electrical | 0.1 Ω delta | Dynamic crack propagation threshold | Medium |
- Prepare the BGA package by sectioning adjacent board areas with a low-speed diamond saw to prevent mechanical shock damage.
- Encapsulate the cut specimen in cold-curing epoxy resin under vacuum to fill internal voids and prevent edge rounding during grinding.
- Grind the encapsulated sample using successive silicon carbide papers from 320 grit down to 4000 grit under constant water lubrication.
- Polish the surface using diamond suspensions from 3 microns down to 0.05 micron colloidal silica on high-nap polishing cloths.
- Etch the polished cross-section briefly with ammonium persulfate solution to reveal microstructural grain boundaries and intermetallic morphology.
IPC-A-610 Class 3 acceptance criteria specify zero visible cracking across solder joints, shifting the inspection burden to structural microsectioning when multi-reflow thermal budgets exceed threshold limits.

Qualification
Production line verification translates continuum damage parameters into operational manufacturing constraints. Surface mount line engineers establish reflow profile windows that minimize cumulative thermal exposure while guaranteeing complete wetting and void elimination. Reflow profiles control intermetallic growth.
Time above liquidus management directly regulates intermetallic layer growth. SAC305 profile parameters restrict time above liquidus to forty-five to seventy-five seconds, with peak reflow temperatures maintained between 235 degrees Celsius and 245 degrees Celsius.
Thermal shielding protects adjacent surface mount packages. Rework operations represent high risk for multi-reflow damage accumulation. Localized hot gas reflow tools deliver thermal energy directly to a targeted BGA footprint, but adjacent components absorb stray thermal energy.
Specialized thermal shrouds isolate neighbouring joints, keeping their temperatures below 150 degrees Celsius to prevent secondary microstructural coarsening. Process windows protect long-term solder reliability. Tracking thermal history per board serial number ensures no board exceeds maximum thermal budgets set by finite element damage modeling.
- Thermal Budget Allocation ~ Enforce a maximum cap of three thermal reflow excursions per board assembly, including primary side, secondary side, and selective rework passes.
- Package Warpage Characterization ~ Verify package coplanar distortion remains below 0.10 millimeters across the entire operational temperature envelope using shadow moire interferometry.
- Solder Paste Transfer Efficiency Gate ~ Maintain stencil print volume transfer efficiency between eighty-five percent and one hundred fifteen percent to ensure uniform joint height and stress distribution.
Exceeding three liquidus excursions converts ductile matrix strain absorption into brittle interface failure along the copper pad boundaries.
Line speed adjustments, stencil aperture design modifications, and localized cooling nozzles optimize thermal profiles to maintain solder joint integrity across complex multi-reflow assembly sequences.