Characterizing Board Bending Strain Limits in in Circuit Testing
Characterize in-circuit test bending strain using high-speed triaxial rosettes and IPC-9704 limits to eliminate latent solder cracking and pad cratering.
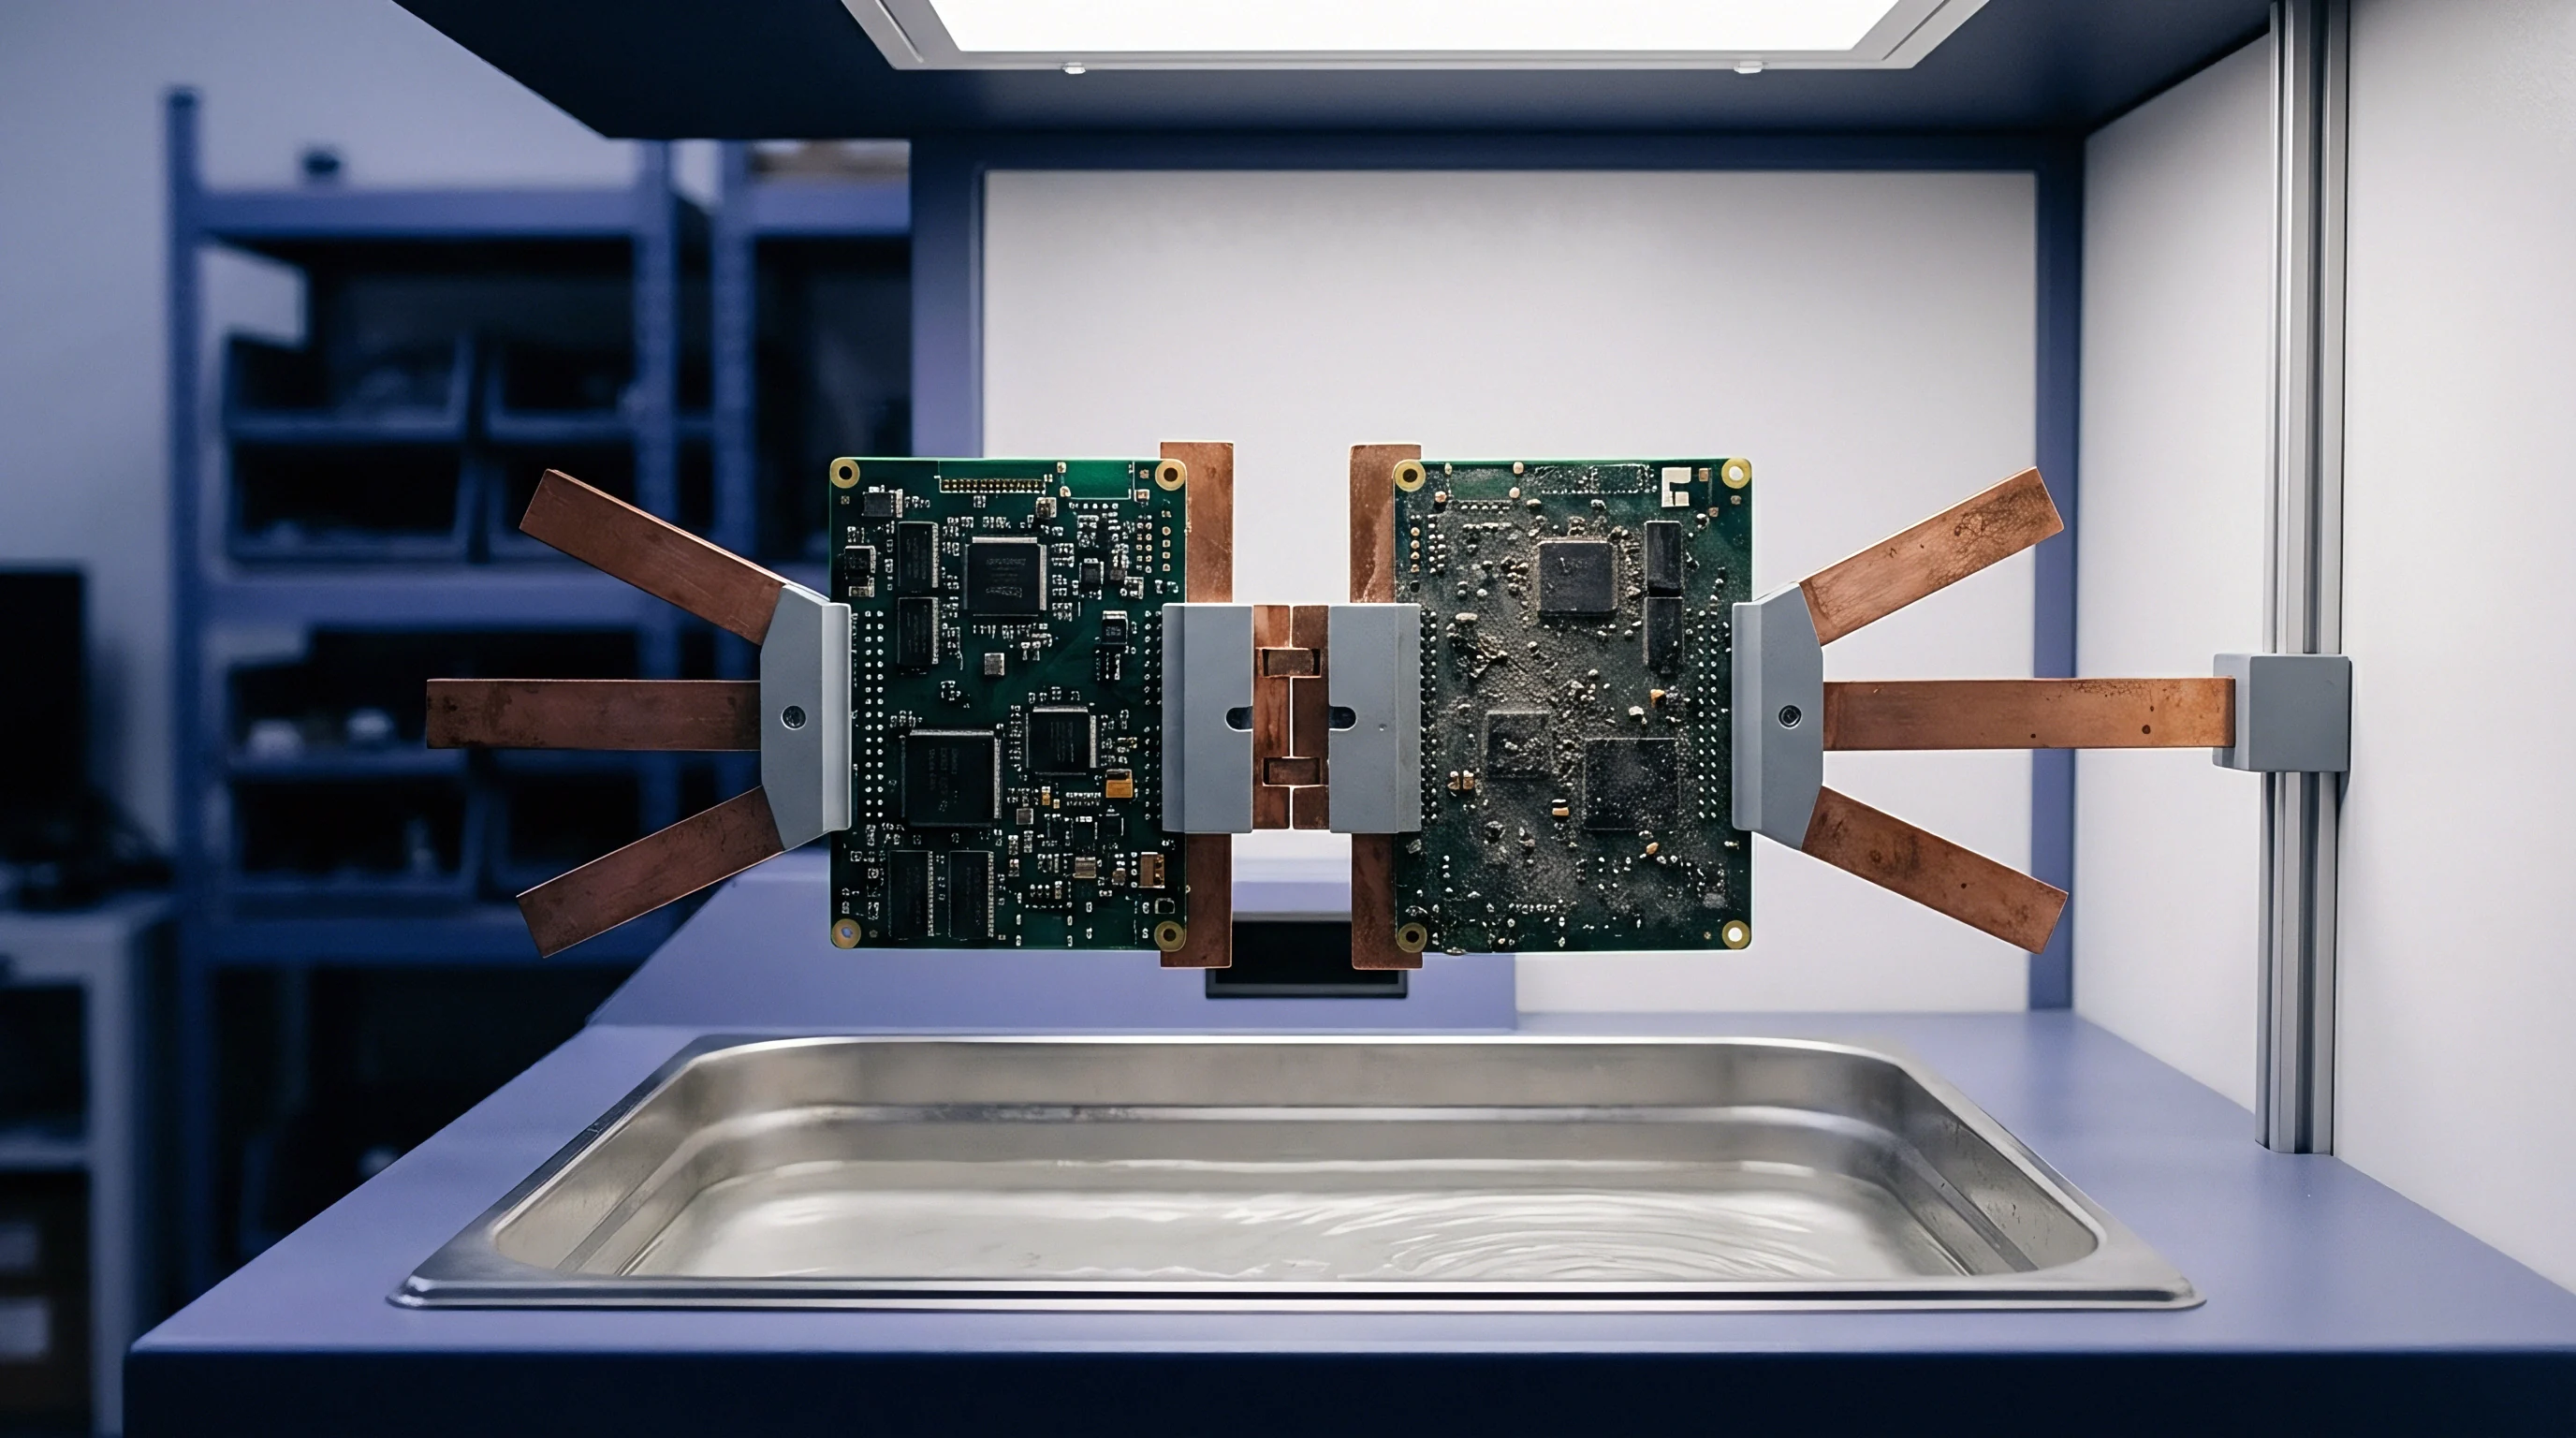
Deflection
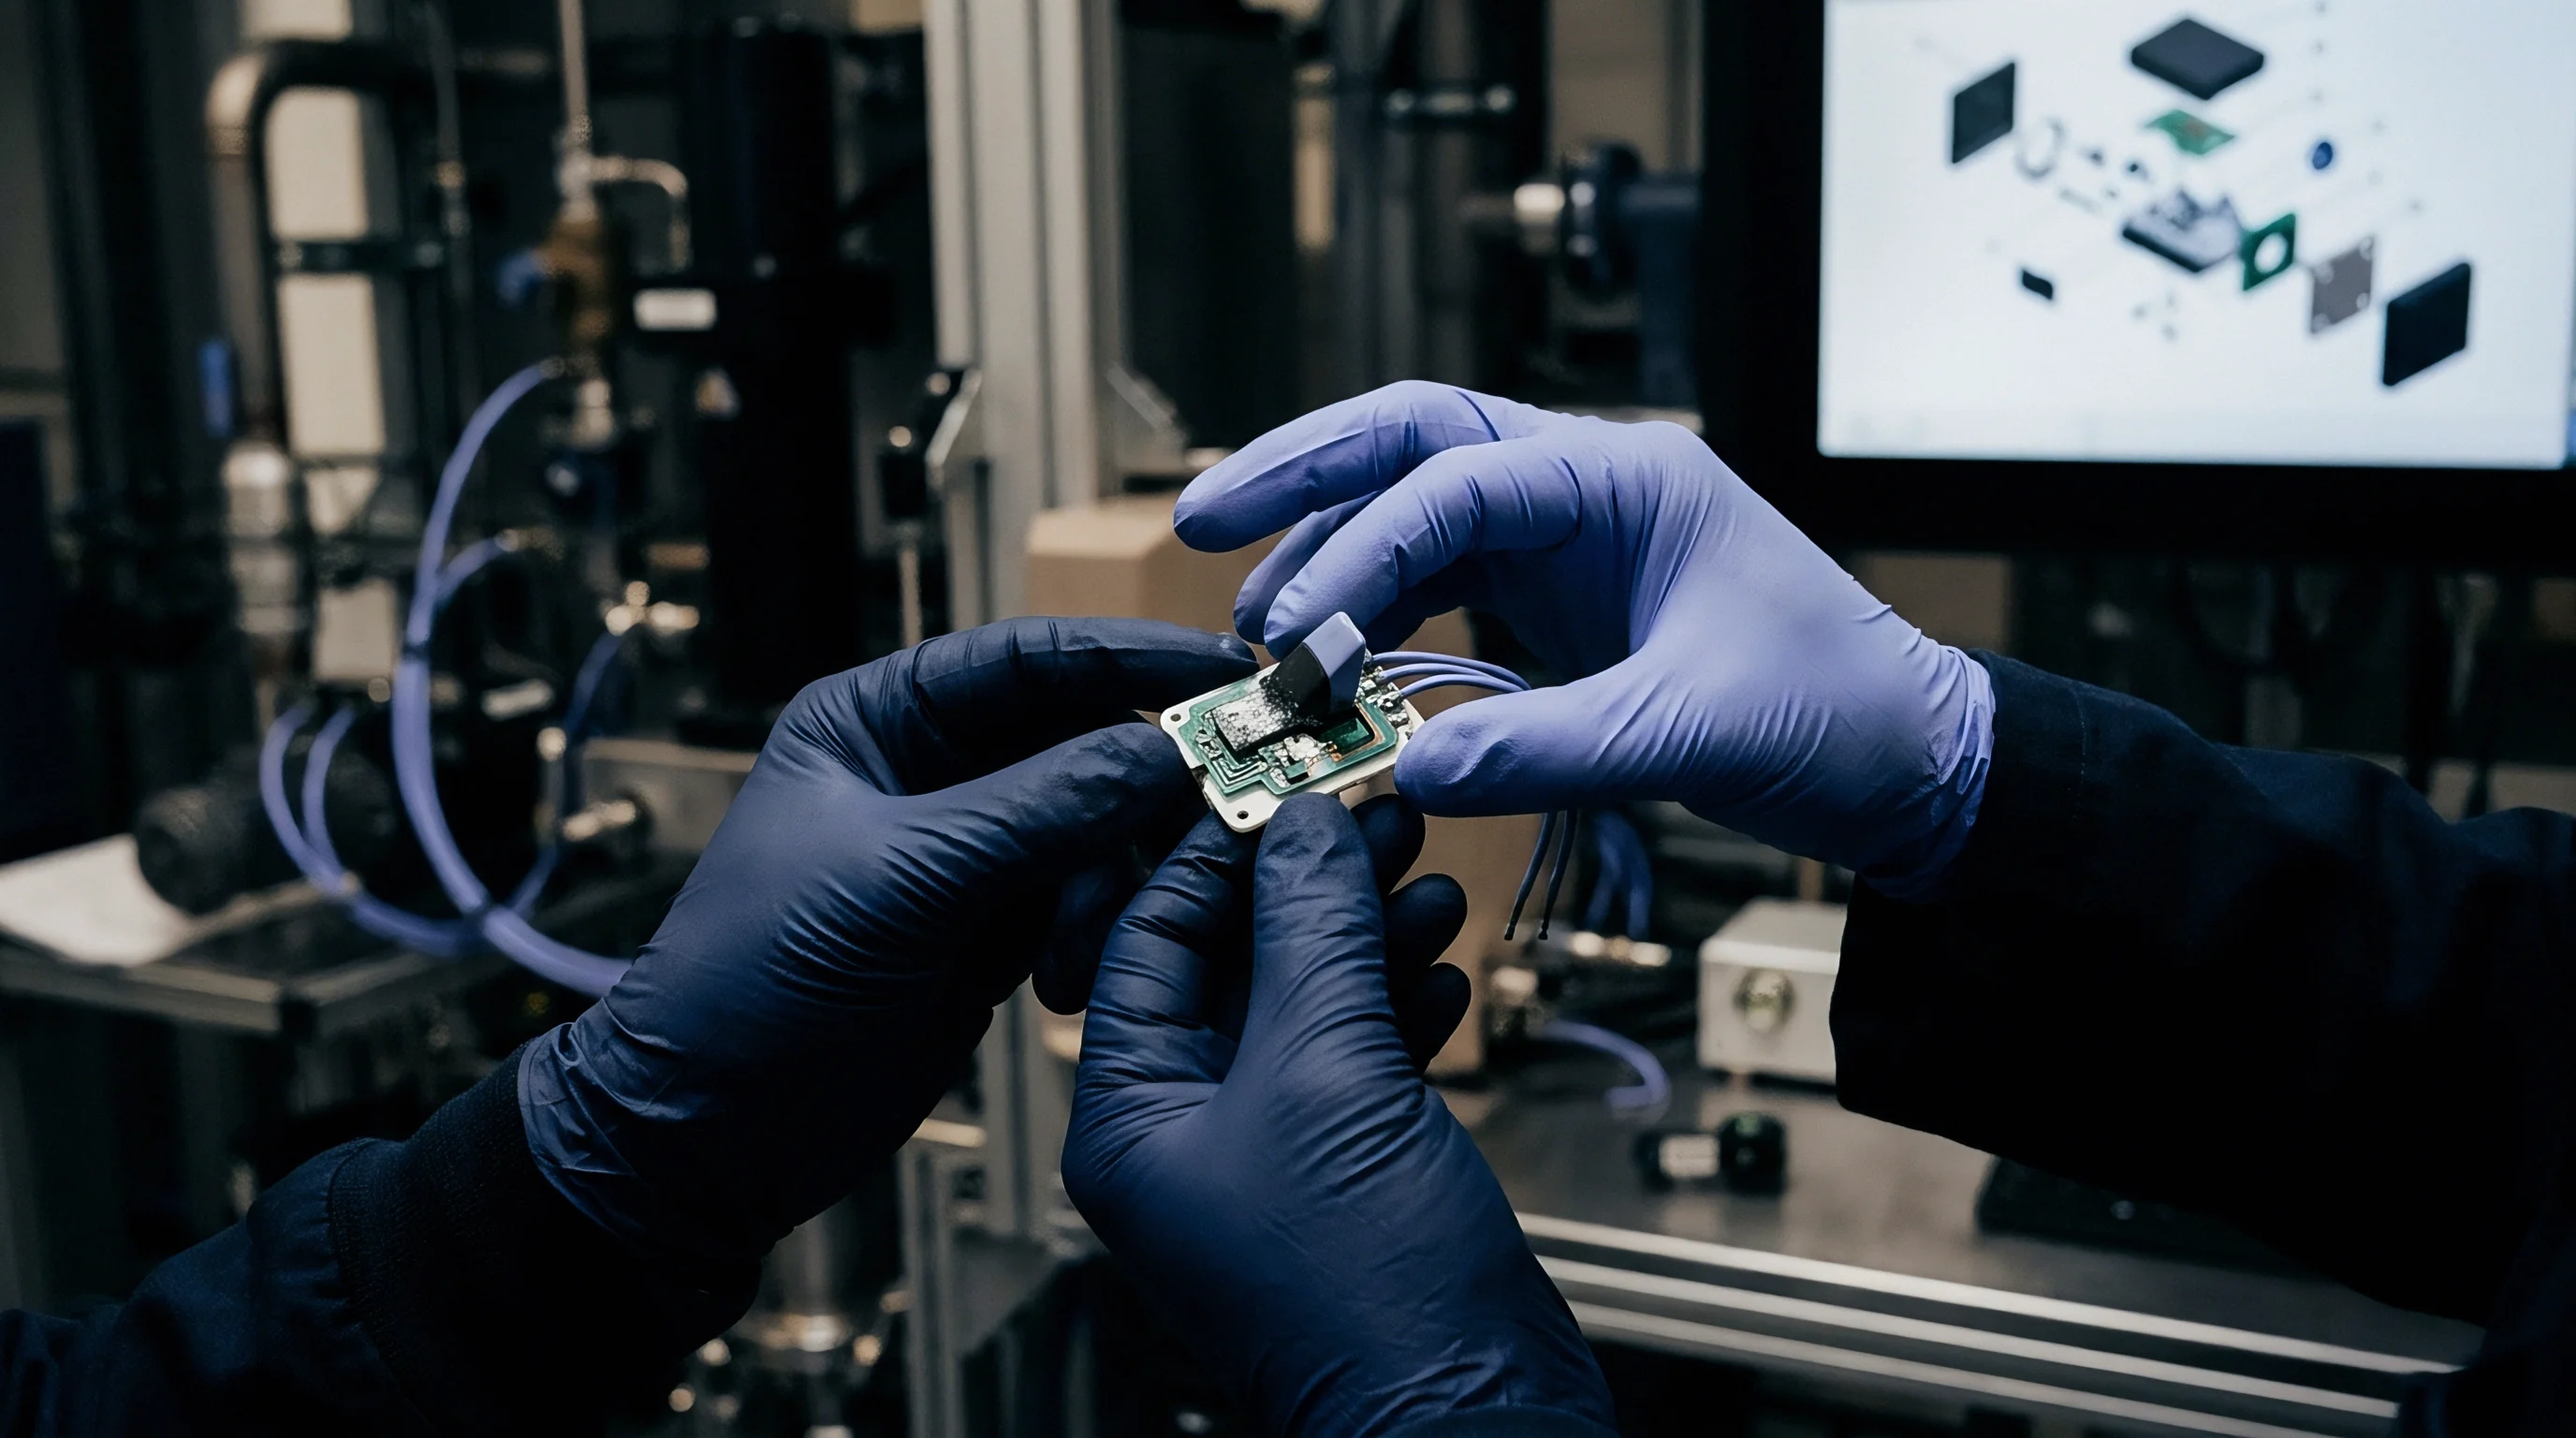
Surface Displacement and Component Microcracking
An in-circuit test fixture brings spring-loaded probes into contact with test pads at forces between 1.5 N and 3.0 N per probe. When hundreds or thousands of pins strike a printed board assembly at once, localized mechanical pressure causes out-of-plane displacement. As the laminate flexes, it transfers tensile, compressive, and shear stress directly into surface-mounted solder joints and brittle component packages.
Ceramic chip capacitors, ball grid arrays, and land grid arrays will fracture if this displacement passes critical structural limits.
Solder joints fail along two main interfaces. Tensile strain pulls intermetallic compound layers apart, separating copper-tin phases at the package pad interface, while pad cratering tears the resin matrix directly beneath the copper foil. Because the board remains compressed inside the fixture during testing, these microstructural cracks often pass initial electrical screening continuous.
The latent damage then degrades under normal operating vibration and thermal cycling until it opens up completely in the field.
Solder joints fracture when local displacement forces intermetallic boundary separation beneath compliant probe arrays.
Board deflection during fixturing creates complex multi-axis strain gradients across the assembly. IPC/JEDEC-9704 establishes the standard procedures for measuring these strains with electrical resistance strain gauges throughout assembly and testing. Fully qualifying an in-circuit test fixture requires quantitative strain mapping across every actuation phase, from pneumatic plate engagement and manual clamping to vacuum pull-down.
Vacuum fixtures apply uniform atmospheric pressure over open board spans against lower counter-probes, whereas mechanical fixtures drive concentrated point loads through pressure fingers, hold-down blocks, and push rods. These point loads create sharp local strain concentrations and steep displacement gradients across tight surface areas. To prevent latent mechanical defects, fixture design rules mandate keeping strain levels comfortably below component limits during routine production.
Standard damage models map physical board displacement directly to measured microstrain, where 1000 microstrain represents 0.1 percent elongation. Whether a solder joint fractures depends as much on the strain rate (in microstrain per second) as on peak amplitude. Rapid dynamic actuation can snap ceramic terminations instantly, whereas slow static flexure allows lead-free alloy matrices to relieve stress through creep.
High first-pass electrical yields across preliminary production runs do not rule out uncharacterized fixture displacement.
Instrumentation

Strain Gauge Selection and Triaxial Rosettes
Evaluating board strain during bed-of-nails actuation requires thin-foil electrical resistance strain gauges. Uniaxial gauges measure along a single axis and will miss off-axis tensile forces that crack packages. Capturing true principal strains requires three-element triaxial rosettes in either a 0-45-90 degree rectangular or 0-60-120 degree delta layout.
Rectangular rosettes allow direct calculation of principal strains from the three directional readings using Mohr’s circle stress transformations.
Selecting the proper gauge length determines both measurement resolution and spatial accuracy. Strain fields around surface-mount components decay sharply within millimeters of package corners; an oversized gauge averages strain across its full grid area, reporting a misleadingly low peak value. Gauge lengths of 1.0 mm or 0.8 mm provide sufficient resolution for ball grid arrays down to an 0.8 mm pitch.
For 0.4 mm and 0.5 mm pitch devices with less than 1.5 mm clearance, active grid lengths must drop to 0.35 mm.
Rosettes should be placed right at the primary stress risers across the assembly. Because the corners of a ball grid array present the sharpest stiffness mismatch against a flexible FR-4 substrate, shear strains concentrate on the outermost solder balls. Rosettes are mounted directly adjacent to package corners with the primary measuring grid perpendicular to the package edge.
On multi-layer ceramic capacitors, gauges target the center of the end-caps, where solder fillets transfer bending moments straight into the brittle barium titanate core.
A rigid adhesive bond prevents mechanical slippage between the gauge foil and the board. Cyanoacrylates create thin bond lines ideal for fast room-temperature qualification, while modified epoxies resist creep during extended testing and preserve strain transfer at elevated temperatures. Removing solder mask under the gauge remains debated: grinding down to bare copper or laminate measures true substrate strain directly, whereas bonding over intact mask includes the compliance of the underlying polymer layer.
Data Acquisition and Sampling Frequency
Capturing dynamic strain during fixture closure requires high-speed multi-channel data acquisition. Vacuum seals pull down in under 100 milliseconds and pneumatic cylinders actuate within 50 milliseconds, so slow loggers sampling at 100 Hz clip the transient strain spikes that crack components. While IPC/JEDEC-9704 sets a minimum simultaneous sampling rate of 500 Hz per channel, thorough characterizations use 2.0 kHz to 10.0 kHz to resolve pneumatic valve bounce and mechanical push-plate slap.
Wheatstone quarter-bridge circuits convert gauge resistance changes into proportional voltage outputs. Lead-wire resistance, thermal drift, and solenoid noise can easily introduce offset errors. Three-wire quarter-bridge setups cancel out lead-wire temperature shifts during extended testing, while shielded twisted-pair cabling protects microstrain waveforms from 50/60 Hz line noise and switching transients.
| Fixture Actuation Mechanism | Minimum Sampling Frequency | Bridge Circuit Configuration | Gauge Active Grid Length | Target Dynamic Event Duration |
|---|---|---|---|---|
| Pneumatic Top Clamping | 2.0 kHz | Three-wire quarter bridge | 1.0 mm | 15 ms to 60 ms |
| Pneumatic Gate Edge Clamp | 5.0 kHz | Three-wire quarter bridge | 0.8 mm | 5 ms to 25 ms |
| Vacuum Pull-Down Chamber | 1.0 kHz | Three-wire quarter bridge | 1.5 mm | 100 ms to 350 ms |
| Manual Lever Action Press | 500 Hz | Three-wire quarter bridge | 1.0 mm | 200 ms to 800 ms |
Zero-strain baselines must be calibrated before running each actuation profile. Board retaining clips, guide pins, and support blocks introduce pre-strain even before test probes touch the pads. Recording zero balances with the board resting completely unrestrained allows acquisition software to track pre-clamp offsets, dynamic closure peaks, static holds, and release rebound strains independently.
Breaking the cycle into discrete phases reveals whether excessive strain comes from misaligned tooling or over-concentrated probe forces.
As probe springs accumulate cycles and push rods loosen, every fixture’s mechanical response drifts over time, making periodic re-qualification essential.

Kinetics
Principal Strain and Shear Strain Calculations
A triaxial rosette measures normal strain along three axes: epsilon-a (0 degrees), epsilon-b (45 degrees), and epsilon-c (90 degrees). Plane strain equations reduce these raw directional readings into maximum principal strain, minimum principal strain, and maximum in-plane shear strain. Because brittle electronic materials fail under direct tensile separation, component cracking risk correlates most closely with maximum principal tensile strain.
Calculating principal strains follows standard transformation equations:
The center strain component equals (epsilon-a plus epsilon-c) divided by two.
The planar strain radius equals the square root of ((epsilon-a minus epsilon-c) squared plus (two times epsilon-b minus epsilon-a minus epsilon-c) squared) divided by two.
Maximum principal strain (e1) equals the center component plus the planar strain radius.
Minimum principal strain (e2) equals the center component minus the planar strain radius.
Maximum in-plane shear strain (gamma-max) equals two times the planar strain radius.
Positive principal strain indicates tensile stress across the component termination, while negative values reflect compressive loading. Lead-free intermetallics like Cu6Sn5 and Cu3Sn exhibit tensile fracture strengths of 100 to 120 MPa, but tolerate much higher compressive stress before failing. Planar shear strain drives solder ball fatigue and pad peeling around the perimeter of BGAs, where lateral substrate expansion meets the rigid package body.
Strain Rate and Diagonal Strain Mechanics
Strain rate measures how fast deformation occurs during fixture actuation and is calculated as the first time derivative of principal strain (in microstrain per second). High strain rates severely reduce the plastic deformation capacity of SAC305 (96.5Sn-3.0Ag-0.5Cu) solder. While slow loading allows solder creep to relieve mechanical stress safely, strain rates above 10,000 microstrain per second trigger immediate brittle fracture along intermetallic interfaces.
IPC/JEDEC-9704 introduces diagonal strain as a key metric for evaluating area-array packages. This measures elongation along the line extending from the package center through its corner solder joints. Bending moments aligned with the package diagonal generate severe peeling forces on outer corner balls, making diagonal strain a sensitive indicator of joint stress during uneven fixture closure.
A rising strain rate compresses the plastic deformation margin of SAC alloys, accelerating pad cratering beneath outer joints.
Multi-layer laminates exhibit orthotropic mechanical behavior, complicating theoretical strain predictions. FR-4 woven glass-epoxy cores have different elastic moduli along the warp (around 22 GPa) and fill (around 18 GPa) directions. When push fingers exert vertical force on unsupported board spans, the panel flexes along its more compliant axis first, inducing asymmetric strain across symmetrically placed components.
At lower strain rates, copper traces share structural load with the surrounding resin, dampening local stress concentrations.
Limits
IPC-9704 and IPC-9702 Threshold Formulations
Applying a single, blanket strain limit offers inadequate protection for modern electronics. Setting a fixed 500-microstrain ceiling across an entire assembly ignores component sizes, laminate thickness, and local strain rates. IPC-9702 and IPC-9704 evaluate dynamic strain using allowable limit curves where maximum permissible principal strain scales inversely with the log of the measured strain rate.
Under IPC-9704, allowable strain follows an inverse power relationship across strain rate bands. On a standard 1.6 mm FR-4 board with large BGAs, allowable strain drops from roughly 1000 microstrain at a static rate of 10 microstrain per second down to 350 microstrain at dynamic rates above 100,000 microstrain per second. Thinner boards can tolerate greater flexural strain before reaching equivalent surface stress, as elongation scales with distance from the neutral bending axis.
IPC-9704 calculates allowable microstrain limits using component package length, board thickness, and empirical risk coefficients:
Allowable Strain equals Strain-Limit-Base multiplied by (Thickness divided by 1.6 mm) raised to the exponent n, scaled by the strain rate factor.
Large package footprints cut allowable board strain drastically. A 40 mm by 40 mm package stiffens the local board area, concentrating flexure right along its perimeter. In contrast, a 10 mm by 10 mm package bends with the substrate, distributing strain across fewer, more compliant joints.
As a result, critical strain limits for small packages sit well above those for large area-array processors.
Can Solder Composition Shift Critical Bending Thresholds?
Solder metallurgy directly alters critical bending limits during in-circuit testing. Traditional Sn63Pb37 eutectic solder is ductile and yields at lower stress, giving joints flexibility under flexural load. By contrast, lead-free alloys like SAC305 and SAC405 feature higher elastic moduli and yield strengths, transferring bending forces directly into the copper pad and resin matrix to accelerate pad cratering.
Low-silver and bismuth-bearing alloys change joint fracture behavior significantly. SAC105 (98.5Sn-1.0Ag-0.5Cu) lowers bulk stiffness compared to SAC305, improving dynamic flexural resilience and raising critical strain limits by 15 to 25 percent. Conversely, tin-bismuth (Sn42Bi58) and bismuth-doped low-temperature alloys form brittle phases that reduce strain tolerance; under standard dynamic test speeds, allowable strain for bismuth-bearing joints drops below 250 microstrain.
| Component Package Class | Body Size Footprint | Solder Alloy Composition | Maximum Allowable Tensile Strain | Primary Mechanical Failure Mode |
|---|---|---|---|---|
| Multi-layer Ceramic Capacitor 0402 | 1.0 mm by 0.5 mm | SAC305 | 800 microstrain | Ceramic body cleavage |
| Multi-layer Ceramic Capacitor 1206 | 3.2 mm by 1.6 mm | SAC305 | 350 microstrain | End termination cap cracking |
| Fine-Pitch BGA (0.5 mm pitch) | 12 mm by 12 mm | SAC305 | 500 microstrain | Pad cratering beneath corner ball |
| Standard BGA (1.0 mm pitch) | 27 mm by 27 mm | SAC305 | 420 microstrain | Intermetallic fracture at component interface |
| Large High-Density BGA | 45 mm by 45 mm | SAC305 | 280 microstrain | Resin tearing and trace fracture |
| Standard BGA (1.0 mm pitch) | 27 mm by 27 mm | Sn63Pb37 Eutectic | 650 microstrain | Bulk solder ductile tear |
| Standard BGA (1.0 mm pitch) | 27 mm by 27 mm | Sn42Bi58 Low Temp | 210 microstrain | Brittle cleavage through bulk alloy |
Surface finish also dictates interfacial fracture toughness. Electroless nickel immersion gold (ENIG) forms brittle nickel-tin intermetallic compounds (Ni3Sn4) that crack under lower tensile strain than joints over organic solderability preservatives (OSP) or immersion silver. ENIG finishes are also prone to hyper-corrosion (black pad), which can separate under actuation strains as low as 200 microstrain.
Omitting solder alloy and surface finish from strain specifications leaves fragile board configurations unmonitored during aggressive test actuation.
Fixture
Probe Force Mechanics and Counter-Support Layout
An in-circuit test fixture acts as a heavy mechanical press. Standard spring probes exert 1.5 N to 3.0 N of contact force at nominal travel to penetrate surface oxides, flux residues, and conformal coatings. A complex board with 2,000 test points receives a combined downward load between 3,000 N and 6,000 N; without matching counter-supports beneath the probe field, this force flexes the assembly downward during probe engagement.
Bottom-plate support pins must directly oppose probe forces. Placing a support pin more than 10 mm outside a dense probe cluster creates a severe shear moment, causing the board to sag between supports and peak over rigid pins. Top push rods must align vertically with bottom support pins within tight tolerances to keep the laminate in pure compression and eliminate flexural bending moments.
Fixture design requires strict structural verification:
- Bottom Support Pin Positioning places support pins within 5.0 mm of dense probe clusters, transferring load directly to the aluminum base plate.
- Top Push Finger Alignment mirrors bottom support coordinates within 0.5 mm coaxial alignment to prevent board twisting.
- Clearance from Fragile Packages maintains at least 3.0 mm clearance between hold-down fingers and the perimeter of ceramic capacitors or BGAs.
- Guide Pin Engagement Timing ensures alignment pins engage tooling holes before spring probes make contact, avoiding lateral shear across the board.
Vacuum Actuation against Mechanical Push Plates
Vacuum fixtures seal the board perimeter and evacuate the cavity below, relying on atmospheric pressure (101.3 kPa) to force the assembly down against spring probes. While atmospheric pressure acts uniformly over open spans, areas with dense bottom-side components cannot sit flat against support plates. The resulting pressure differential flexes unsupported spans into the cavity, generating high tensile strain on top-side components.
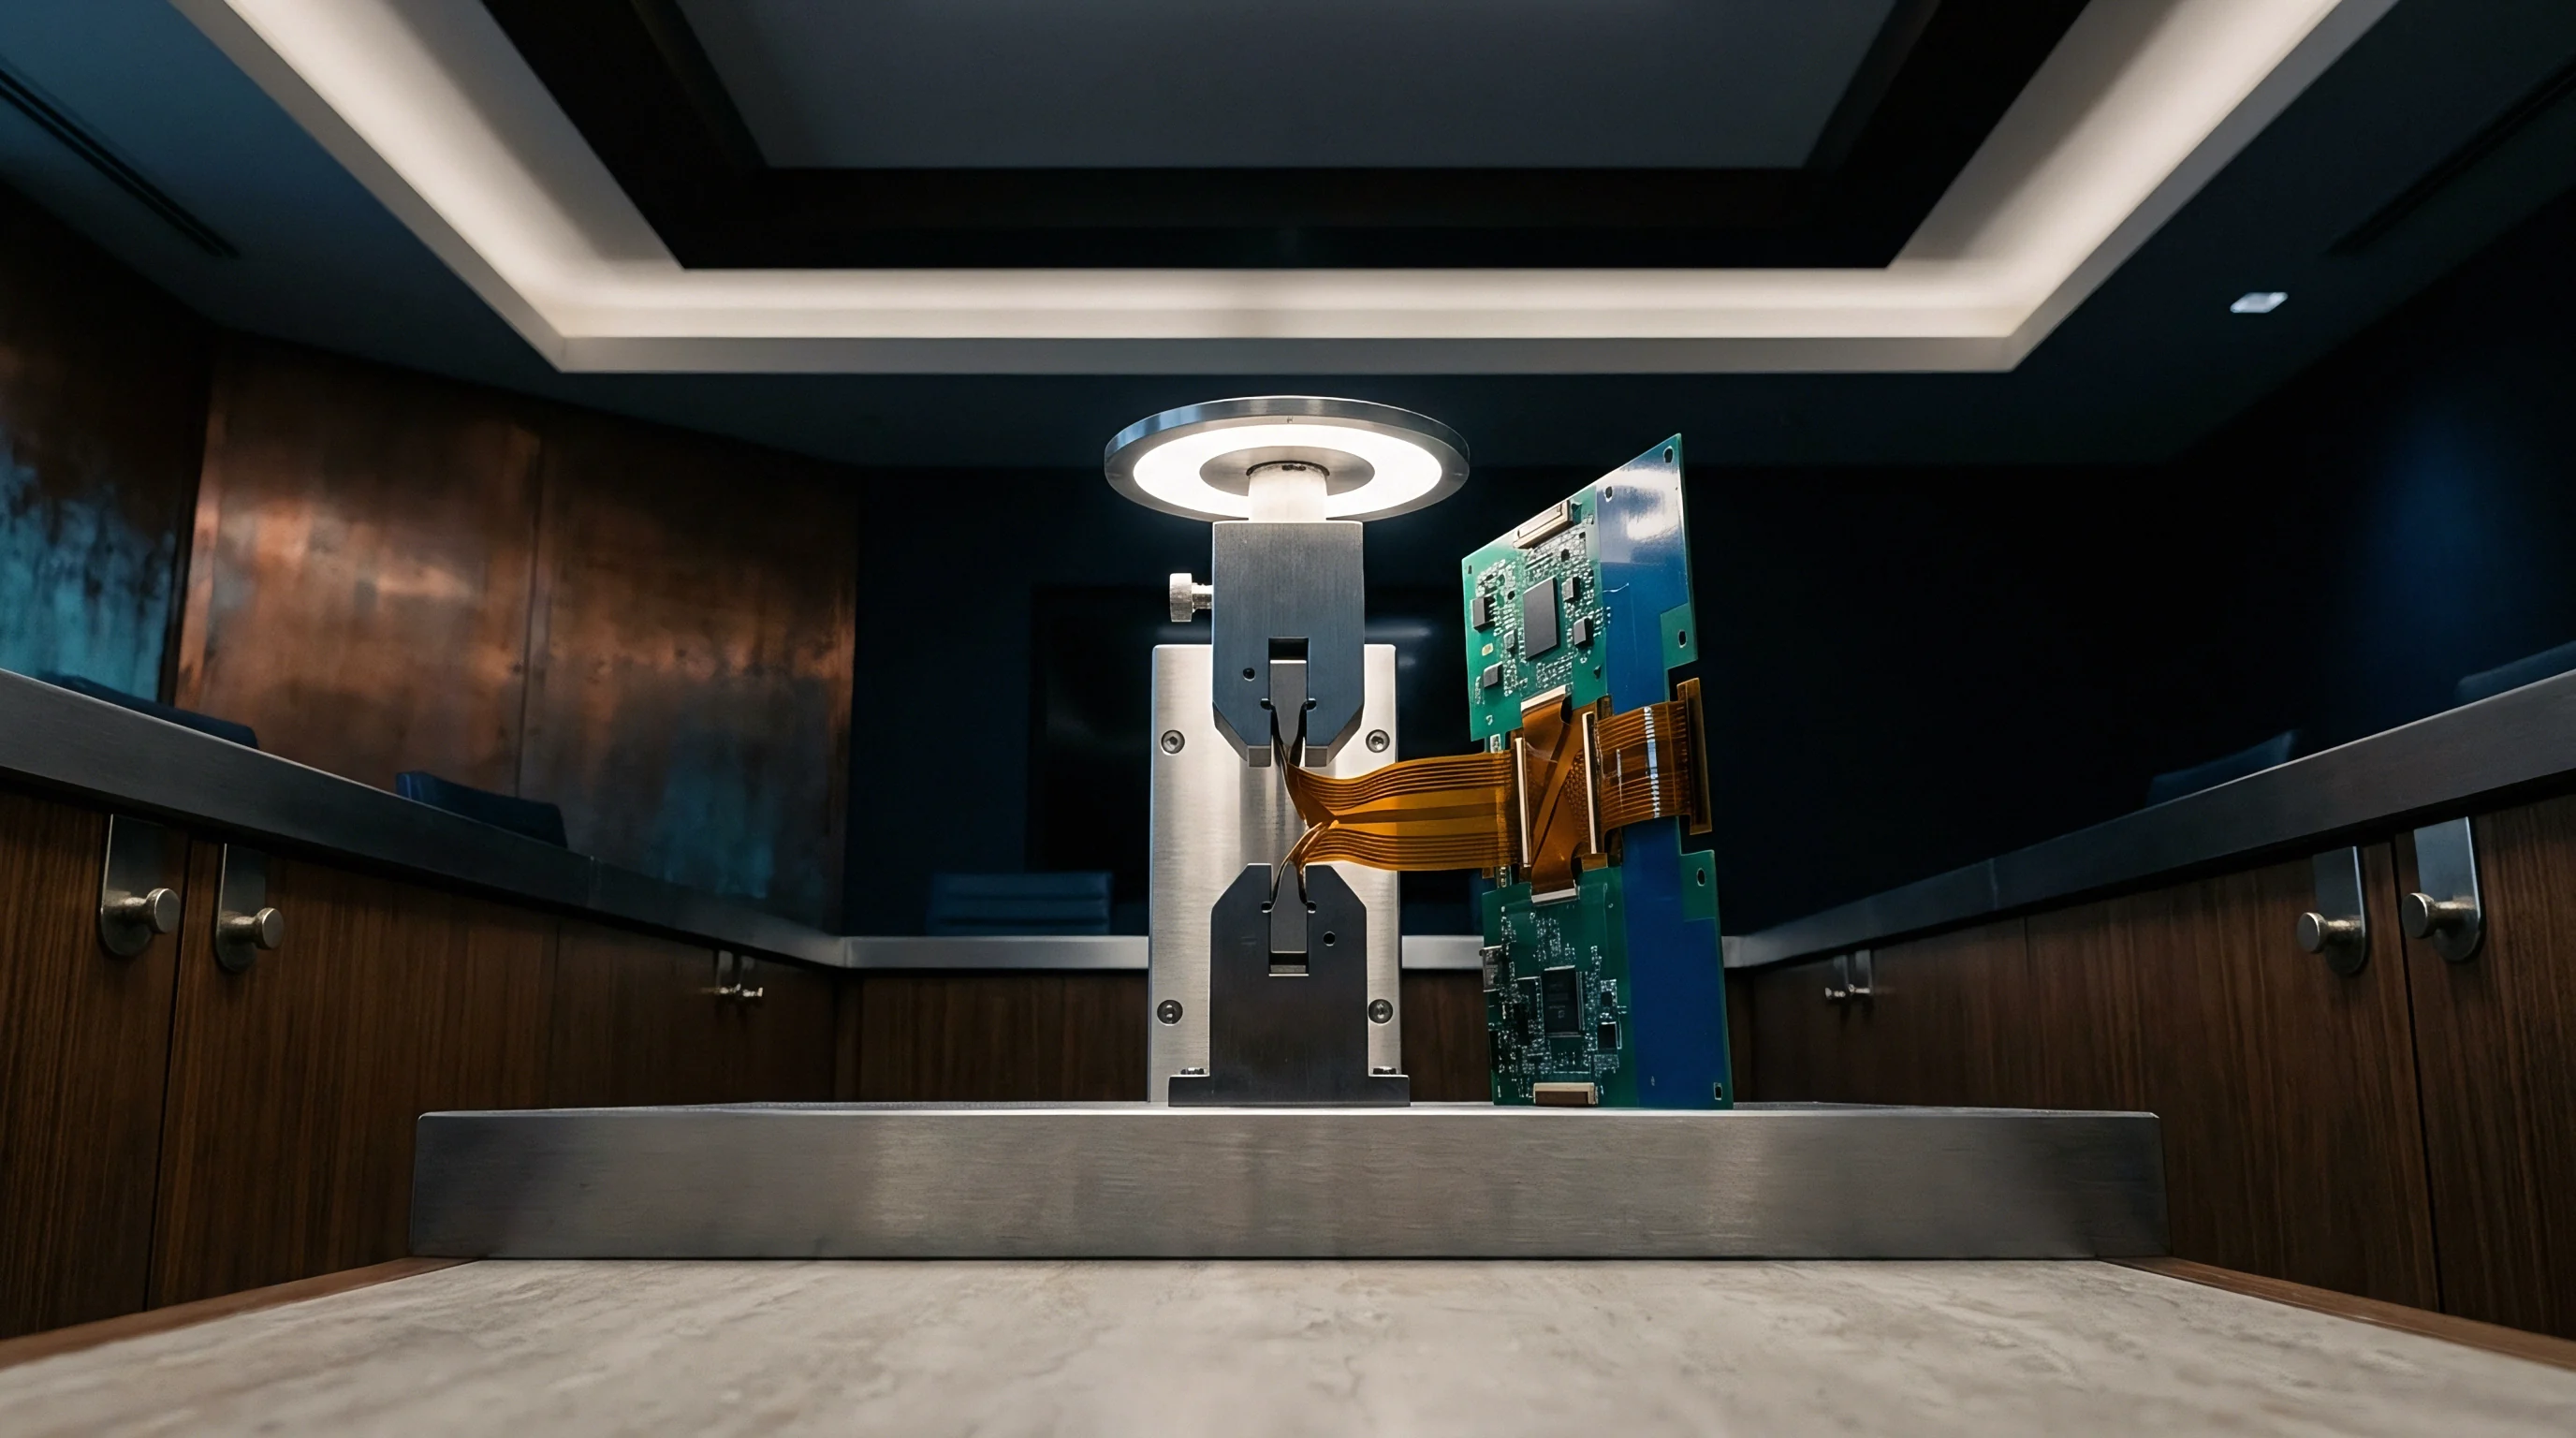
Mechanical fixtures dispense with vacuum seals, driving a top plate down via pneumatic cylinders or mechanical levers. Here, top push rods deliver concentrated point loads onto designated bare-board areas. If push rod lengths vary due to manufacturing tolerances, an overly long rod will take the initial clamping force, forcing the local board area into sharp downward curvature before neighboring fingers make contact.
Dynamic strain recordings capture these events as short, high-amplitude spikes.
Point-load push pins generate steep localized strain gradients that uniform vacuum seals avoid over flat board spans.
A rigorous qualification sequence systematically monitors fixture installation mechanics:
- Load strain-gauged test samples into the unpowered fixture with acquisition channels armed and zero-balanced.
- Record baseline strain during manual engagement, capturing gate closure and initial tooling pin entry.
- Run full pneumatic or vacuum actuation cycles at operating line pressure, logging dynamic strain and calculating instantaneous strain rates across all channels.
- Hold the fixture fully engaged for 30 seconds to record static equilibrium strain and time-dependent creep.
- Release the fixture, capturing rebound strain transients as spring probes push the board up off its support pins.
- Plot principal strain and strain rate pairs against IPC-9704 boundary curves to evaluate compliance.
Fixtures that pass strain qualification under slow manual operation frequently breach limits when driven by full pneumatic line pressure.
Qualification
Sample Size and Gauge Placement Protocols
Strain qualification requires test samples built from functional or mechanically equivalent boards. Thermal history alters substrate stiffness: boards passed through reflow ovens three times exhibit lower flexural rigidity than unheated panels due to resin relaxation and moisture loss. Using unpopulated boards produces invalid strain data because absent components fail to provide the localized mechanical stiffening present on production assemblies.
A complete qualification protocol requires at least three fully reflowed, dimensionally verified boards. Gauges target component sites identified as mechanically vulnerable during design review: large area-array packages (over 20 mm per side), ceramic capacitors larger than 0805 located within 10 mm of hold-downs, corners of board cutouts, and components adjacent to dense probe fields.

Worked Assessment of a Dense Server Mainboard
Consider a qualification test on an eight-layer server peripheral board measuring 250 mm by 180 mm with a 1.6 mm laminate thickness. The board carries an FPGA in a 35 mm by 35 mm BGA package and features 1,450 test pads concentrated under the processor and memory zones. Actuation uses a double-sided pneumatic press delivering a total probe contact force of 3,200 N. Triaxial rosettes (Rosettes 1 through 4) are attached to all four corners of the FPGA package.
During initial engagement at 0.6 MPa pneumatic pressure, Rosette 3 (near a peripheral vacuum port) registered raw strain readings of epsilon-a = 240 microstrain, epsilon-b = 195 microstrain, and epsilon-c = 70 microstrain over a dynamic rise time of 12 milliseconds.
Calculating the principal strains establishes the mechanical state:
The center strain component equals (240 plus 70) divided by two, yielding 155 microstrain.
The planar strain radius equals the square root of ((240 minus 70) squared plus (two times 195 minus 240 minus 70) squared) divided by two, evaluating to 95 microstrain.
Maximum principal strain (e1) equals 155 plus 95, yielding 250 microstrain.
Minimum principal strain (e2) equals 155 minus 95, yielding 60 microstrain.
Maximum in-plane shear strain (gamma-max) equals two times 95, yielding 190 microstrain.
The instantaneous strain rate during closure reached 20,833 microstrain per second (250 microstrain divided by 0.012 seconds). On the IPC-9704 damage curve for a 35 mm package on 1.6 mm laminate, the allowable limit at 20,800 microstrain per second is 225 microstrain. The measured peak of 250 microstrain exceeds this limit by 11.1 percent, requiring fixture rework.
Adding an adjustable bottom support pin 6.0 mm from Rosette 3 dropped maximum principal strain to 135 microstrain upon re-testing, bringing the site into compliance.
| Measurement Rosette Site | Monitored Component | Maximum Principal Strain | Dynamic Strain Rate | Allowable Strain Threshold | Qualification Outcome |
|---|---|---|---|---|---|
| Rosette 1 (Top Left) | FPGA Corner Ball A1 | 145 microstrain | 12,500 ustrain/s | 260 microstrain | Pass |
| Rosette 2 (Top Right) | FPGA Corner Ball A35 | 180 microstrain | 16,000 ustrain/s | 245 microstrain | Pass |
| Rosette 3 (Bottom Left) | FPGA Corner Ball AJ1 | 250 microstrain | 20,833 ustrain/s | 225 microstrain | Fail (Unmodified) |
| Rosette 3 (Re-tested) | FPGA Corner Ball AJ1 | 135 microstrain | 11,200 ustrain/s | 270 microstrain | Pass (Modified) |
| Rosette 4 (Bottom Right) | FPGA Corner Ball AJ35 | 165 microstrain | 14,100 ustrain/s | 255 microstrain | Pass |
| Rosette 5 (Edge Mount) | 1206 Capacitor C112 | 310 microstrain | 25,400 ustrain/s | 330 microstrain | Pass |
Modifying fixture mechanics alters load paths permanently, requiring full strain re-characterization before equipment release.

Governance

Technical Dossiers and Acceptance Testing Conditions
Board strain limits must be formally integrated into equipment qualification dossiers and procurement contracts. Buyers purchasing assembled boards should require signed strain characterization reports before approving line release. Vendor self-certification leaves manufacturing exposed to unverified tooling wear, misconfigured air regulators, and poorly positioned support pins.
A complete fixture qualification dossier contains specific empirical proofs:
- Raw Strain Time-History Waveforms showing all rosette channels across complete actuation cycles from rest to disengagement.
- Calibration Records documenting zero balance dates, shunt calibration verifications, and bridge voltage stability for instrumentation.
- Photographic Rosette Mappings showing precise gauge locations, wire exit paths, and proximity to critical solder joints.
- Fixture Mechanical Drawings detailing top push rod and bottom support pin coordinates, heights, and tip materials.
Factory audits must verify that pneumatic regulator settings match qualified conditions. Bumping line pressure from 0.4 MPa to 0.7 MPa to shorten cycle times increases actuation velocity, driving strain rates past allowable limits. Pneumatic controls should be locked behind physical covers or software access controls to prevent unauthorized adjustment on the shop floor.
Supply contracts should define liability for latent joint defects caused by uncharacterized test fixtures. A clear clause stipulating that failures in uncharacterized or modified fixtures void supplier workmanship protections places sorting, rework, and warranty costs directly on the assembly contractor.