Printed Circuit Board Mechanical Strain Testing Standard Principles
Strain gage testing establishes microstrain and strain rate boundaries across assembly steps to prevent solder joint rupture and laminate pad cratering.
Rupture
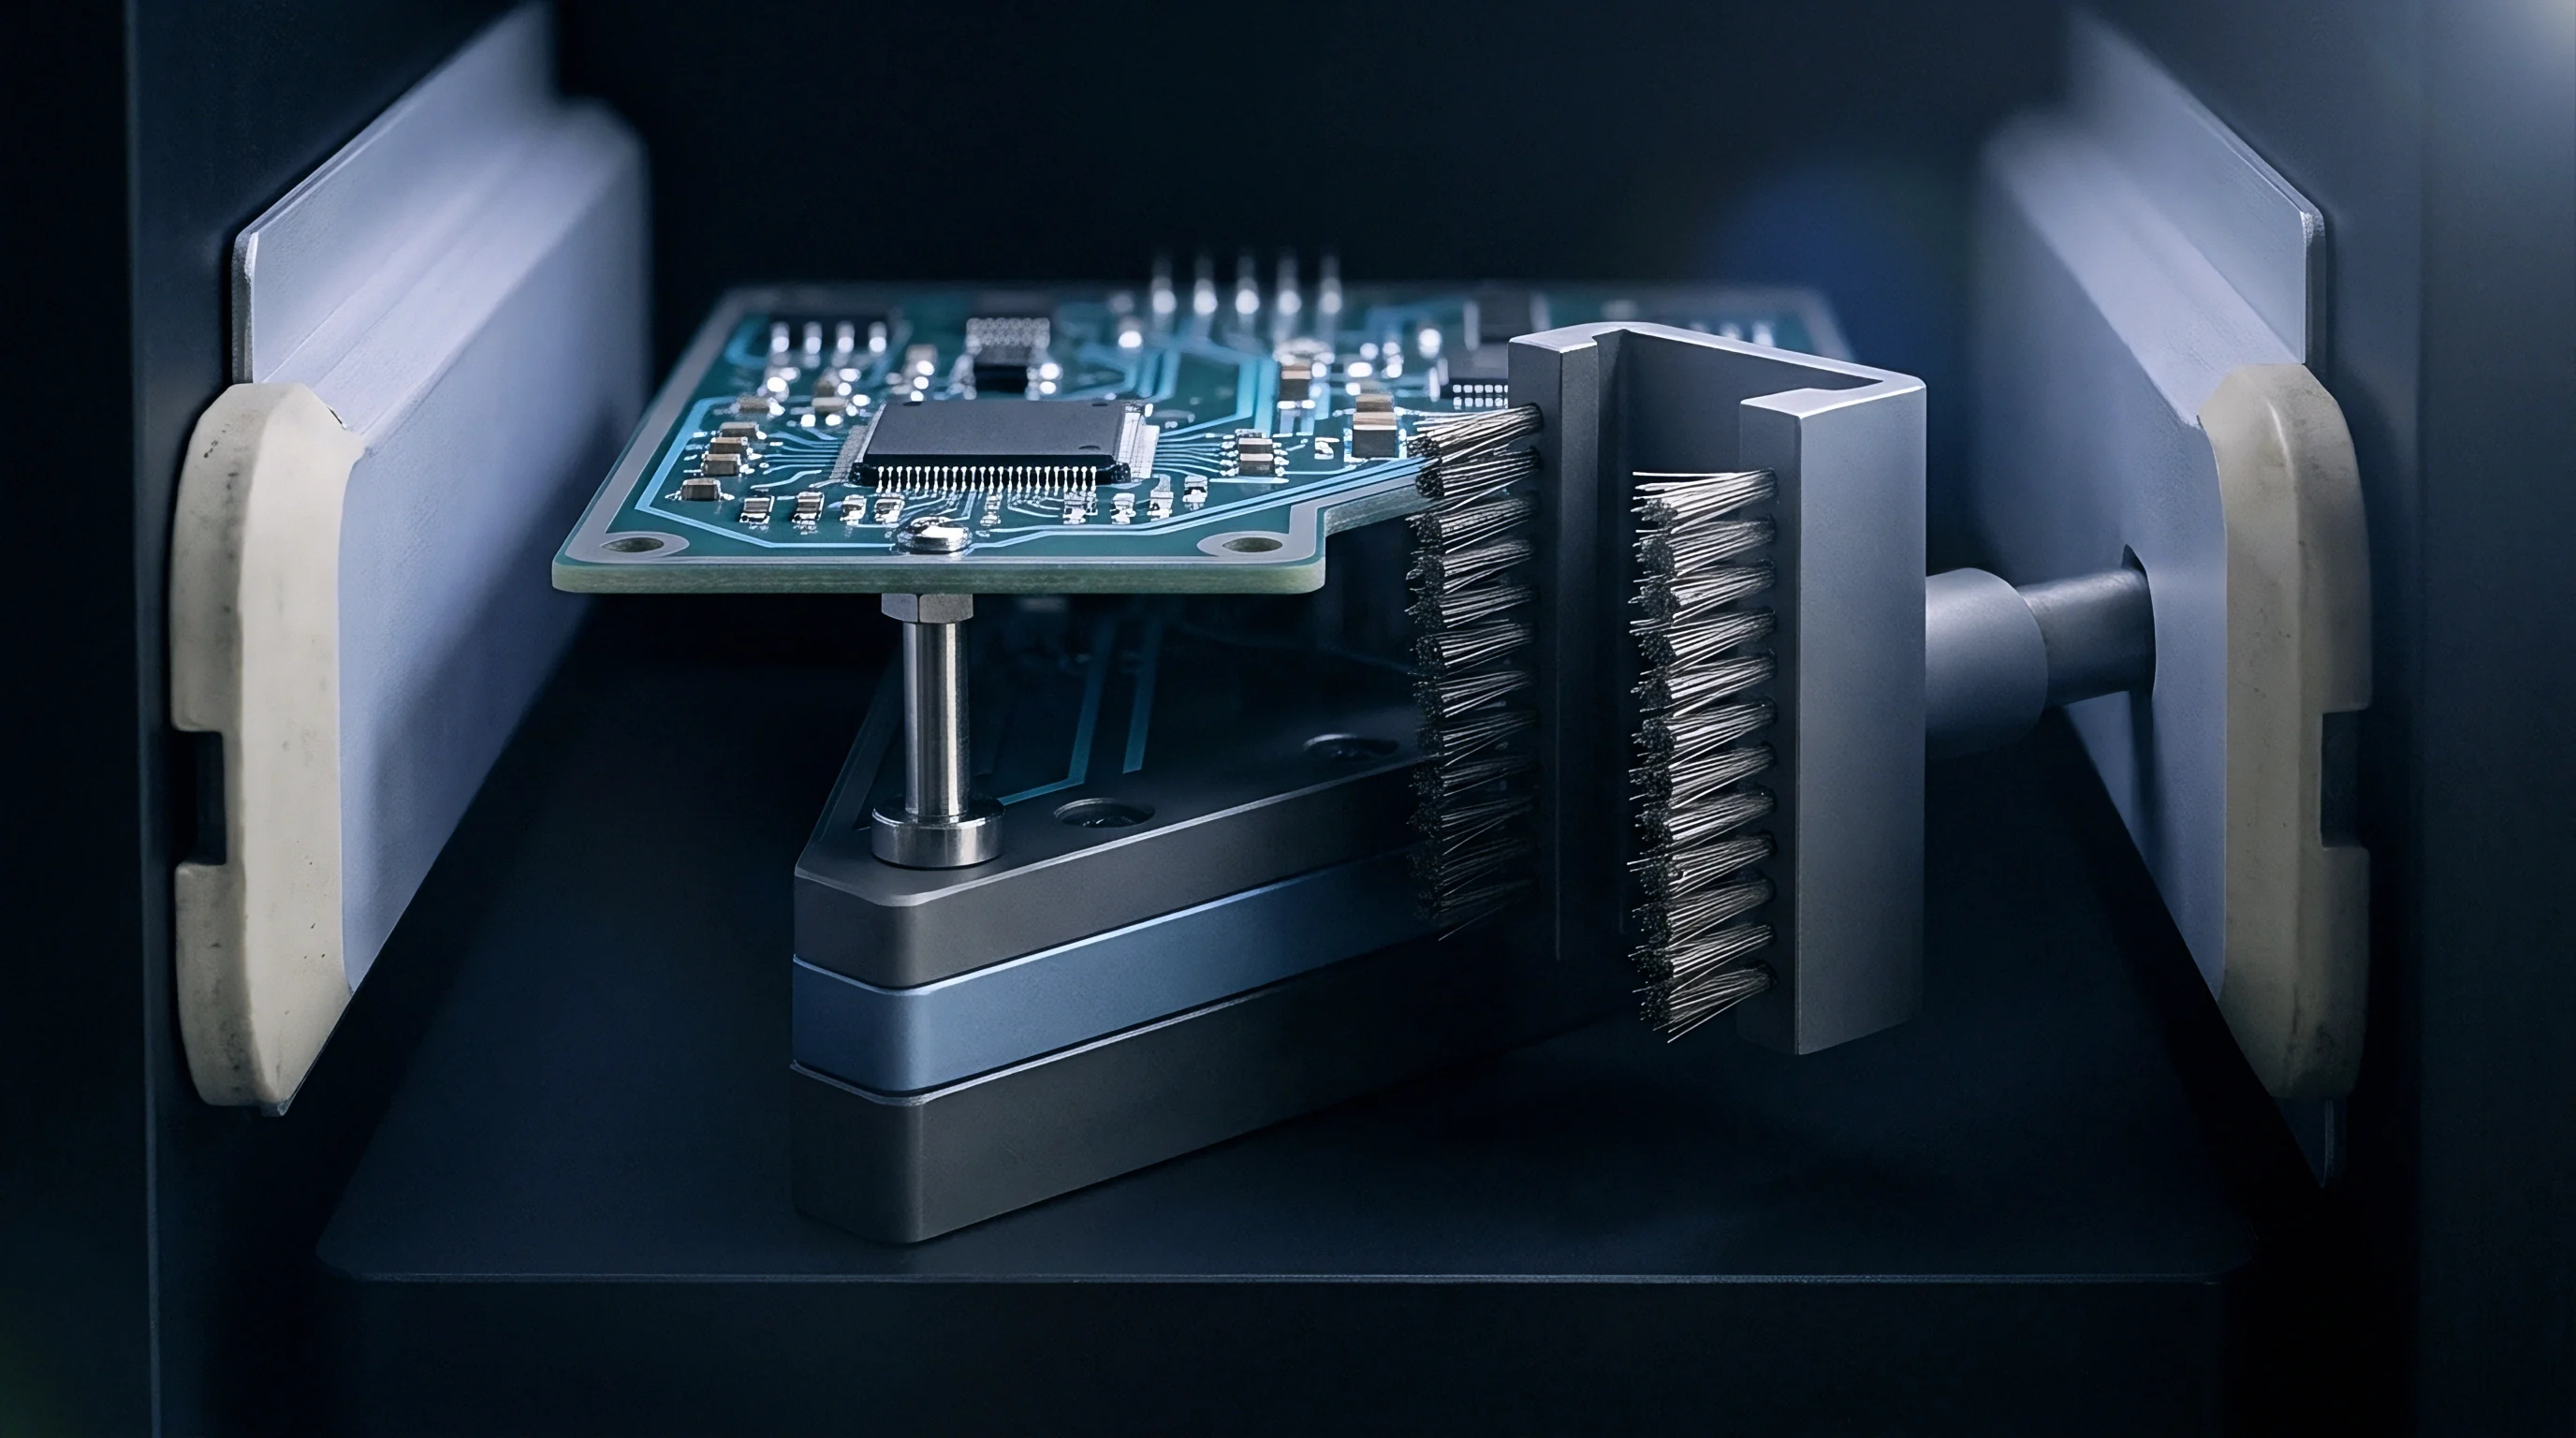
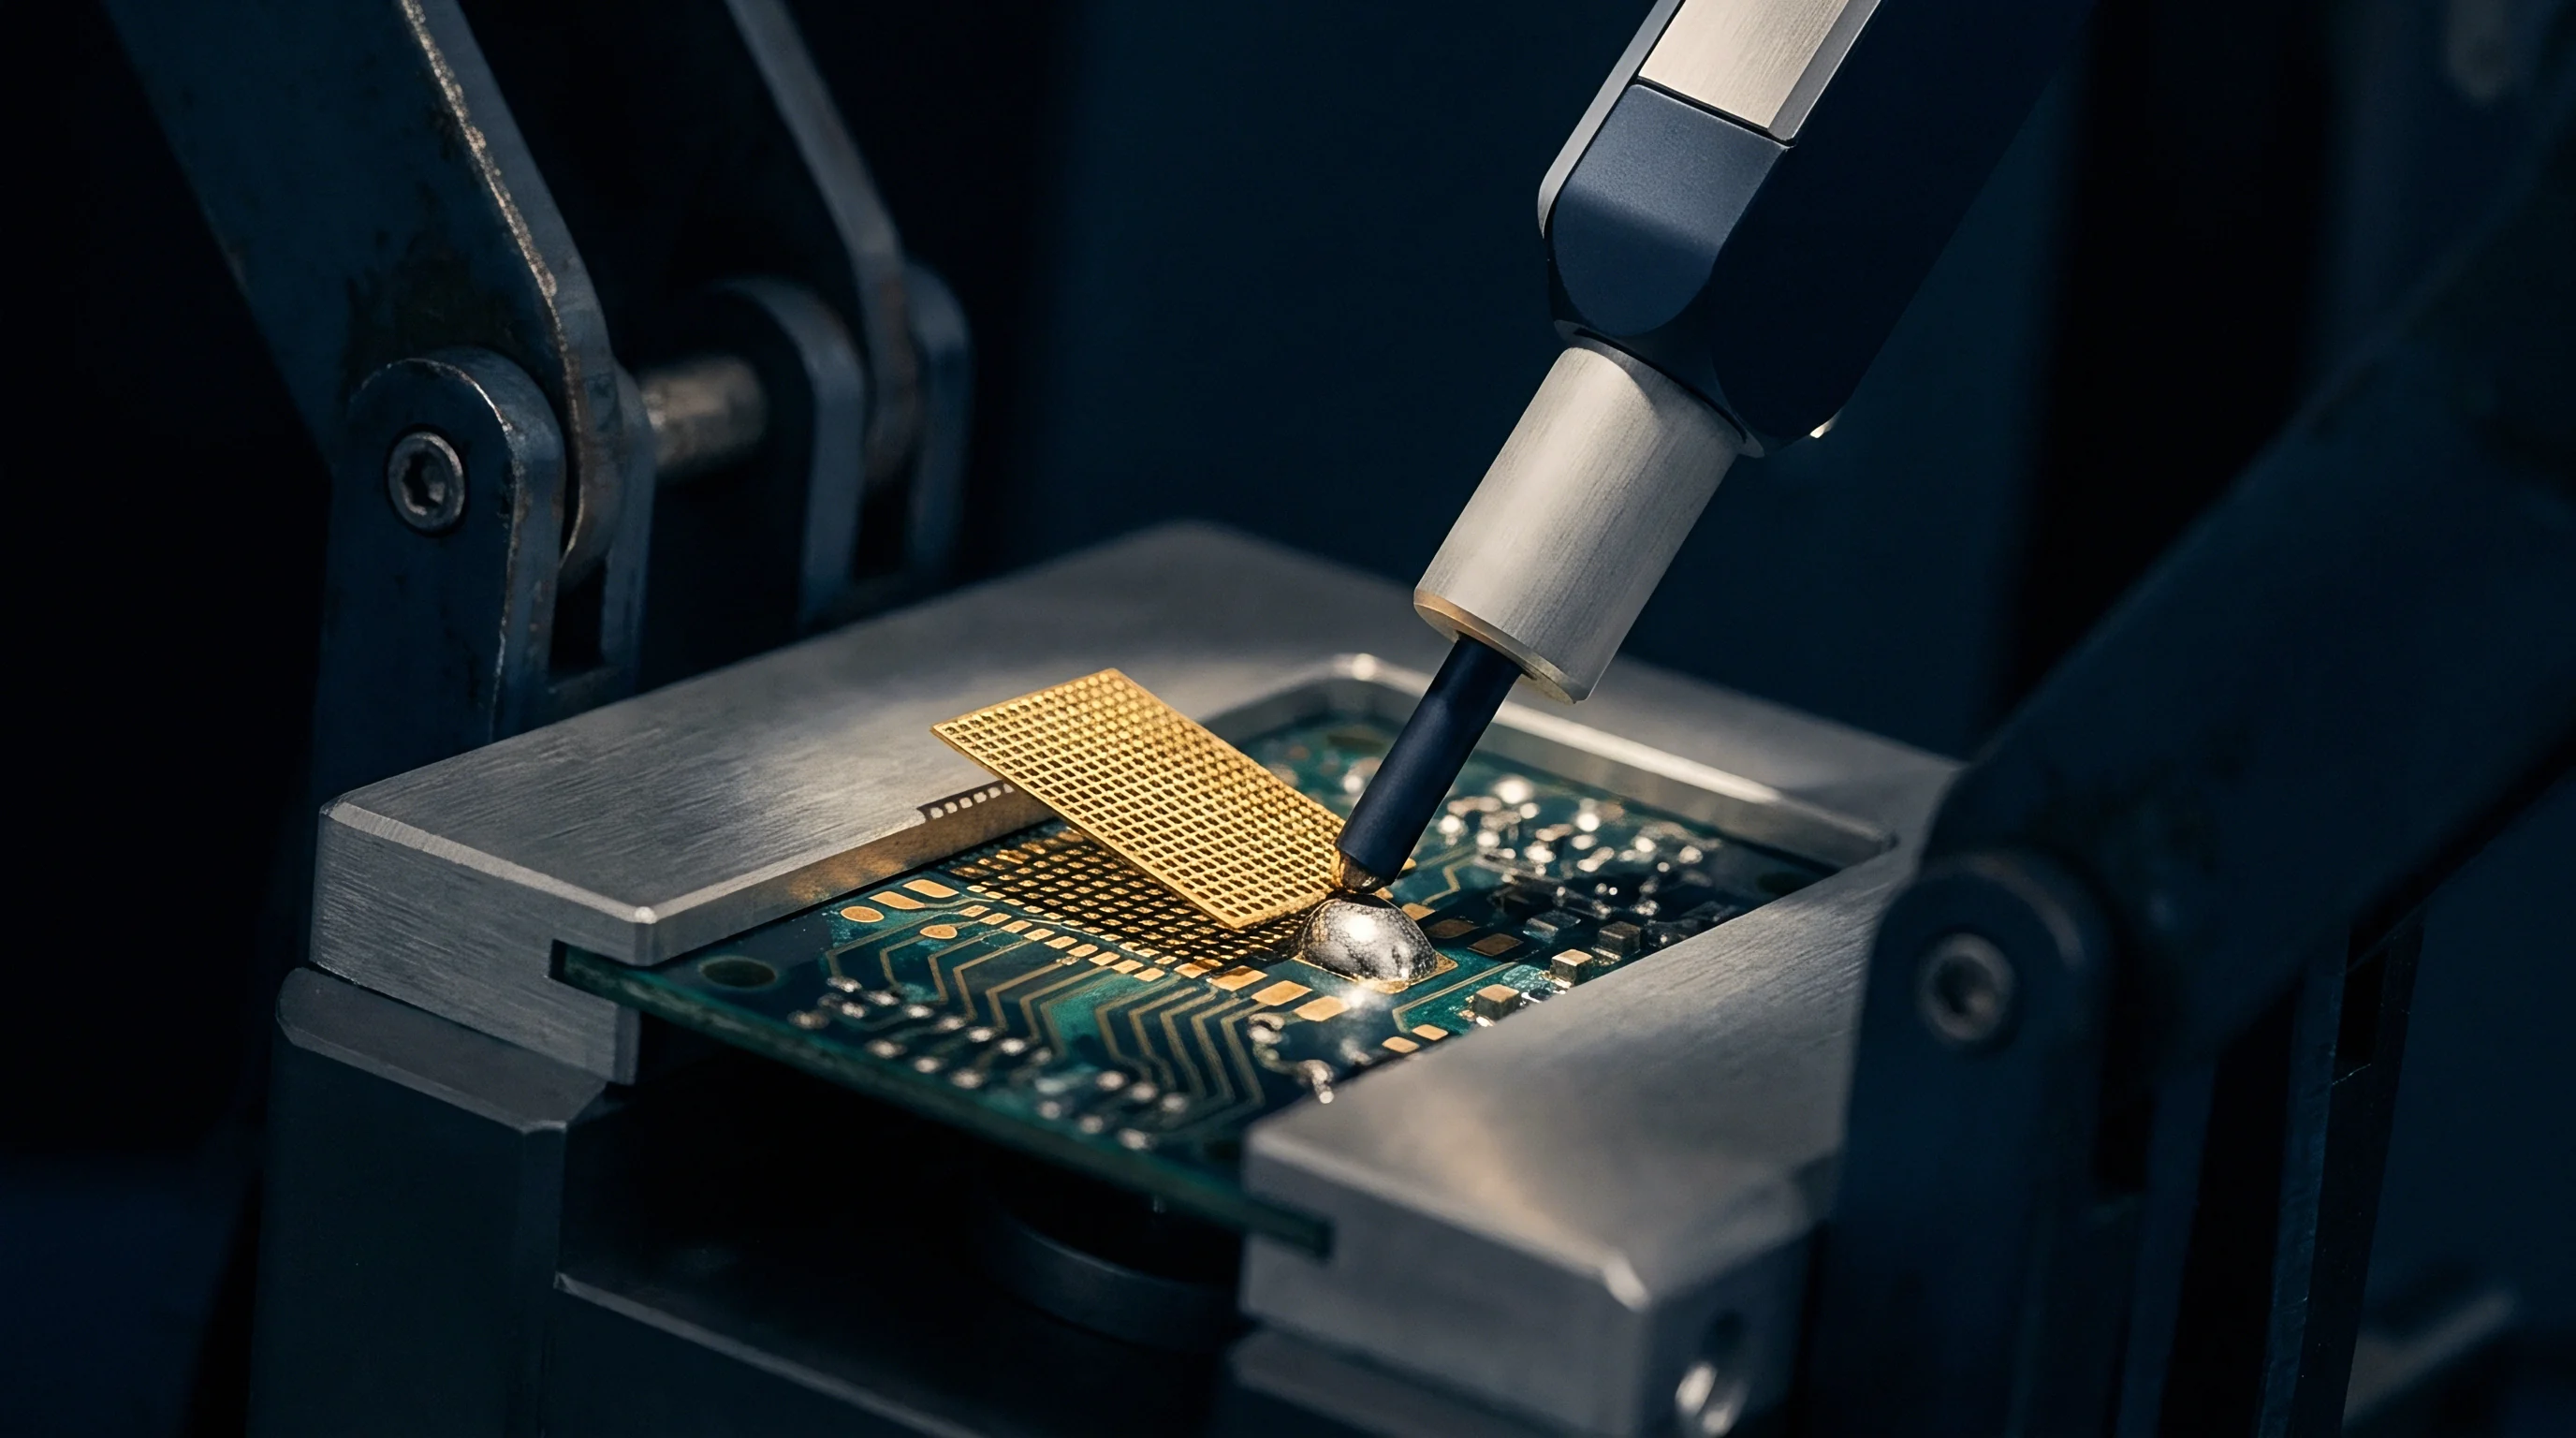
When a bed-of-nails test fixture depresses spring probes with twenty-two Newtons of contact force, it can bend a 1.2-millimeter printed board beyond 780 microstrain, fracturing corner pads beneath a 0.8-millimeter pitch ball grid array before functional testing even begins. Because fixture clamping pressure keeps the broken copper interfaces pressed together, the board still passes immediate electrical checks. Solder joint ruptures caused by mechanical flexure seldom open a circuit at the factory gate; the fractured faces remain seated against the laminate until shipping vibration, chassis assembly, or thermal cycling in the field pulls them apart.
Mechanical strain testing marks the limit where board handling damages interconnect integrity. Moving to lead-free alloys like SAC305 and SAC405 made solder stiffer, shifting the main failure mode from bulk solder creep to brittle fracture along intermetallic interfaces and pad cratering in the resin. As a board flexes, differential displacement between the rigid component body and the bending laminate concentrates shear and normal forces on the outer corner joints.
Excessive tension tears copper traces, tensile shear cracks epoxy matrices, and brittle fractures propagate along intermetallic layers.
A 1.6-millimeter FR4 assembly subjected to a strain rate of 10,000 microstrain per second sustains pad cratering damage at principal strains exceeding 700 microstrain.
Standard electrical continuity testing misses these microcracks during production runs. A damaged solder joint can maintain milliohm-level resistance until mechanical shock severs the remaining bridge. Strain gage measurement directly tracks board deformation across assembly, conveyance, and testing, catching mechanical overstress before assemblies reach the field.
Solder Joint Interconnect Separation Mechanisms
Mechanical loads drive structural failure through three distinct microstructural boundaries in the assembly. Each interface carries its own fracture toughness and strain-rate sensitivity, which dictates whether damage appears as laminate failure, intermetallic fracture, or trace tearing.
- Laminate Pad Cratering starts in the glass-epoxy dielectric directly beneath the copper pad under high localized tensile stress, forming crescent-shaped fractures hidden under the component body.
- Intermetallic Compound Cleavage runs along the brittle copper-tin boundary between the solder ball and pad metallization, leaving the flat fracture surfaces typical of sudden mechanical shock.
- Bulk Solder Fatigue Cracking develops under repeated low-amplitude strain, driving plastic deformation and microstructural coarsening through the solder joint matrix.
- Subsurface Copper Trace Rupture occurs when local bending shears the narrow neck connecting surface pads to via breakout traces, cutting continuity during cyclic thermo-mechanical movement.
Allowing unmonitored handling forces on the line lets latent solder defects slip into finished shipments, driving up warranty costs through intermittent field failures that pass in-circuit test fixtures unnoticed.

Rosette
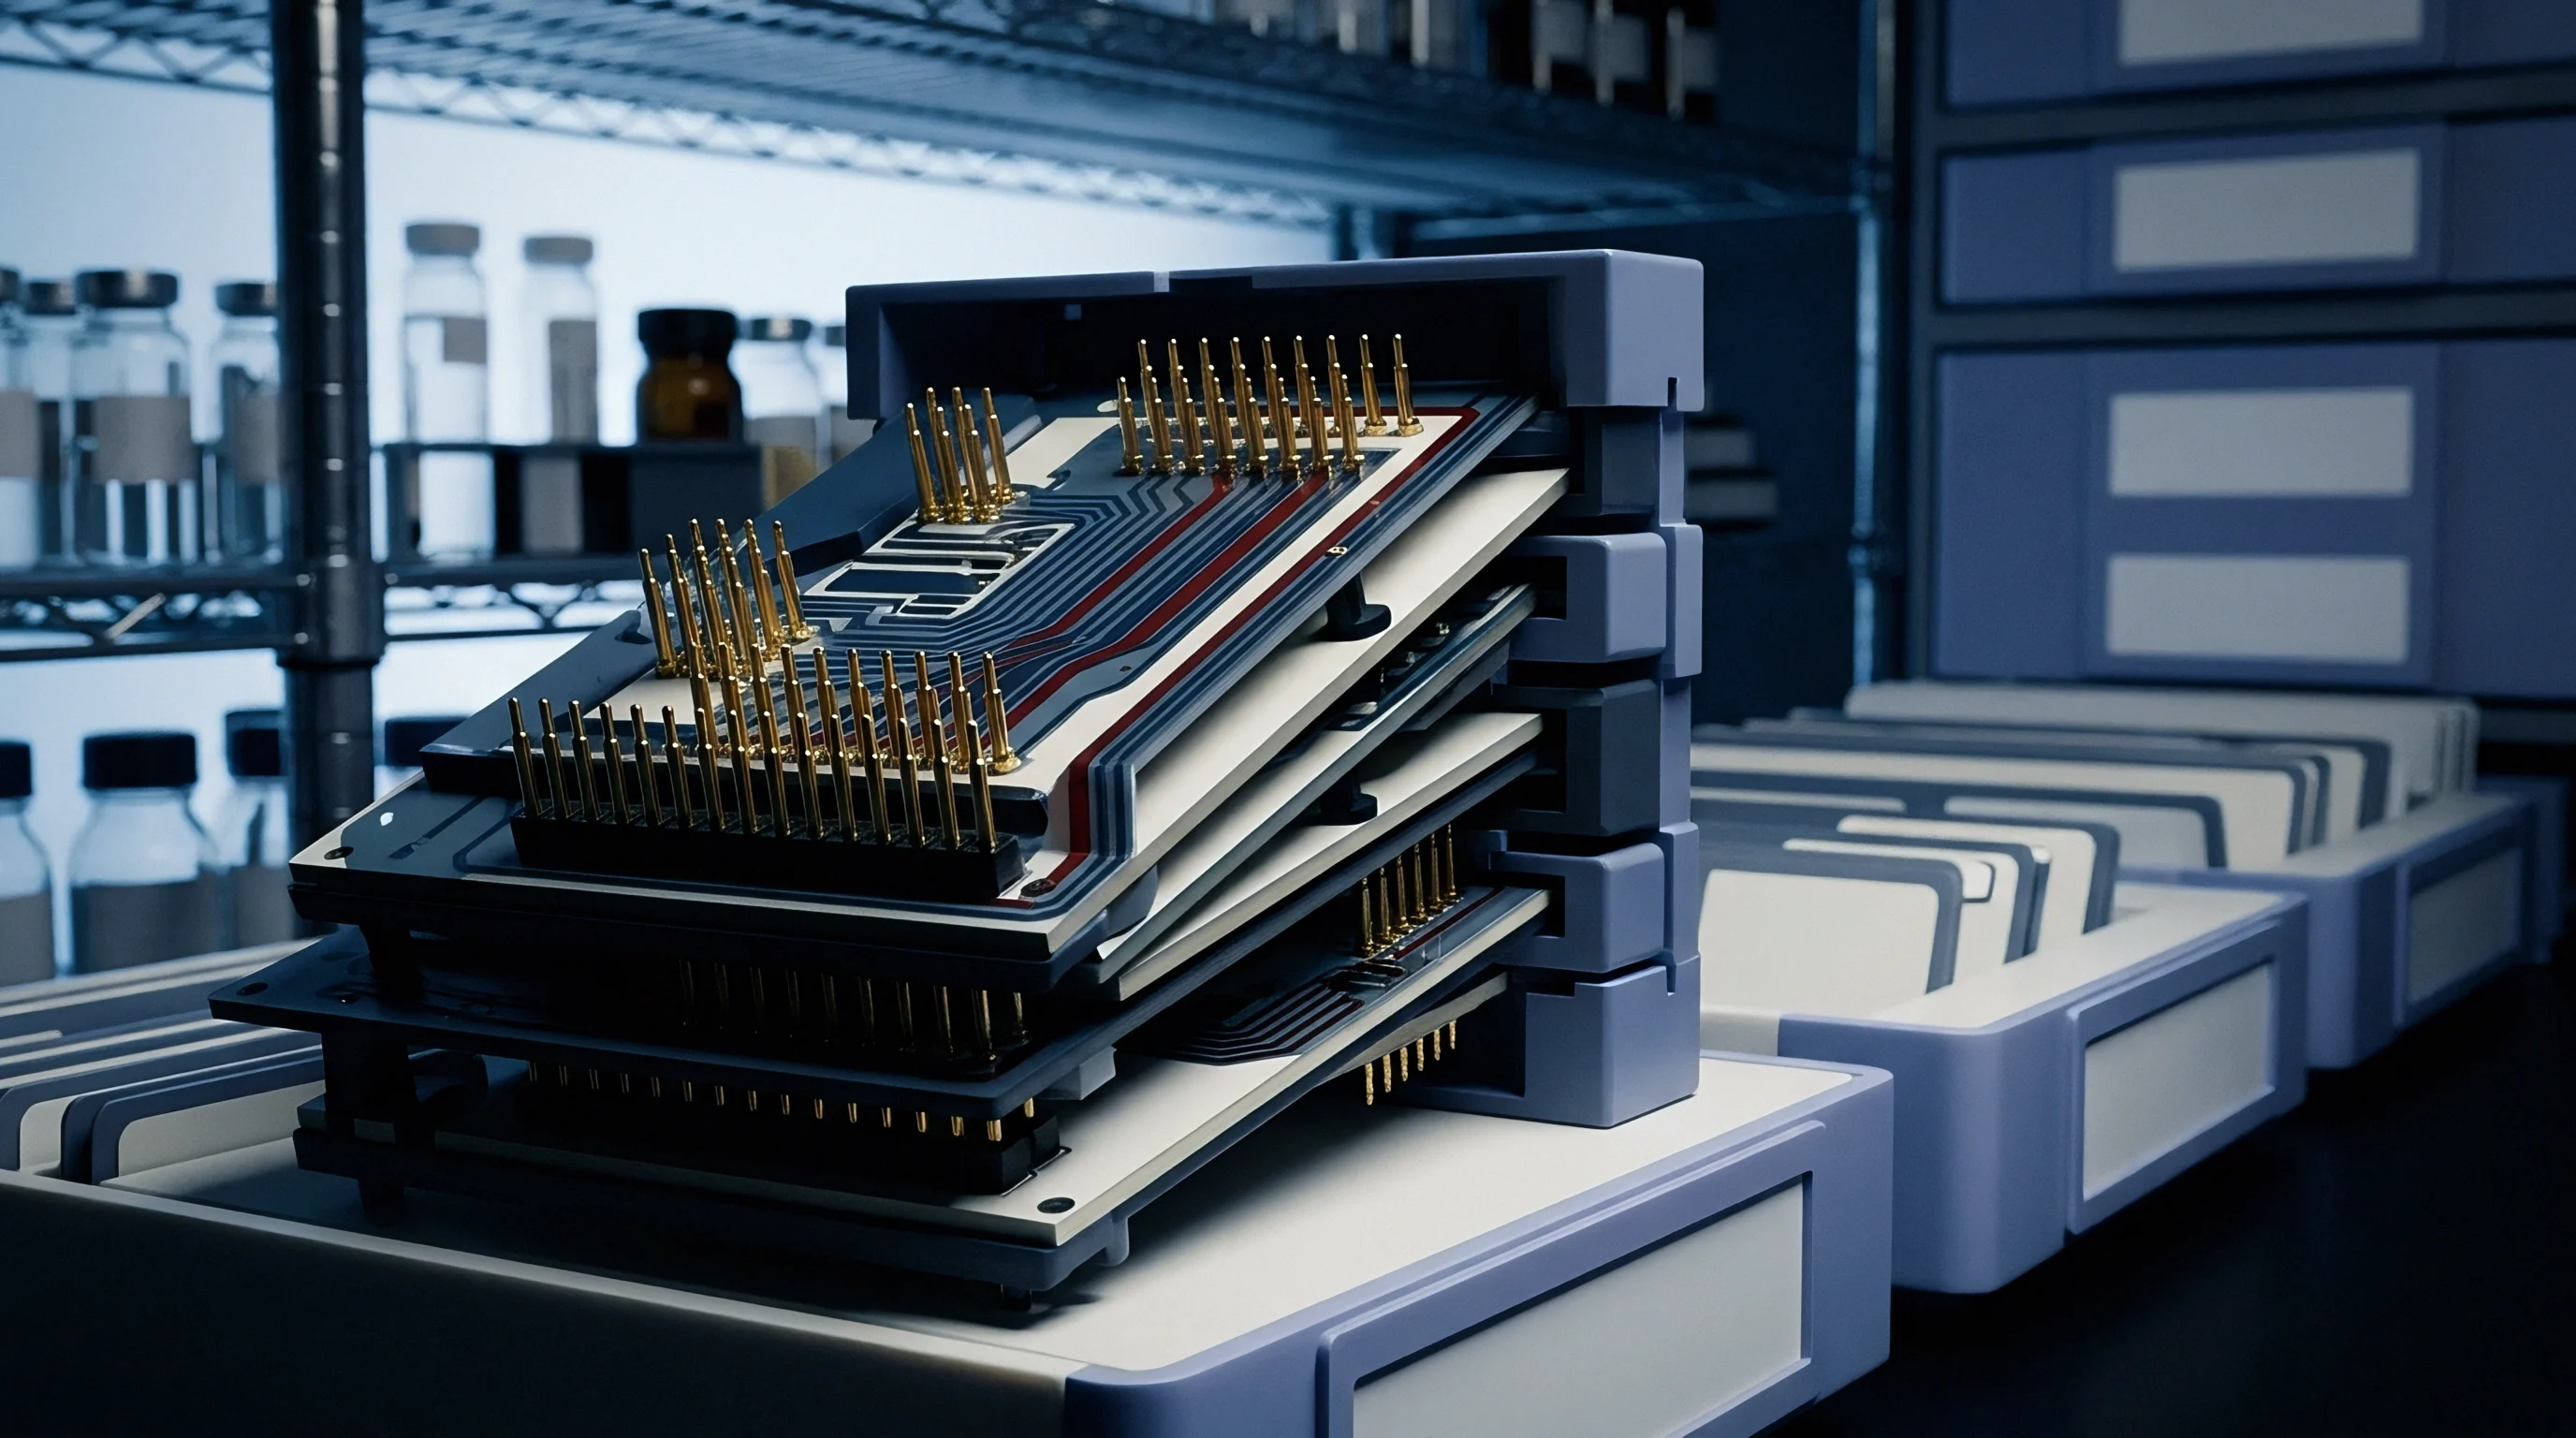
Surface strain measurements quantify local flexure next to sensitive component packages. Single-axis gages measure deformation in only one dimension, underestimating peak stress whenever the bending axis strays from the gage centerline. Triaxial strain rosettes resolve the entire planar strain state, capturing normal strains along three angles to calculate maximum and minimum principal strains alongside the principal orientation angle.
Gage placement directly determines measurement accuracy, since component corners concentrate stress during flexure. Positioning the rosette grid center between 1.0 millimeter and 2.5 millimeters from the corner of a ball grid array package captures the local flexural gradient. Moving the gage beyond 3.0 millimeters misses pad-lifting strains, as the rigid package body suppresses laminate curvature beneath its footprint and pushes steep strain gradients into the narrow perimeter.
Section 5 of IPC-JEDEC-9704A classifies any tooling adjustment or push-pin replacement without documented strain verification as an immediate process deviation that suspends batch acceptance.
Instrumentation choices directly affect measured amplitudes, as signal noise distorts calculated principal values. Preamplifier bandwidth and Wheatstone bridge excitation voltages determine signal-to-noise ratios during fast transient events like router bit engagement or panel singulation.

Transducer Topography and Layout Geometry
Triaxial strain gages measure surface displacement across three discrete angles. Rectangular rosettes align grids at 0 degrees, 45 degrees, and 90 degrees to simplify principal strain calculations. Delta rosettes position grids at 0 degrees, 60 degrees, and 120 degrees, providing the same analytical resolution in a more compact equilateral layout.
| Gage Configuration | Grid Resistance | Offset Distance | Excitation Voltage | Sampling Frequency |
|---|---|---|---|---|
| Stacked Rectangular 0/45/90 | 350 Ohm | 1.0 mm to 1.5 mm | 1.5 V to 2.0 V | 10 kHz |
| Planar Rectangular 0/45/90 | 120 Ohm | 1.5 mm to 2.0 mm | 1.0 V to 1.5 V | 2 kHz |
| Planar Delta 0/60/120 | 350 Ohm | 1.0 mm to 2.0 mm | 2.0 V | 10 kHz |
| Miniature Stacked Rosette | 120 Ohm | 0.8 mm to 1.2 mm | 1.0 V | 50 kHz |
Surface preparation governs bond strength and strain transfer from the outer resin layer into the polyimide backing. Removing solder mask down to bare laminate ensures direct strain transmission, preventing mask shear from dampening peak readings during high-speed displacement.
- Abrade the target area next to package corner pads with 400-grit silicon carbide paper to clear surface contaminants and level local resin irregularities.
- Clean the prepared site using isopropyl alcohol and conditioning acid neutralizers to remove residual oils, particles, and chemical residue.
- Align the triaxial rosette grid center parallel to the component edge using transfer tape, preserving specified offset clearance from solder joints.
- Apply cyanoacrylate adhesive evenly over the gage backing, pressing firmly with a silicone pad for sixty seconds to achieve a uniform glue line.
- Solder multi-conductor lead wires to the gage terminal pads, bonding the wiring harness to the board with silicone adhesive to prevent wire pull from distorting strain readings.

Why Does High Strain Rate Lower Allowable Microstrain?
Lead-free solder alloys are comparatively stiff. At low strain rates, tin-rich matrices accommodate mechanical stress through local plastic deformation and dislocation movement. When strain rates exceed 10,000 microstrain per second, the alloy can no longer relax stress through plastic flow, transferring the load directly into brittle intermetallic layers and glass-epoxy interfaces where rapid flexure speeds up cleavage failure.
Legacy tin-lead solders historically operated under a baseline threshold of 1,000 microstrain during quasi-static handling. Current IPC/JEDEC-9704A metrics establish dynamic limits that drop toward 350 microstrain at high strain rates for 0.8-millimeter pitch components on thin boards. This boundary comes from 2012 consortium tests on 1.6-millimeter FR4 boards with SAC305 spheres; switching from standard FR4 to high glass transition temperature phenolic resins lowers the fracture threshold further by stiffening the resin around copper pads.
Transient strain spikes lasting under five milliseconds are sometimes assumed to lack sufficient energy to initiate pad cratering, yet high dynamic loads within that window can still trigger localized microfractures.

Floor
Board handling generates substantial flexural stress across surface mount assembly lines. Automated pick-and-place nozzles exert modest z-axis placement forces, but downstream operations subject panels to sharp twisting, bending, and transient shocks. Measuring mechanical strain across these steps catches poorly supported fixtures and harsh pneumatic actuators before volume production begins.
In-circuit and functional test fixtures induce localized bending when push rods force panels down onto dense spring-probe fields. Unbalanced probe resistance flexes the board around support pins, concentrating curvature beneath central ball grid arrays. Manual steps like connector insertion, daughtercard mating, and chassis mounting add operator-dependent stress variations.
Uncalibrated drivers inflict uncontrolled peak deflections, manual handling introduces unpredictable torsional loads, and rigid stiffeners distort panel bending profiles.
Thinner printed boards flex under lighter loads while developing steeper local curvature adjacent to rigid components.
Tooling pins wear down over long production runs. SMT conveyors flex panels during edge-clamp engagement and pallet transfers. Depaneling operations ~ whether using punch dies, rotary blades, or spindle routers ~ concentrate flexural energy along edge tabs right beside sensitive components.
Manufacturing Operations Subject to Transient Deflection
Mechanical forces enter the printed board during both automated processing and manual assembly. Line audits show that manual handling and mechanical assembly steps produce the highest peak strains measured across the entire manufacturing sequence.
| Process Operation | Typical Microstrain | Strain Rate (ue/s) | Dominant Failure Mode | Risk Classification |
|---|---|---|---|---|
| Pick and Place Nozzle Impact | 120 to 280 | 500 to 2,500 | Ceramic Die Cracking | Low |
| Reflow Pallet Clamp Release | 200 to 450 | 1,000 to 4,000 | Solder Ball Separation | Moderate |
| ICT Fixture Probe Actuation | 450 to 1,200 | 5,000 to 35,000 | Pad Cratering | Severe |
| Depaneling Router Bit Cut | 300 to 850 | 8,000 to 50,000 | Intermetallic Cleavage | High |
| Manual Connector Insertion | 500 to 1,400 | 2,000 to 15,000 | Trace Neck Fracture | Severe |
| Heatsink Spring Clip Latching | 350 to 900 | 10,000 to 60,000 | Corner Solder Joint Shear | High |
These values reflect factory environments with well-maintained support tooling; missing backup pins or worn router bits drive strain levels well past acceptable limits.
Will Transient Bending Induce Subsurface Solder Cracking?
Repeated mechanical flexing forms microcracks within intermetallic interfaces under package balls. When panels enter edge-clamp conveyors, uneven clamping forces can twist the board out of plane. A single deflection of 600 microstrain at a rate of 20,000 microstrain per second can create an internal pad crater without fully detaching the component.
Subsequent thermal cycles propagate this initial defect through the resin until the copper anchor gives way. Process drift worsens over successive shifts as fixture hold-down pins vibrate loose, shifting peak board curvature directly under large packaging footprints.
- Support Pin Distribution Auditing checks fixture support placement against dense package footprints, eliminating unsupported spans over seventy-five millimeters.
- Pneumatic Actuator Velocity Profiling caps actuation ramp rates on press-fit and depaneling machinery to curb high-rate strain spikes at initial tool contact.
- Poka-Yoke Assembly Guide Verification verifies alignment during manual daughtercard seating, preventing operators from prying boards against chassis edges.
- Router Spindle Vibration Logging monitors bit wear and feed anomalies, signaling tool replacement before lateral bit deflection causes severe tab chatter.
Placing support pins directly beneath large component packages suppresses local curvature and prevents mechanical damage.

Envelope
Quantifying board strain requires converting raw voltage signals into tensor components. Triaxial rosettes output raw normal strains labeled epsilon a, epsilon b, and epsilon c along the 0-degree, 45-degree, and 90-degree axes. These values undergo reduction to yield maximum principal strain (epsilon 1), minimum principal strain (epsilon 2), and maximum shear strain, establishing whether local stresses exceed allowable limits.
Principal strain calculations identify maximum tensile deformation regardless of board orientation. Tensile strain drives pad cratering and intermetallic crack propagation, whereas compressive strain poses little threat of immediate mechanical rupture. IPC/JEDEC-9704A sets out the equations for rectangular rosette reduction:
epsilon 1, 2 = (epsilon a + epsilon c) / 2 +/- (1 / sqrt(2)) sqrt((epsilon a – epsilon b)^2 + (epsilon b – epsilon c)^2)
The principal angle theta gives the orientation of maximum normal strain relative to the primary rosette axis:
theta = 0.5 atan2((2 epsilon b – epsilon a – epsilon c), (epsilon a – epsilon c))
Higher strain rates lower material fracture resistance. The strain rate is the time derivative of principal strain, calculated via digital differentiation between consecutive samples: d(epsilon)/dt = delta(epsilon) / delta(t). During fast operations like depaneling, signal filters must remove high-frequency switching noise from spindle motors and solenoids without clipping sharp strain peaks.

Principal Metric Equations and Rate Dependency
Triaxial rosette grids provide three normal strain values ~ epsilon a, epsilon b, and epsilon c. Calculating diagonal strain gives clearer insight into component corner stress by resolving tensile forces perpendicular to the package diagonal, which is the main axis of solder joint peel during out-of-plane flexure. This calculation combines normal and shear strain components across the package coordinate system.
Mechanical strain testing on circuit boards closely mirrors structural health monitoring in aerospace wing spars, where multi-axis rosette networks track composite skin delamination under turbulence. The same mathematical formulas describe inter-ply shear in carbon-fiber structures and glass-cloth pad cratering in flame-retardant laminates.

Allowable Threshold Boundary Formulation
Component manufacturers publish allowable strain curves based on four-point bend testing defined in IPC/JEDEC-9702. These curves plot allowable microstrain against strain rate in an inverse relationship: as the strain rate rises from 10 to 100,000 microstrain per second, the allowable strain drops sharply along a logarithmic decay curve.
| Board Thickness | Rate: 100 ue/s | Rate: 1,000 ue/s | Rate: 10,000 ue/s | Rate: 100,000 ue/s |
|---|---|---|---|---|
| 0.8 mm Laminate | 820 ue | 630 ue | 460 ue | 310 ue |
| 1.0 mm Laminate | 950 ue | 740 ue | 540 ue | 380 ue |
| 1.6 mm Laminate | 1,350 ue | 1,050 ue | 790 ue | 570 ue |
| 2.4 mm Laminate | 1,800 ue | 1,420 ue | 1,090 ue | 810 ue |
| Thresholds reflect IPC/JEDEC-9704A Annex guidelines for 0.8 mm to 1.0 mm pitch ball grid array packages using SAC305 alloy on FR4 laminates. | ||||
The standard allowable strain equation applies empirical constants matching package dimensions and board construction:
epsilon_limit = sqrt(2.0 / t) (a + b ln(d(epsilon)/dt))
In this equation, t represents board thickness in millimeters, while constants a and b are drawn from experimental four-point bend tests. For a package measuring thirty-five millimeters on a side with 0.8-millimeter ball pitch, typical coefficients evaluate to a = 1900 and b = -110.
Consider a 1.2-millimeter thick circuit board carrying a 35-millimeter ball grid array package with SAC305 solder spheres. During in-circuit testing, a rosette positioned 1.5 millimeters from the corner reads raw strains of epsilon a = 420 microstrain, epsilon b = 610 microstrain, and epsilon c = 180 microstrain at time t1 = 12.450 milliseconds. At t2 = 12.452 milliseconds, the readings shift to epsilon a = 490 microstrain, epsilon b = 710 microstrain, and epsilon c = 210 microstrain.
First, compute maximum principal strain at t1:
epsilon_avg = (420 + 180) / 2 = 300 microstrain
epsilon_diff = (1 / sqrt(2)) sqrt((420 – 610)^2 + (610 – 180)^2) = 0.7071 sqrt((-190)^2 + (430)^2) = 0.7071 sqrt(36100 + 184900) = 0.7071 470.1 = 332.4 microstrain
epsilon 1 (t1) = 300 + 332.4 = 632.4 microstrain
Next, compute maximum principal strain at t2:
epsilon_avg = (490 + 210) / 2 = 350 microstrain
epsilon_diff = 0.7071 sqrt((490 – 710)^2 + (710 – 210)^2) = 0.7071 sqrt((-220)^2 + (500)^2) = 0.7071 sqrt(48400 + 250000) = 0.7071 546.26 = 386.26 microstrain
epsilon 1 (t2) = 350 + 386.26 = 736.3 microstrain
The time delta equals 0.002 seconds. The calculated strain rate is:
d(epsilon)/dt = (736.3 – 632.4) / 0.002 = 103.9 / 0.002 = 51,950 microstrain per second
Evaluate the allowable limit for this 1.2-millimeter board under the calculated rate of 51,950 microstrain per second:
ln(51950) = 10.858
epsilon_limit = sqrt(2.0 / 1.2) (1900 + (-110 10.858)) = 1.291 (1900 – 1194.4) = 1.291 705.6 = 910.9 microstrain
The measured peak strain of 736.3 microstrain sits safely below the 910.9 microstrain limit. However, if board thickness were reduced to 0.8 millimeters under the same deflection forces, the allowable limit would contract to 705.6 microstrain, turning this same operation into a process deviation.
Safe strain thresholds remain less clear for ultra-thin core laminates under 0.6 millimeters made with modified polyimide or polyphenylene ether resins. Laboratory data and published studies place the threshold anywhere from 250 to 450 microstrain at high strain rates, leading conservative procurement specs to cap limits at 300 microstrain regardless of calculated margins.
Whether transient strain limits based on monotonic bend tests accurately predict cumulative fatigue from hundreds of low-amplitude conveyor transfers remains an open question across the assembly industry.

Dispatch
Procurement contracts rely on strain verification data as proof of manufacturing compliance. Moving from prototype builds to volume production exposes assemblies to unmonitored tooling modifications, operator turn-over, and fixture wear. Attaching a formal strain report to lot records provides technical and legal proof that tooling remained within validated limits.
Latent solder fractures frequently pass automated optical inspection because the crack planes remain concealed under the package edge. Without logged strain records, an importer cannot prove whether field returns stemmed from factory overstress or customer handling. A documented strain dossier eliminates that ambiguity by recording peak principal strains and strain rates at every processing step.
Solder joints damaged by transient mechanical strain routinely pass automated optical inspection because crack planes remain hidden beneath package peripheries.
Engineering change notices frequently invalidate earlier strain qualifications. Replacing a support plate, changing a router bit profile, switching laminate suppliers, or adjusting fixture pins alters board flexure. Any physical change to the setup requires fresh sensor instrumentation and re-qualification.
Technical Documentation and Lot Release Dossiers
A complete strain qualification package maintains traceability between factory tooling and finished shipments. Market surveillance audits and automotive warranty investigations rely heavily on these records when evaluating widespread solder joint failure claims.
A compliant test report must include specific empirical deliverables: calibrated rosette sensor coordinates mapped to CAD layouts, raw time-series logs sampled at 500 Hertz minimum for manual steps and 10 kilohertz for transient cuts, principal strain versus strain rate scatter plots overlaid on IPC/JEDEC-9704A limit curves, and serial numbers for all audited equipment.
Contractual Allocation of Process Drift Risk
Assembly tooling degrades over long production runs. Pneumatic cylinders lose pressure regulation, mechanical stops wear, and guide rails develop play, all of which increase out-of-plane board flexure during normal processing.
Basing supply contracts on verified strain limits protects buyers against unmonitored line drift. Explicit purchase order clauses assign financial liability for latent solder defects to the contract manufacturer if strain qualification certificates are missing. Standard terms specify that unverified tooling changes void lot acceptance and make the manufacturer responsible for return costs.
Section 7.2 of the standard manufacturing quality agreement specifies that any shipment lacking a verified strain test report matching current tooling revisions constitutes non-conforming inventory subject to immediate lot rejection at the supplier’s expense.