Vector Network Analyzer Fixture De Embedding for High Frequency Coupling Capacitors
IEEE 370 two-port matrix de-embedding removes fixture launches and pad parasitics to extract true high-frequency capacitor S-parameters up to 50 GHz.

Launch
Vector network analyzer measurements of sub-millimeter surface-mount capacitors operating past 20 GHz present an immediate physical problem. The physical interface connecting coaxial VNA cables to a microscopic 0201 or 01005 ceramic capacitor introduces electromagnetic parasitics that obscure the intrinsic device scattering parameters. Signal propagation through test fixtures, microstrip lines, coplanar waveguides, coaxial-to-printed circuit board transitions, and probe pads creates magnitude attenuation, phase delay, and reactive discontinuities.
Uncalibrated raw measurements report the combined response of the test setup rather than the isolated coupling capacitor.
Physical Discontinuities at Radio Frequencies
Coaxial transitions introduce parasitic reactance. When a signal transitions from a 50-ohm coaxial connector or ground-signal-ground wafer probe tip onto a PCB transmission line, the spatial geometry changes dramatically. Electric and magnetic field distributions undergo rapid spatial rearrangement, inducing localized fringe capacitance and series lead inductance.
At low megahertz frequencies, these parasitic elements contribute negligible phase shifts. At 40 GHz, a 100-femtosecond electrical delay shifts the measurement phase angle by 1.44 degrees, distorting the calculated capacitance value.
Errors compound at high frequencies. Microstrip test traces leading from the calibration reference plane to the component pad contribute insertion loss and dispersion. PCB substrate materials like glass-reinforced epoxy display frequency-dependent relative permittivity and loss tangent variations.
High-frequency signals experience skin-effect resistance along copper trace edges, accompanied by surface roughness attenuation modeled by Huray surface factor formulations. Without stripping these fixture characteristics from the raw VNA data, a 10-picofarad coupling capacitor appears to exhibit premature self-resonance and artificially inflated equivalent series resistance.
Coaxial to microstrip transitions generate reactive discontinuities that rotate measured scattering parameter phase angles away from the true device plane.
Parasitic Loading of Component Pads
Component mounting footprints alter local trace impedance. SMT pads designed for 0201 components create a localized widening of the signal conductor, generating excess shunt capacitance to the underlying reference ground plane. Ground return vias placed adjacent to signal pads contribute mutual inductive coupling that varies with via spacing and plating thickness.
Pad capacitance distorts small values. When characterizing a 0.1-picofarad ultra-broadband DC-blocking capacitor, the parasitic pad-to-ground capacitance can reach 0.04 picofarads per pad. The physical pad structures contribute nearly half of the total measured admittance if left uncorrected.
De-embedding algorithms must isolate the component’s internal dielectric properties from the surrounding copper geometry. Failure to separate pad parasitic capacitance from component body parameters leads circuit designers to miscalculate high-speed link attenuation, resulting in degraded receiver eye diagrams and unexplained bit error rate spikes in deployed optical transceivers.
Cascade
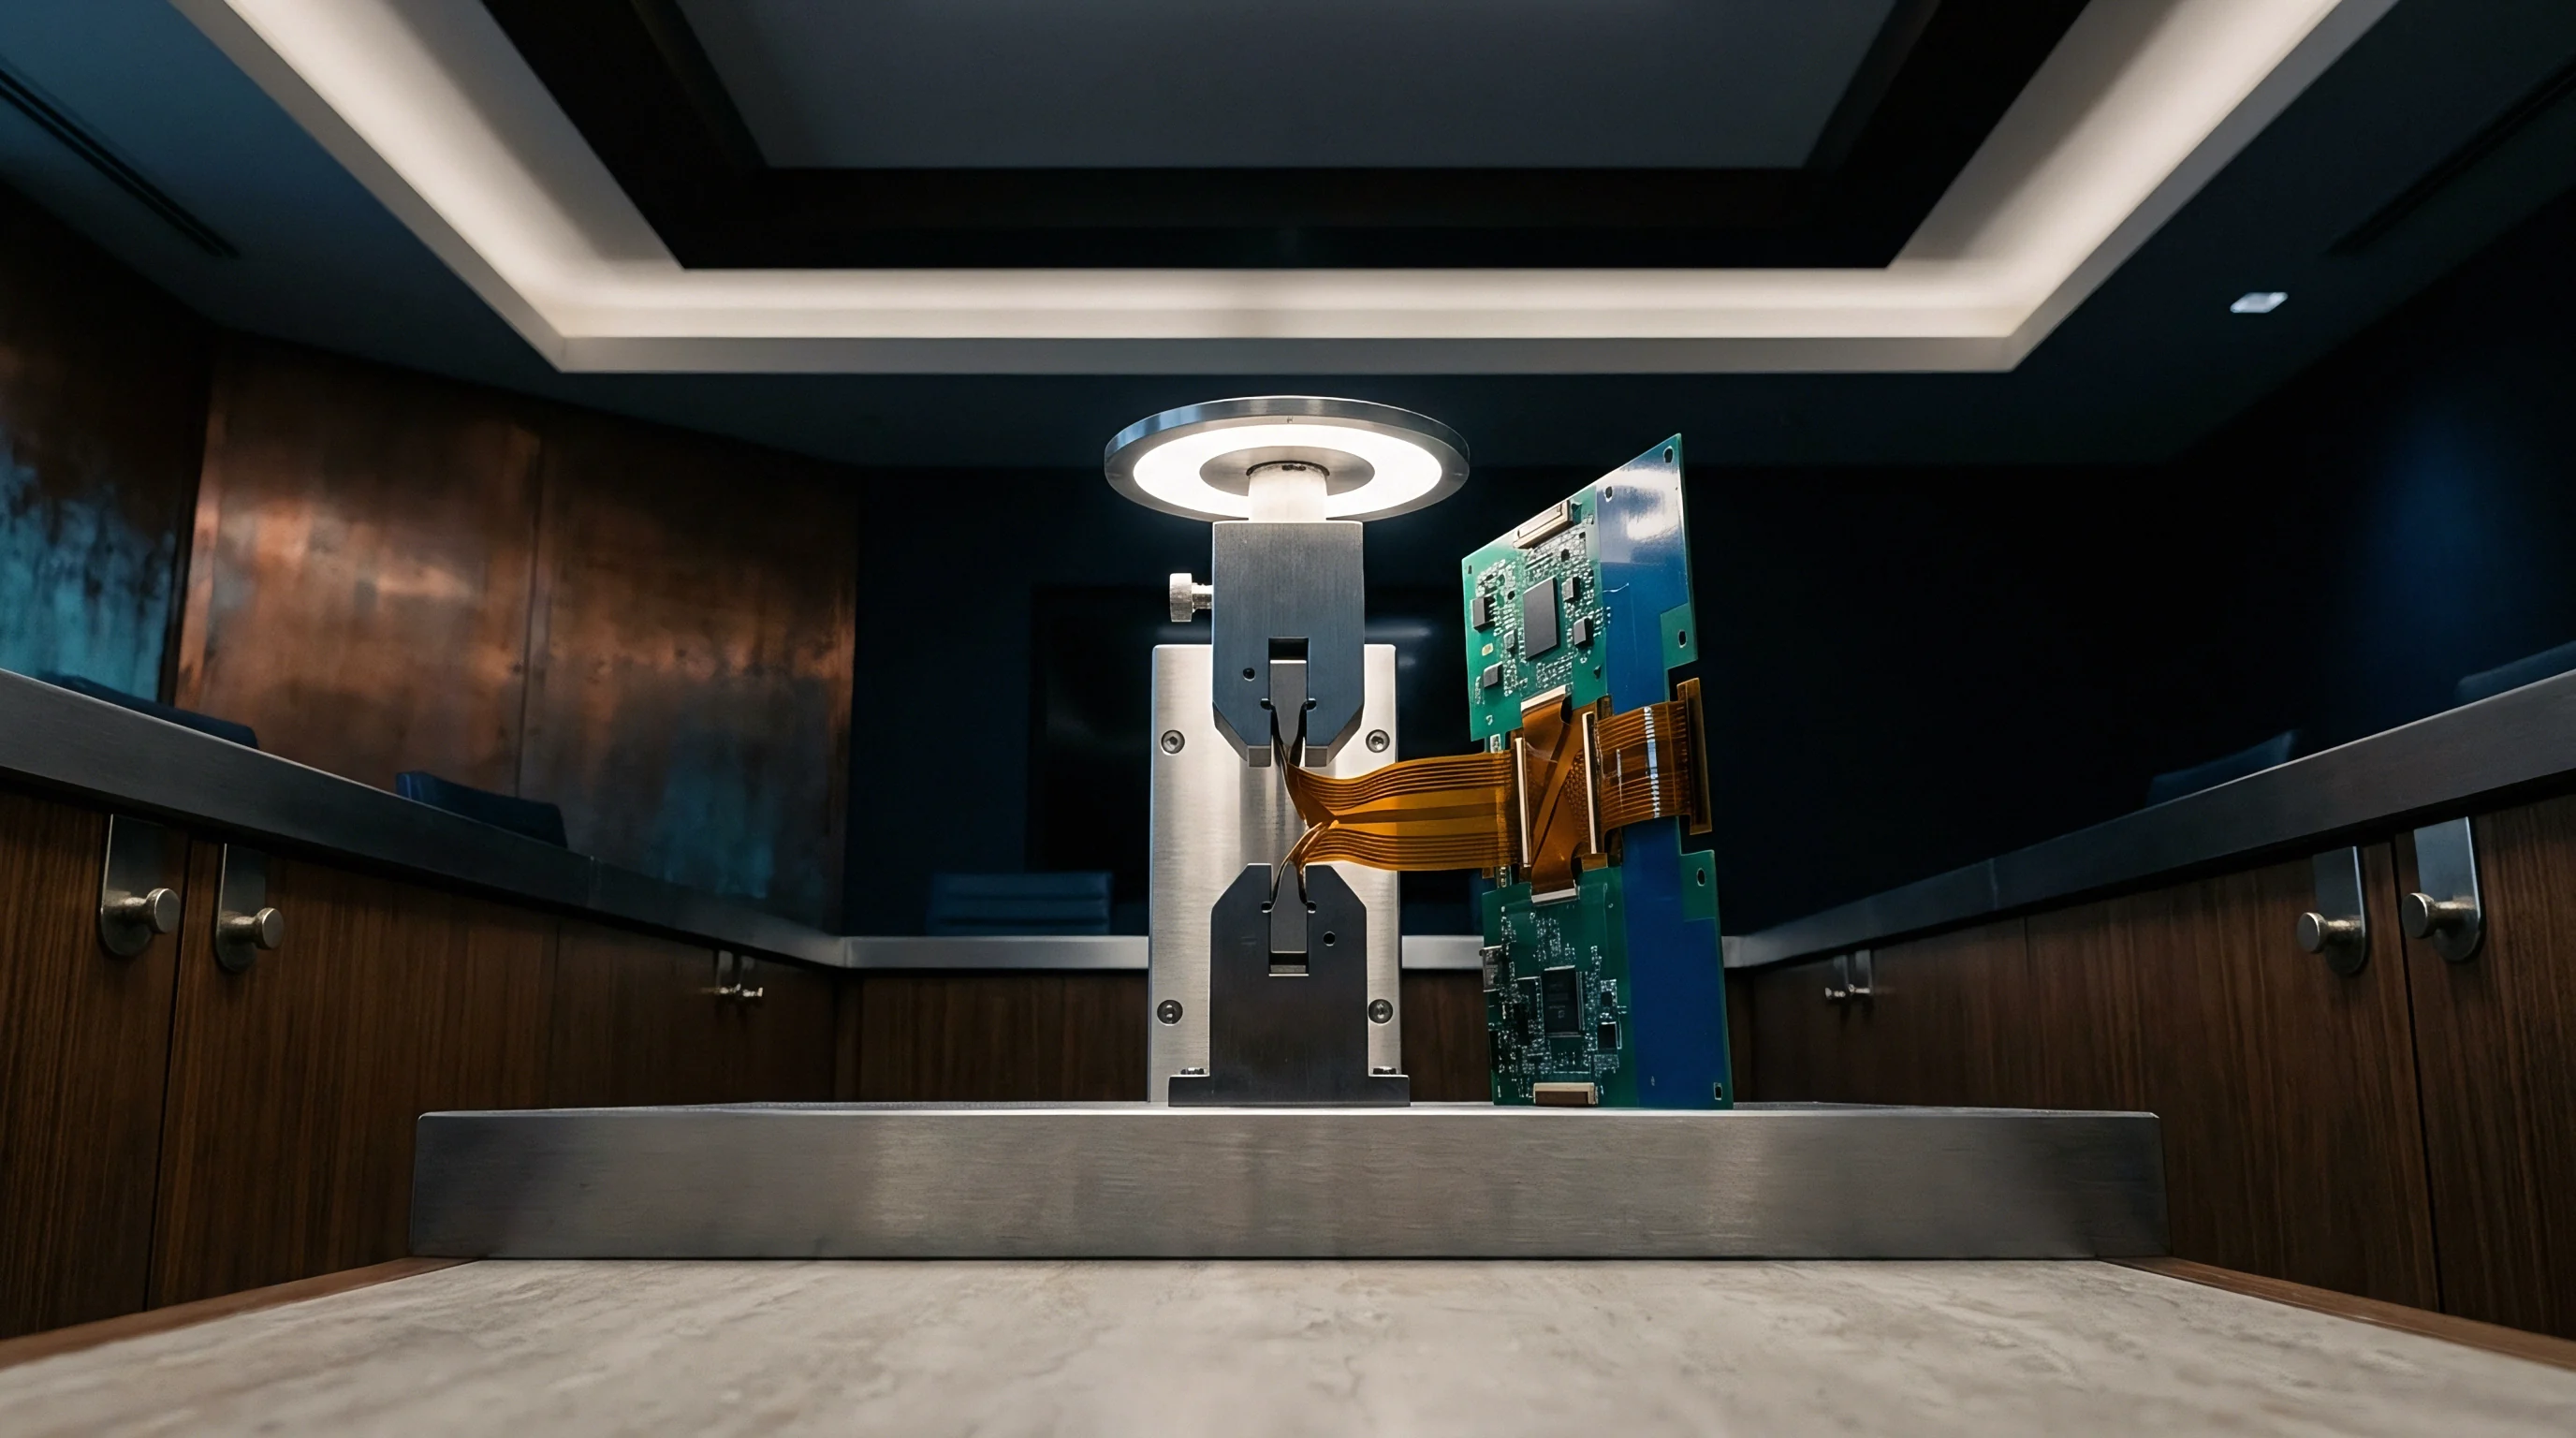
Removing test fixture structures from vector network analyzer data relies on two-port network matrix manipulation. Representing measured S-parameters as cascaded sub-networks allows mathematical division of the fixture matrices from the total measured system response. The total measured network equals the chain multiplication of the input launch fixture matrix, the intrinsic device under test matrix, and the output launch fixture matrix.

Mathematical Principles of Fixture Matrix Removal
Scattering parameters do not combine directly through linear matrix addition or multiplication. To perform network subtraction, raw S-parameters convert into Transmission parameters, known as T-matrices, or Voltage-Current Transfer matrices, known as ABCD matrices. Converting two-port S-parameters to T-matrices permits linear matrix cascading, where the total system T-matrix equals the product of the individual sub-network T-matrices.
Matrix inversion amplifies residual noise. Inverting the input fixture T-matrix and multiplying it by the total system T-matrix isolates the combined response of the component and output fixture. Subsequent multiplication by the inverted output fixture T-matrix yields the isolated device S-parameters.
If the fixture T-matrices contain small calibration errors or measurement noise, the inversion step scales those errors exponentially near half-wavelength resonance frequencies, creating non-physical response spikes.

IEEE 370 De-Embedding Methodology
Standardized fixture removal protocols formalize two-port and four-port vector correction. IEEE 370-2020 defines standard algorithms for characterization and de-embedding of high-speed interconnects and surface-mount components up to 50 GHz. The standard categorizes fixture removal into three primary procedural paths based on fixture asymmetry, availability of calibration standards, and access to mathematical fixture models.
- The operator fabricates a 2xThru calibration structure matching the exact transmission line layout and pad footprint of the test fixture.
- The vector network analyzer collects full two-port S-parameters of the 2xThru structure across the target frequency band.
- The IEEE 370 algorithm splits the measured 2xThru S-parameter matrix into two symmetric half-fixture models representing the lead-in and lead-out transmission paths.
- The software performs time-domain gating and impedance peeling to correct for localized launch discontinuities and manufacturing trace tolerances.
- The algorithm converts the half-fixture S-parameters into T-parameters, calculates their inverse matrices, and multiplies them against the total measured device fixture data to extract the isolated component parameters.
De-embedding isolates the true dielectric. The choice of fixture removal algorithm dictates measurement accuracy across broad frequency spans.
| Algorithm Type | Required Test Artifacts | Upper Frequency Limit | Impedance Mismatch Sensitivity | Passivity Preservation |
|---|---|---|---|---|
| IEEE 370 2xThru (Time-Domain) | Single 2xThru Trace | 50 GHz | Low | High |
| Thru-Reflect-Line (TRL) | Thru, Reflect, Line Standards | 110 GHz | Very Low | High |
| Automatic Fixture Removal (AFR) | 2xThru or 1xOpen/Short | 40 GHz | Moderate | Moderate |
| Direct Short-Open-Load-Thru (SOLT) | On-Wafer Calibration Substrate | 67 GHz | High | Low |
IEEE 370-2020 Clause 6 specifies that de-embedding software must enforce passivity and causality verification on extracted S-parameters before outputting Touchstone files.
If the error metric defined in IEEE 370-2020 Clause 6.4 exceeds the 0.05 limit during 2xThru quality validation, the contract specification allows immediate rejection of the measurement dataset.


Standard
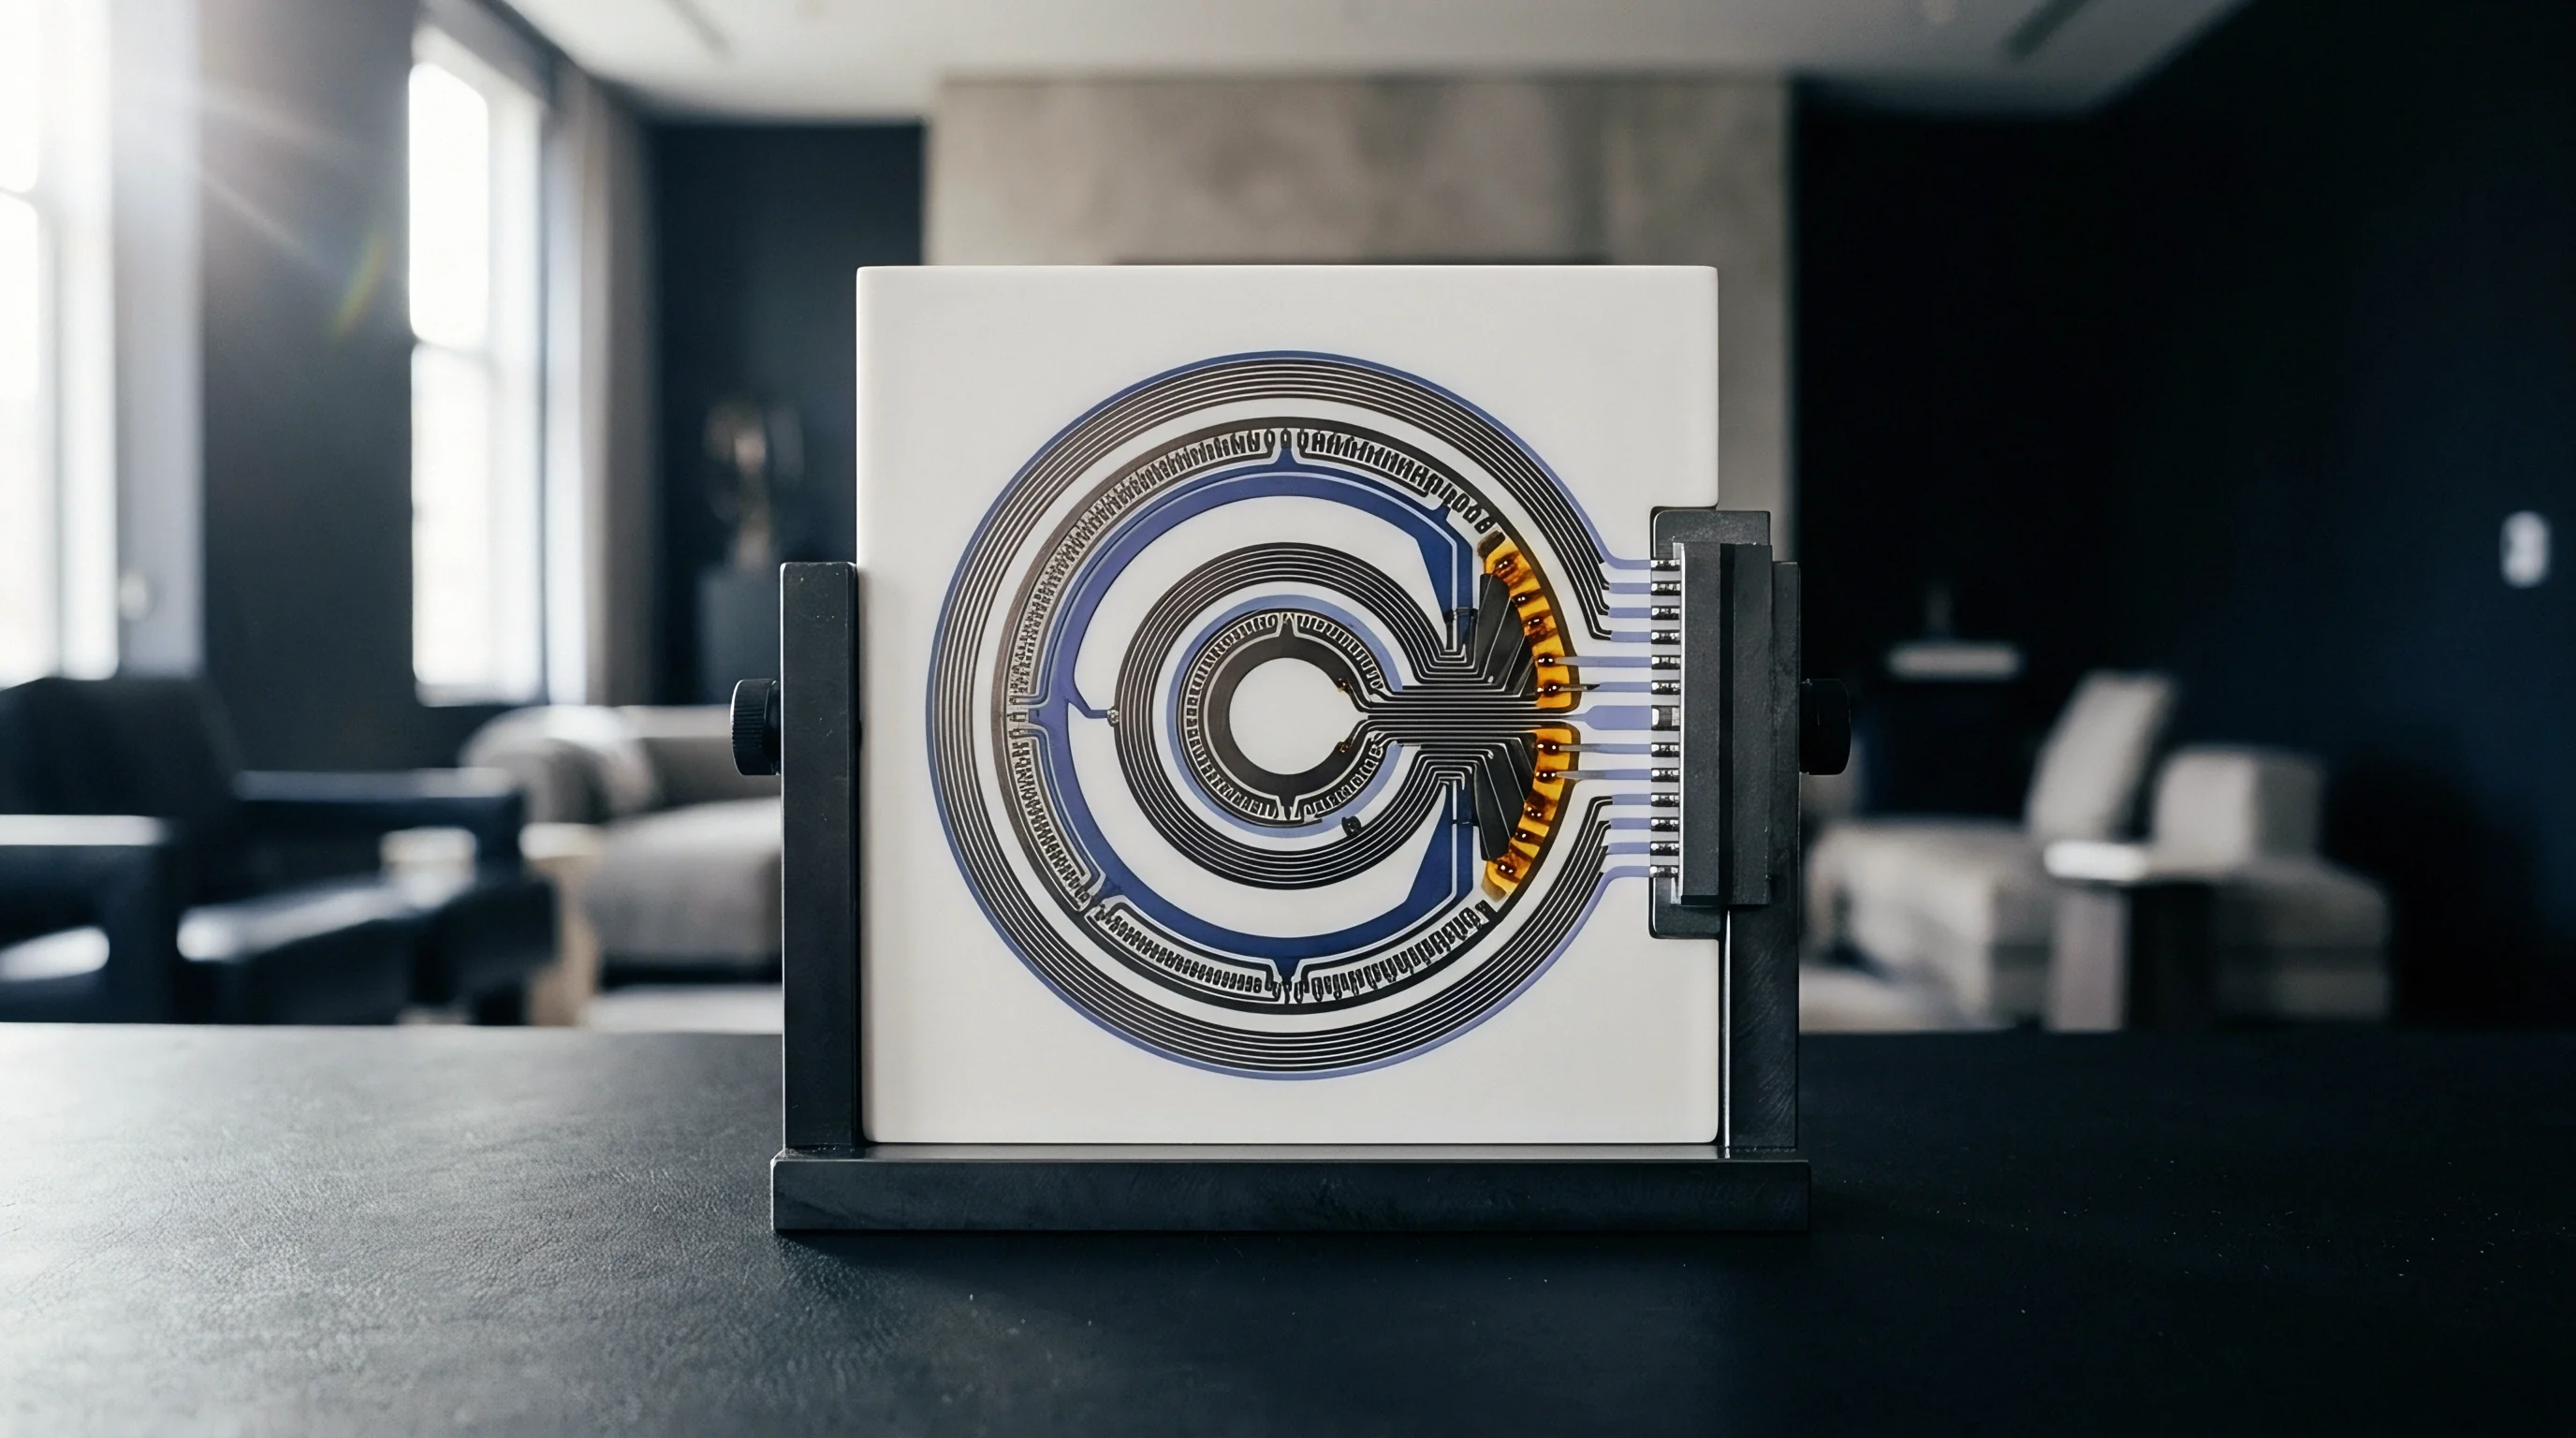
Physical calibration standards determine the accuracy boundary of vector network analyzer de-embedding. Physical test artifacts fabricated on printed circuit boards inherit manufacturing tolerances from substrate pressing, copper etching, and surface finishing processes. Variations in dielectric constant (εr), trace width, loss tangent, and copper foil profile directly degrade reference plane positioning.

Substrate Variability and Physical Artifact Fabrication
Phase rotation shifts reference planes. High-frequency laminates such as hydrocarbon ceramic laminates or modified FK PTFE display localized dielectric constant fluctuations of up to three percent across a single panel. A three percent shift in relative permittivity alters trace propagation velocity, creating an electrical length mismatch between the calibration artifact and the actual component fixture trace.
This length error manifests as a residual phase rotation in the de-embedded S21 parameter, producing false inductive or capacitive ripples in the component impedance profile.
Etch variation alters line impedance. PCB fabricators encounter trace width tolerances of plus or minus 10 micrometers on fine-pitch microstrip lines. A 10-micrometer reduction in trace width raises the characteristic impedance from 50 ohms to 53.5 ohms, generating uncorrected signal reflections at the launch boundary.
Surface roughness treatment, such as reverse-treated copper or electrodeposited foil, adds frequency-dependent attenuation that must be accounted for in the calibration standards.
- Dielectric Constant Anisotropy alters z-axis permittivity relative to in-plane permittivity, causing discrepancy between simulated and measured propagation constants.
- Etch Factor Trapezoidal Cross-Sections shrink top trace width relative to bottom copper width, distorting characteristic line impedance profiles.
- Solder Mask Dielectric Dispersion introduces non-linear attenuation and phase shifts when mask coverage extends over high-frequency microstrip test traces.
- Plating Finish Surface Roughness degrades conductivity when nickel-gold surface treatments force high-frequency skin currents through lossy nickel intermetallic layers.
Probe Interface Discontinuities
Contact resistance shifts vector measurements. Micro-coaxial probing and coplanar ground-signal-ground (GSG) wafer probes provide precise signal launch up to 110 GHz. Variations in probe skate, contact pressure, and pad oxidation alter contact resistance by several tenths of an ohm.
At sub-ohm ESR measurement points for high-Q coupling capacitors, a 0.2-ohm probe contact variation swamps the true device resistance by hundreds of percent.
A two-micrometer error in probe tip placement on coplanar calibration standards shifts reference plane location by 15 femtoseconds, corrupting phase measurements above 30 GHz.
Substrate suppliers routinely defend measurement discrepancies by claiming that customer panel processing temperatures altered the baseline substrate relative permittivity beyond factory test values.
Distortion
Mathematical operations performed on noisy measurement data generate unphysical artifacts during fixture removal. De-embedded S-parameters can violate fundamental physical laws, demonstrating active power gain in passive capacitors or non-causal impulse responses in time-domain transformations.
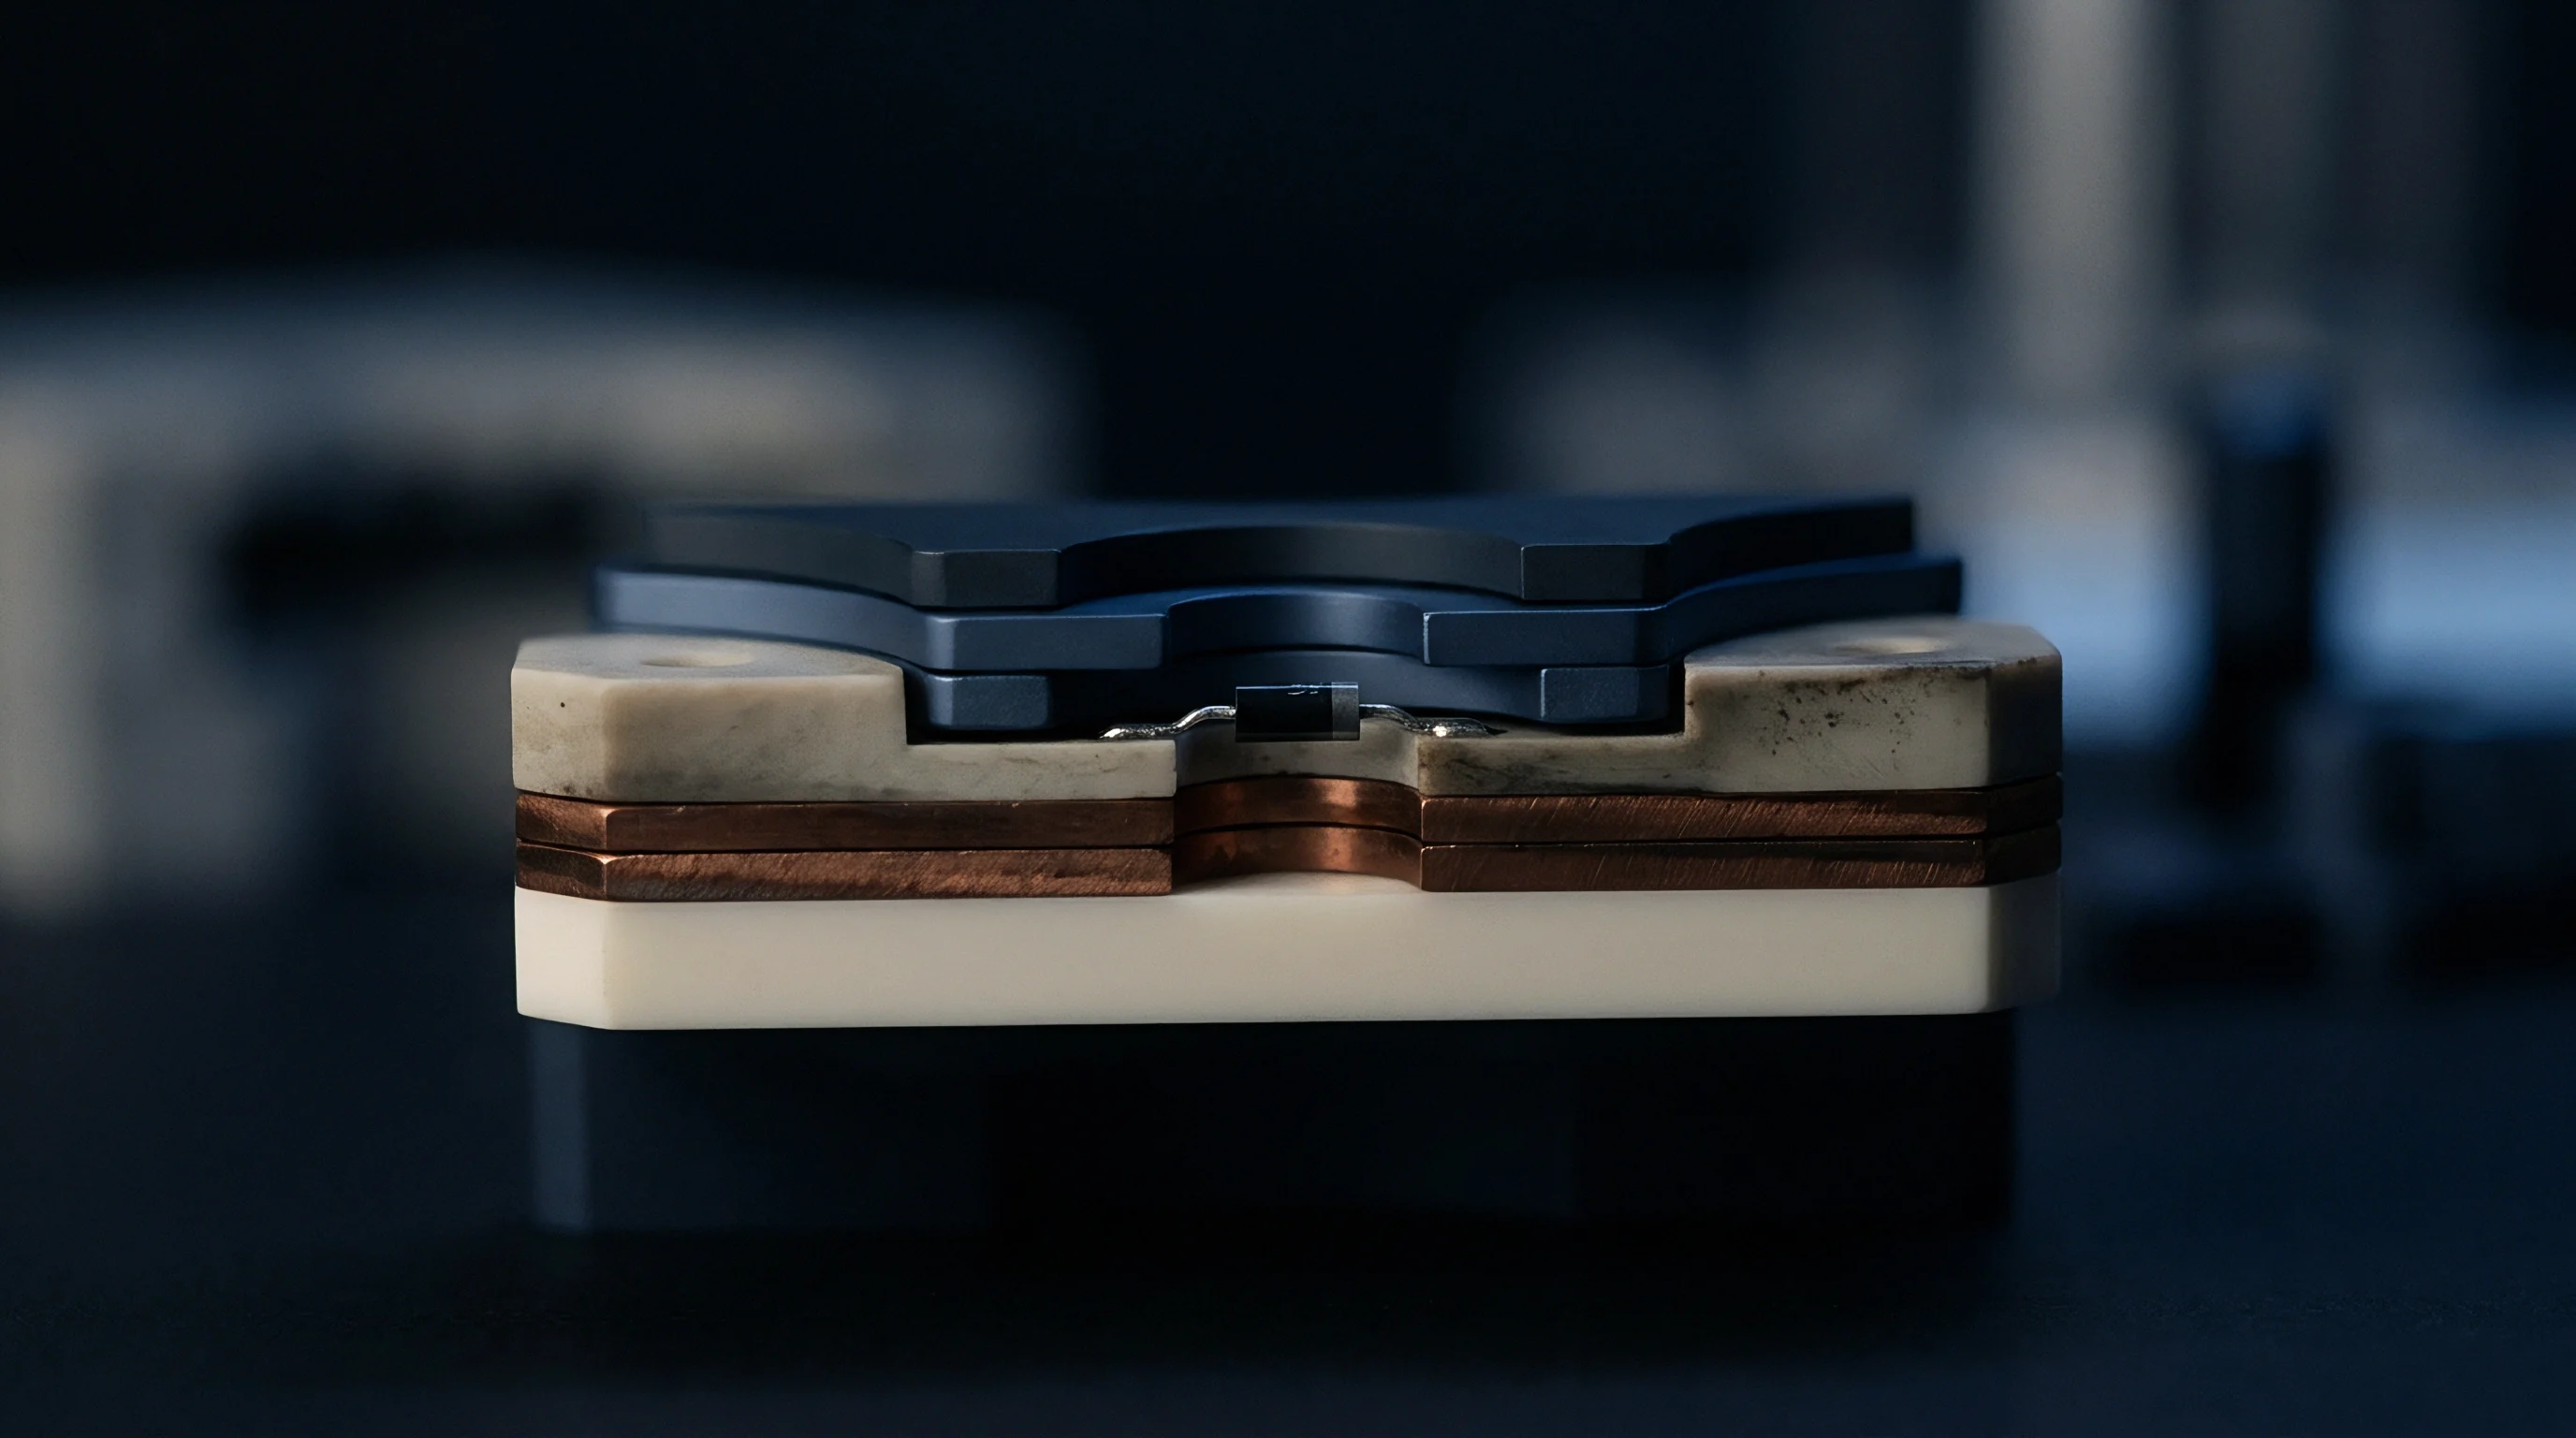
What Triggers Passivity Violations during Matrix Inversion?
Inverting raw measurement matrices that contain small experimental errors introduces passivity violations. A passive component cannot transmit more energy than it receives. If raw S-parameter measurements contain calibration drift or probe alignment errors, the matrix division step in 2xThru de-embedding can produce S-parameter magnitudes exceeding unity (|S21| > 1.0 or |S11| > 1.0).
In the time domain, this artifact acts as an active amplifier, causing transient circuit simulations to blow up or fail convergence tests.
Uncalibrated fixtures yield meaningless parameters. Mathematical enforcement algorithms force passivity by truncating singular values or applying convex optimization. Restoring passivity through mathematical smoothing alters the real part of the device impedance, obscuring the true equivalent series resistance of low-loss high-frequency ceramic capacitors.
| Frequency | De-Embedding Methodology | Extracted ESR (mΩ) | Extracted ESL (pH) | Passivity Status | SRF Shift (%) |
|---|---|---|---|---|---|
| 10 GHz | IEEE 370 2xThru (Time-Gated) | 145 ± 5 | 180 ± 2 | Passive | 0.0 |
| 10 GHz | Direct SOLT (Uncorrected Pads) | 210 ± 18 | 245 ± 8 | Passive | -12.4 |
| 20 GHz | IEEE 370 2xThru (Time-Gated) | 198 ± 8 | 182 ± 3 | Passive | +0.2 |
| 20 GHz | Scalar Response Subtraction | 112 ± 25 | 140 ± 15 | Violated (|S21| = 1.04) | +18.6 |
| 40 GHz | IEEE 370 2xThru (Time-Gated) | 310 ± 14 | 185 ± 4 | Passive | +0.5 |
| 40 GHz | Automatic Fixture Removal (AFR) | 280 ± 32 | 198 ± 12 | Violated (|S21| = 1.08) | -8.1 |
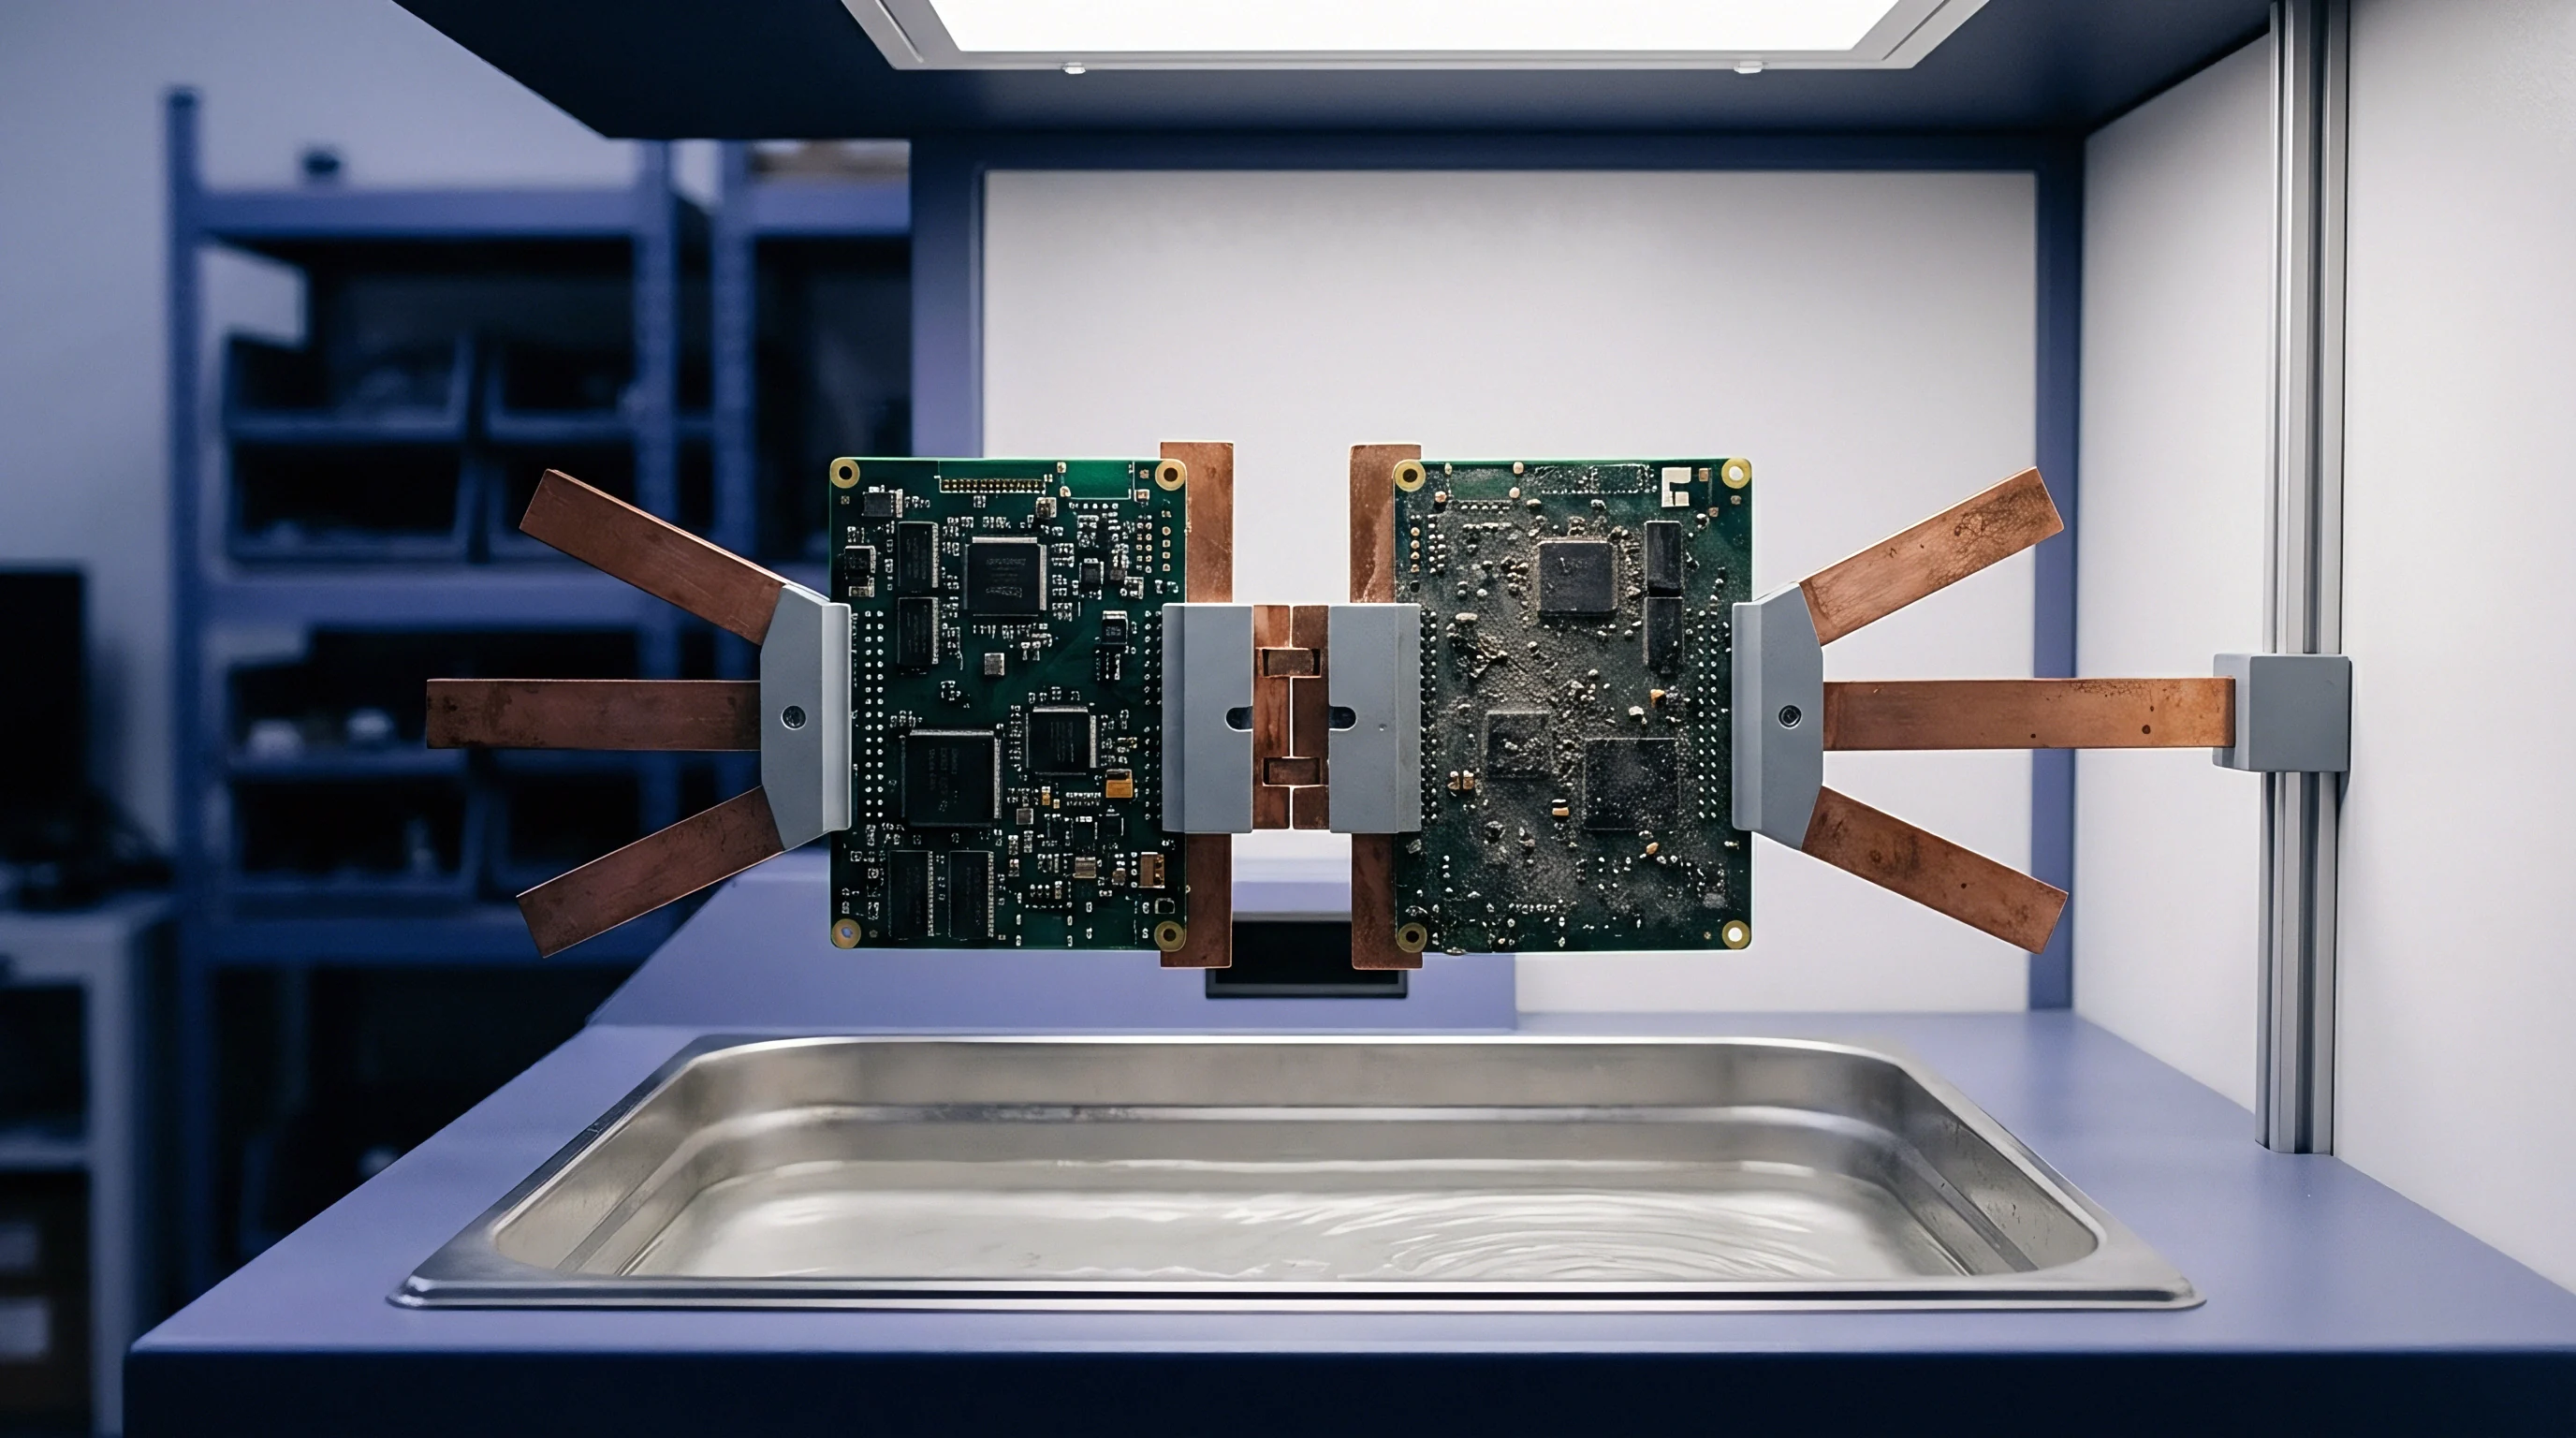
Series Resonance Shift Mechanics
Over-correcting for mounting pad parasitics distorts self-resonance frequency (SRF) calculations. High-frequency coupling capacitors exhibit a characteristic V-shaped S21 impedance curve, transitioning from capacitive behavior to inductive behavior at the series resonance frequency where capacitive reactance equals inductive reactance. If the de-embedding process subtracts excessive series inductance from the fixture leads, the calculated SRF shifts upward into higher frequency bands.
Coaxial transitions introduce parasitic reactance. When fixture de-embedding removes true component package inductance alongside microstrip trace inductance, the resulting component model predicts stable coupling performance at frequencies where the physical component is already operating deep in its inductive rejection zone. Signal integrity engineers relying on over-corrected Touchstone files encounter unexpected transmission line attenuation when populating production boards with the verified components.
Whether non-causal phase tails observed above 40 GHz originate from sub-micron dielectric dispersion within the ceramic substrate or residual calibration standard asymmetry remains a disputed question among microwave measurement characterization groups.
Evidence
Cross-border procurement of high-frequency coupling capacitors requires verifiable test files alongside physical component shipments. Component distributors and tier-one automotive or telecom manufacturers demand standard Touchstone files backed by audited fixture removal documentation to prove compliance with high-speed interface standards such as PCIe 6.0, PAM4 112G SerDes, and 5G mmWave front-ends.
Touchstone Compliance and Technical Dossiers
File format compliance prevents simulation errors. Vector network analyzers export S-parameter data in Touchstone version 1.0 (.s2p) or version 2.0 (.ts) formats. A complete technical dossier includes raw measurement files, calibration artifact S-parameters, 2xThru reference trace data, and the final de-embedded DUT Touchstone file.
Data files must specify the reference port impedance, data format (Real-Imaginary, Magnitude-Angle, or Decibel-Angle), and sweep frequency points.
Precision probes wear quickly. Test houses maintaining accreditation under ISO/IEC 17025 undergo regular audits of their RF characterization protocols. Test reports must detail calibration standard serial numbers, ambient laboratory temperature, relative humidity, VNA receiver bandwidth settings, and averaging factors.
Skimping on technical file rigor exposes component buyers to severe field return liabilities when high-speed server backplanes experience link failures traced to inaccurate S-parameter models.
| Qualification Regime | Sample Size Per Batch | Fixture Setup Cost (USD) | Unit Test Cost (USD) | Escape Risk Level | Technical Dossier Requirement |
|---|---|---|---|---|---|
| Level 1: Basic LCR Meter Verification | 100% (1 kHz – 1 MHz) | $500 | $0.02 | Extreme (High RF Escape Rate) | Certificate of Conformance Only |
| Level 2: Fixture-Uncorrected VNA Sweep | 30 Units | $2,000 | $1.50 | High (Uncorrected Fixture Noise) | Raw S2P Files |
| Level 3: IEEE 370 De-Embedded VNA Protocol | 10 Units | $8,500 | $12.00 | Very Low | Full Dossier (2xThru + S2P + Quality Check) |
| Level 4: On-Wafer Probed Substrate Sweep | 5 Units per Die Lot | $25,000 | $85.00 | Minimal | ISO/IEC 17025 Accredited Report |
Batch Release Economics
Data delivery validates batch quality. Implementing high-frequency fixture de-embedding increases initial component lot qualification expenses while suppressing overall product landed costs. Investing in rigorous IEEE 370 de-embedding upfront prevents costly system-level board spins caused by faulty passive component modeling.
- Raw S-Parameter Inspection confirms data completeness, point density, frequency range coverage, and correct Touchstone version formatting.
- Passivity and Causality Validation runs automated checks verifying that no S21 matrix values exceed 1.0 and transient step responses display zero non-causal pre-shoot.
- Reference Plane Distance Audit checks that lead-in line delay subtractions exactly equal physical fixture trace lengths within 50-femtosecond tolerances.
- ESR and ESL Extraction Check verifies that extracted series resistance and inductance remain stable across flat out-of-resonance spectrum bands.
High-frequency components shipping with validated, de-embedded Touchstone dossiers pass incoming quality control checks without customer intake rejection.