Measuring in Plane Core Permittivity Using Split Post Dielectric Resonators
Split post dielectric resonators measure in-plane core permittivity non-destructively, preventing impedance shifts caused by glass weave anisotropy.


Cavity
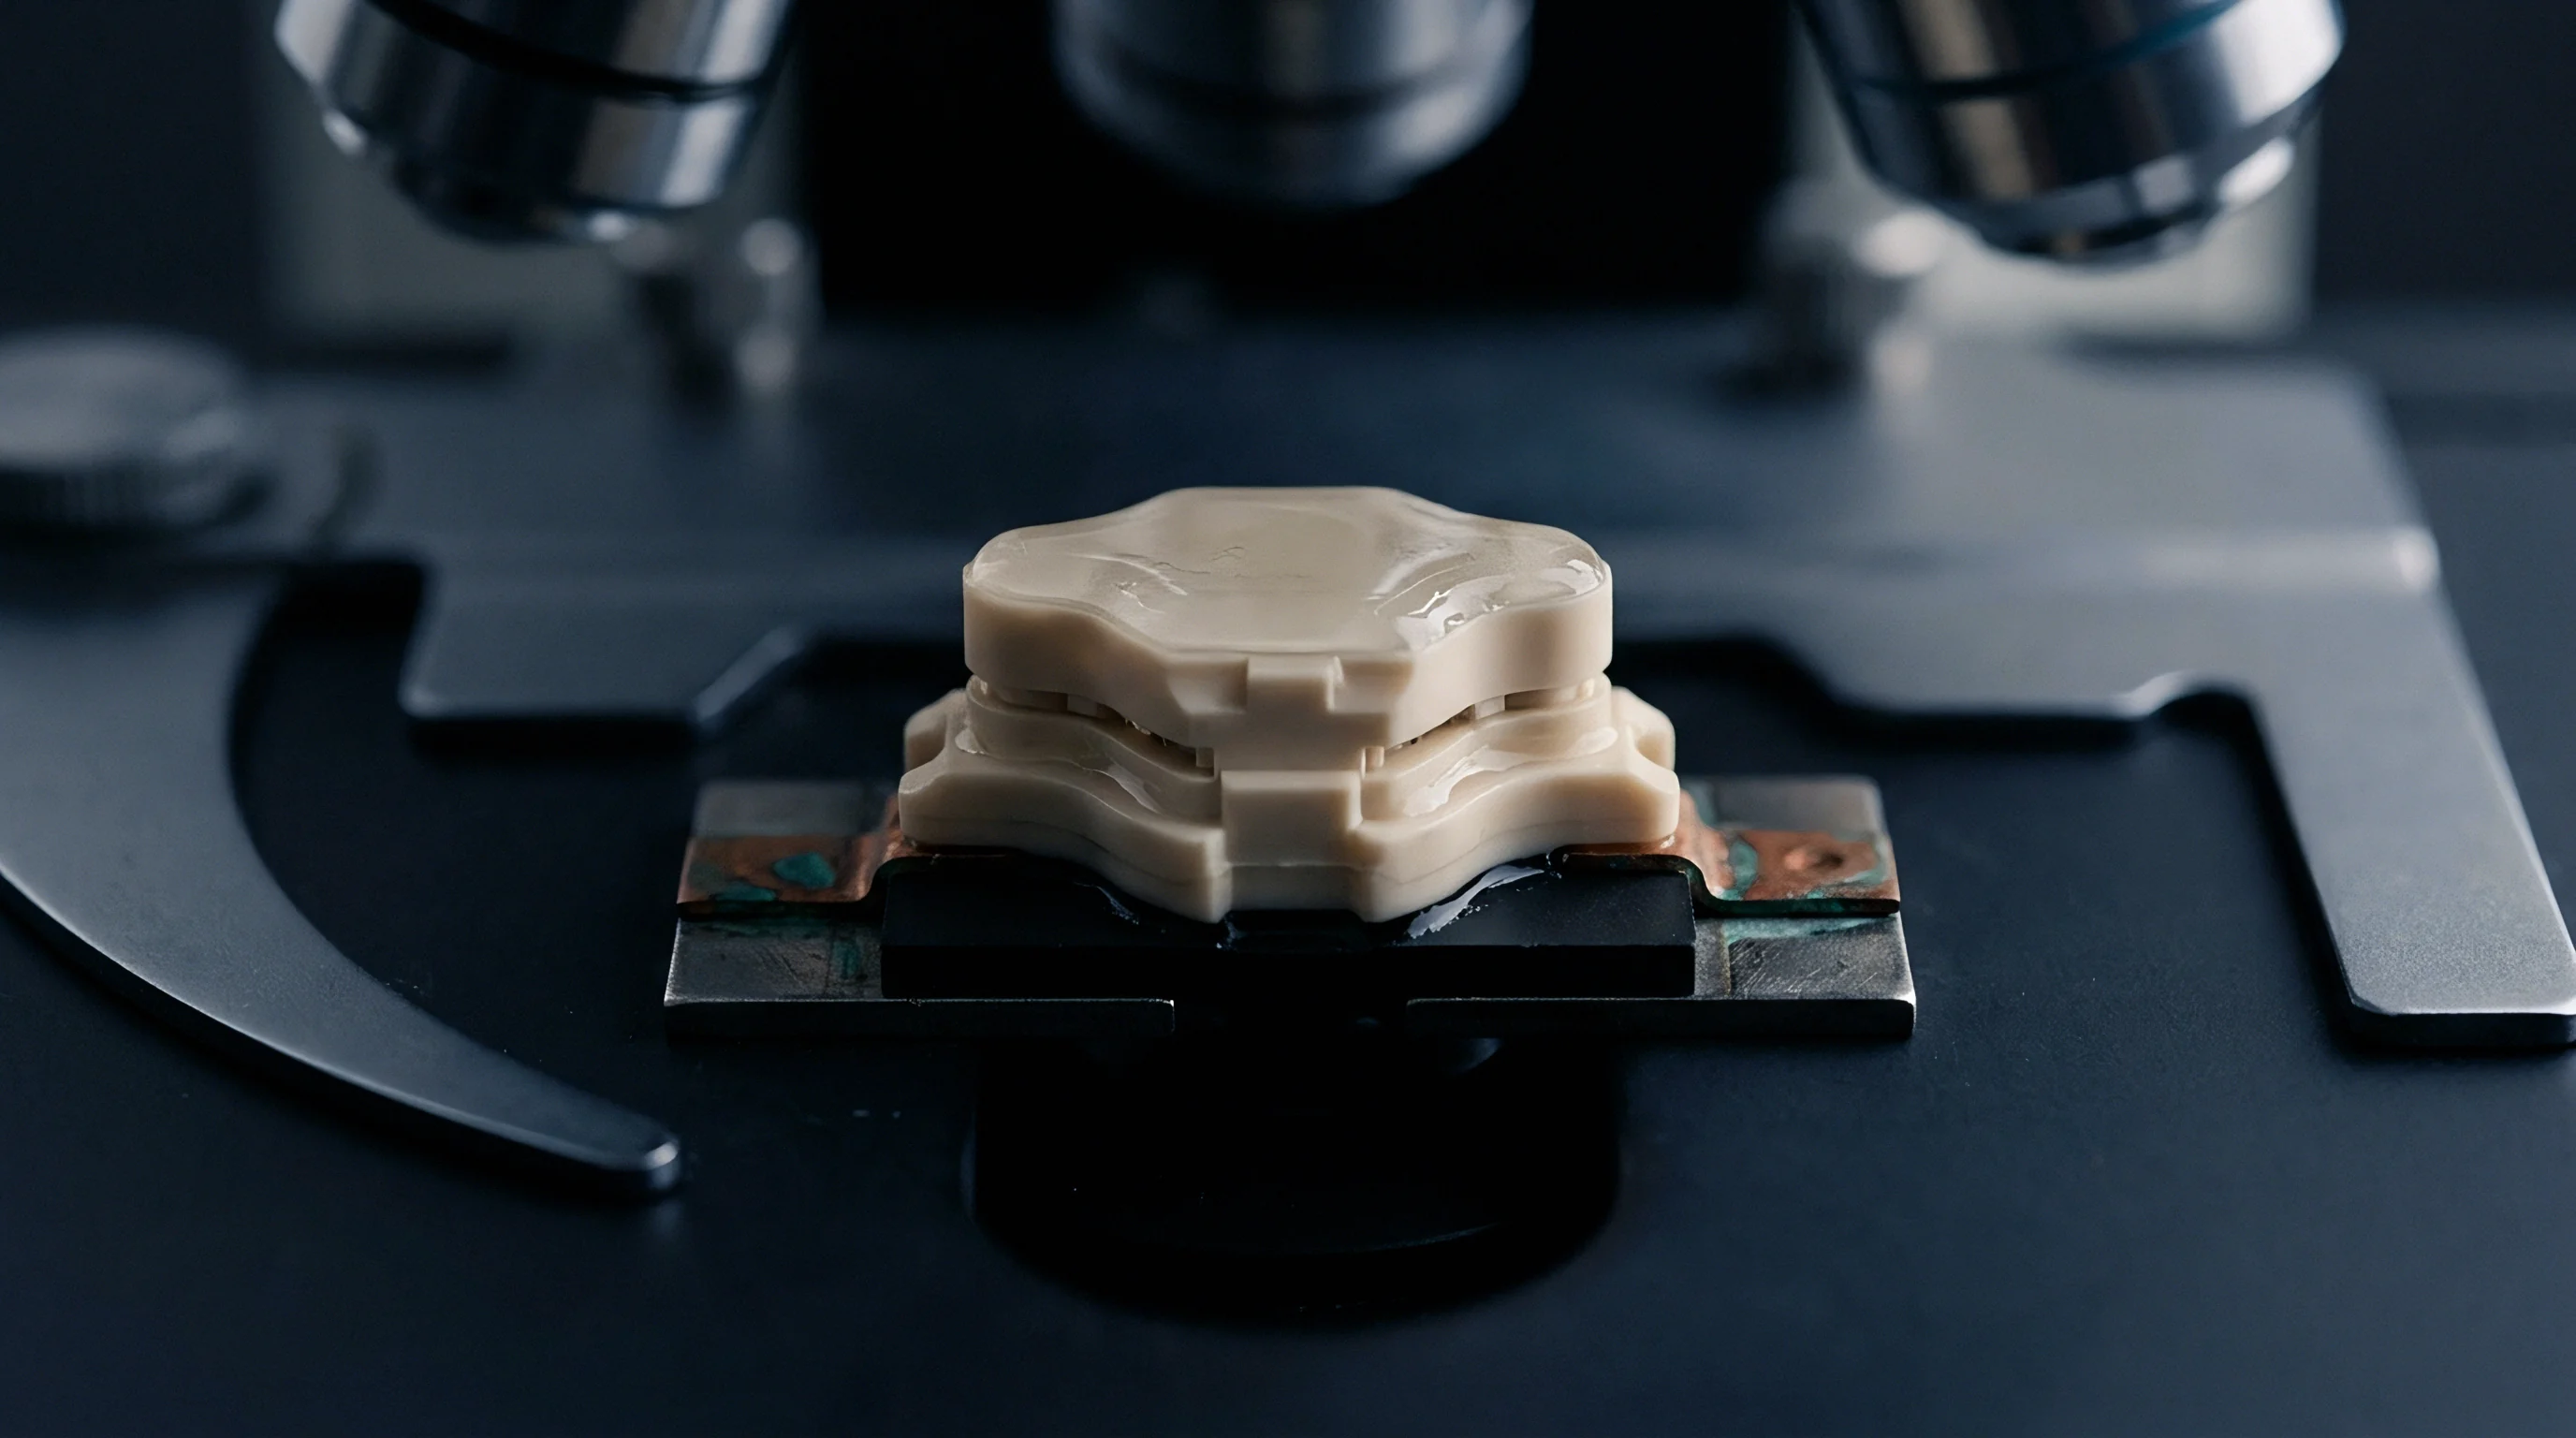
Splitting a microwave dielectric fixture into mirrored cylindrical halves creates an open central gap where an unclad core specimen slides into place without mechanical clamping. High-permittivity ceramic disks on low-loss supports inside each half establish resonant standing waves when driven by a vector network analyzer. High-frequency signals delivered through coaxial lines excite circular electric modes in the ceramic elements, creating an excitation field across the split.
Electromagnetic Field Orientation in Split Resonators
Circular symmetric modes in these fixtures set up tangential electric field lines parallel to the substrate surface. In the fundamental transverse electric configuration, the primary field forms closed horizontal rings centered on the axis of symmetry, while axial components disappear entirely across the central gap plane. The polarized field thus interacts only with properties along the substrate’s length and width, leaving vertical dielectric characteristics untouched.
Because the substrate rests flat in the gap, its planar glass fibers and resin matrix experience uniform horizontal excitation. Measuring dielectric response in this orientation isolates in-plane permittivity from out-of-plane properties without requiring conductive electrodes or edge metallization.
At ten gigahertz, a split post dielectric resonator operating in the azimuthally symmetric mode maintains zero electric field normal to the laminate face across the central sample gap.
Azimuthal Mode Field Distribution
Circumferential polarization reaches peak energy density inside the gap at a radius set by the ceramic post diameter and enclosure dimensions. Field strength falls off to near zero at the outer metal walls, preventing radiation leakage through the substrate slot. Substrates extending beyond the fixture edge show no edge scattering, which allows non-destructive testing of full production panels as well as small cut coupons.
When an unclad dielectric specimen enters the open slot, dielectric displacement currents alter both the resonant peak position and the half-power absorption bandwidth. Higher dielectric constants shift the resonant peak downward, while material absorption broadens the transmission curve, pulling down the unloaded quality factor.
- Resonant Operating Frequency Defines the center transmission peak of the empty fixture, set by ceramic disk dimensions and the dielectric properties of the internal posts.
- Azimuthal Polarization Vector Directs electrical energy entirely within the horizontal plane of the core sample, isolating horizontal permittivity components.
- Substrate Gap Height Specifies the clearance between ceramic disk faces, setting the maximum permissible thickness for inserted laminate coupons.
- Energy Confinement Radius Restricts peak electric field concentration to the inner third of the fixture radius, preventing peripheral radiation loss.
Assuming that dielectric values derived from clamped-stripline or fluid-displacement test methods apply equally across all microwave circuit geometries breaks down in edge-coupled lines, patch radiators, and coplanar structures where horizontal field components dominate signal propagation.

Thickness
Physical thickness measurements on unclad core specimens directly govern the precision of calculated permittivity values. Because dielectric constant calculations in split resonators rely on the exact volume of material inside the gap, small errors in caliper readings produce large systematic shifts in reported planar permittivity.

Sample Dimensional Sensitivity and Caliper Bias
Clamping an unclad laminate core with flat micrometer anvils compresses soft resin between glass bundles and deforms the surface. This mechanical indentation understates specimen thickness, leading the extraction algorithm to overstate the dielectric constant. Using spherical anvils or non-contact optical profilers avoids resin compression errors on soft high-frequency laminates.
Surface roughness left on unclad cores after copper etching alters the effective dielectric volume in the gap. High-profile copper foils leave tooth impressions in resin faces, creating microscopic air pockets that lower the effective dielectric loading measured by the resonator.
| Laminate Resin Core Type | Nominal Depth (mm) | Caliper Error (mm) | True Permittivity | Derived Permittivity | Calculation Error (%) |
|---|---|---|---|---|---|
| PTFE / Microglass Core | 0.127 | -0.005 | 3.00 | 3.12 | +4.00 |
| PTFE / Microglass Core | 0.254 | -0.005 | 3.00 | 3.06 | +2.00 |
| Hydrocarbon / Woven Glass | 0.203 | +0.008 | 3.48 | 3.35 | -3.74 |
| High-Tg Epoxy / Glass | 0.508 | +0.012 | 4.30 | 4.20 | -2.32 |
Measuring dielectric thickness with spherical anvil micrometers prevents point-indentation errors on unclad core surfaces during resonance extraction.
Uncertainty Propagation in Permittivity Equations
Extraction models determine substrate permittivity from the ratio of frequency shift to specimen thickness within the field footprint. Thinner cores heighten sensitivity to frequency shifts, magnifying the effect of caliper tolerances. A five-micrometer error on a 0.100 mm core changes extracted permittivity by over five percent, shifting calculated microstrip impedance by several ohms.
Chemical copper removal that leaves trace metallic residues or silane coupling agents skews resonant absorption measurements, artificially elevating the measured loss tangent.
- Mechanical Anvil Compression Deforms soft resin surfaces during micrometer clamping, introducing negative bias into substrate volume data.
- Etched Surface Roughness Leaves micro-cavities from foil tooth profiles, creating air-dielectric interfaces that depress measured bulk permittivity values.
- Multi-Point Grid Averaging Records dimensional data across at least nine locations within the central field footprint.
- Optical Thickness Profiling Employs non-contact laser displacement sensing to determine core thickness without applying mechanical pressure to resin faces.
Relying on nominal laminate thickness instead of measuring actual post-etch coupons leads to unrealistic impedance tolerances on fabrication drawings, prompting engineering queries during stackup approval.

Anisotropy
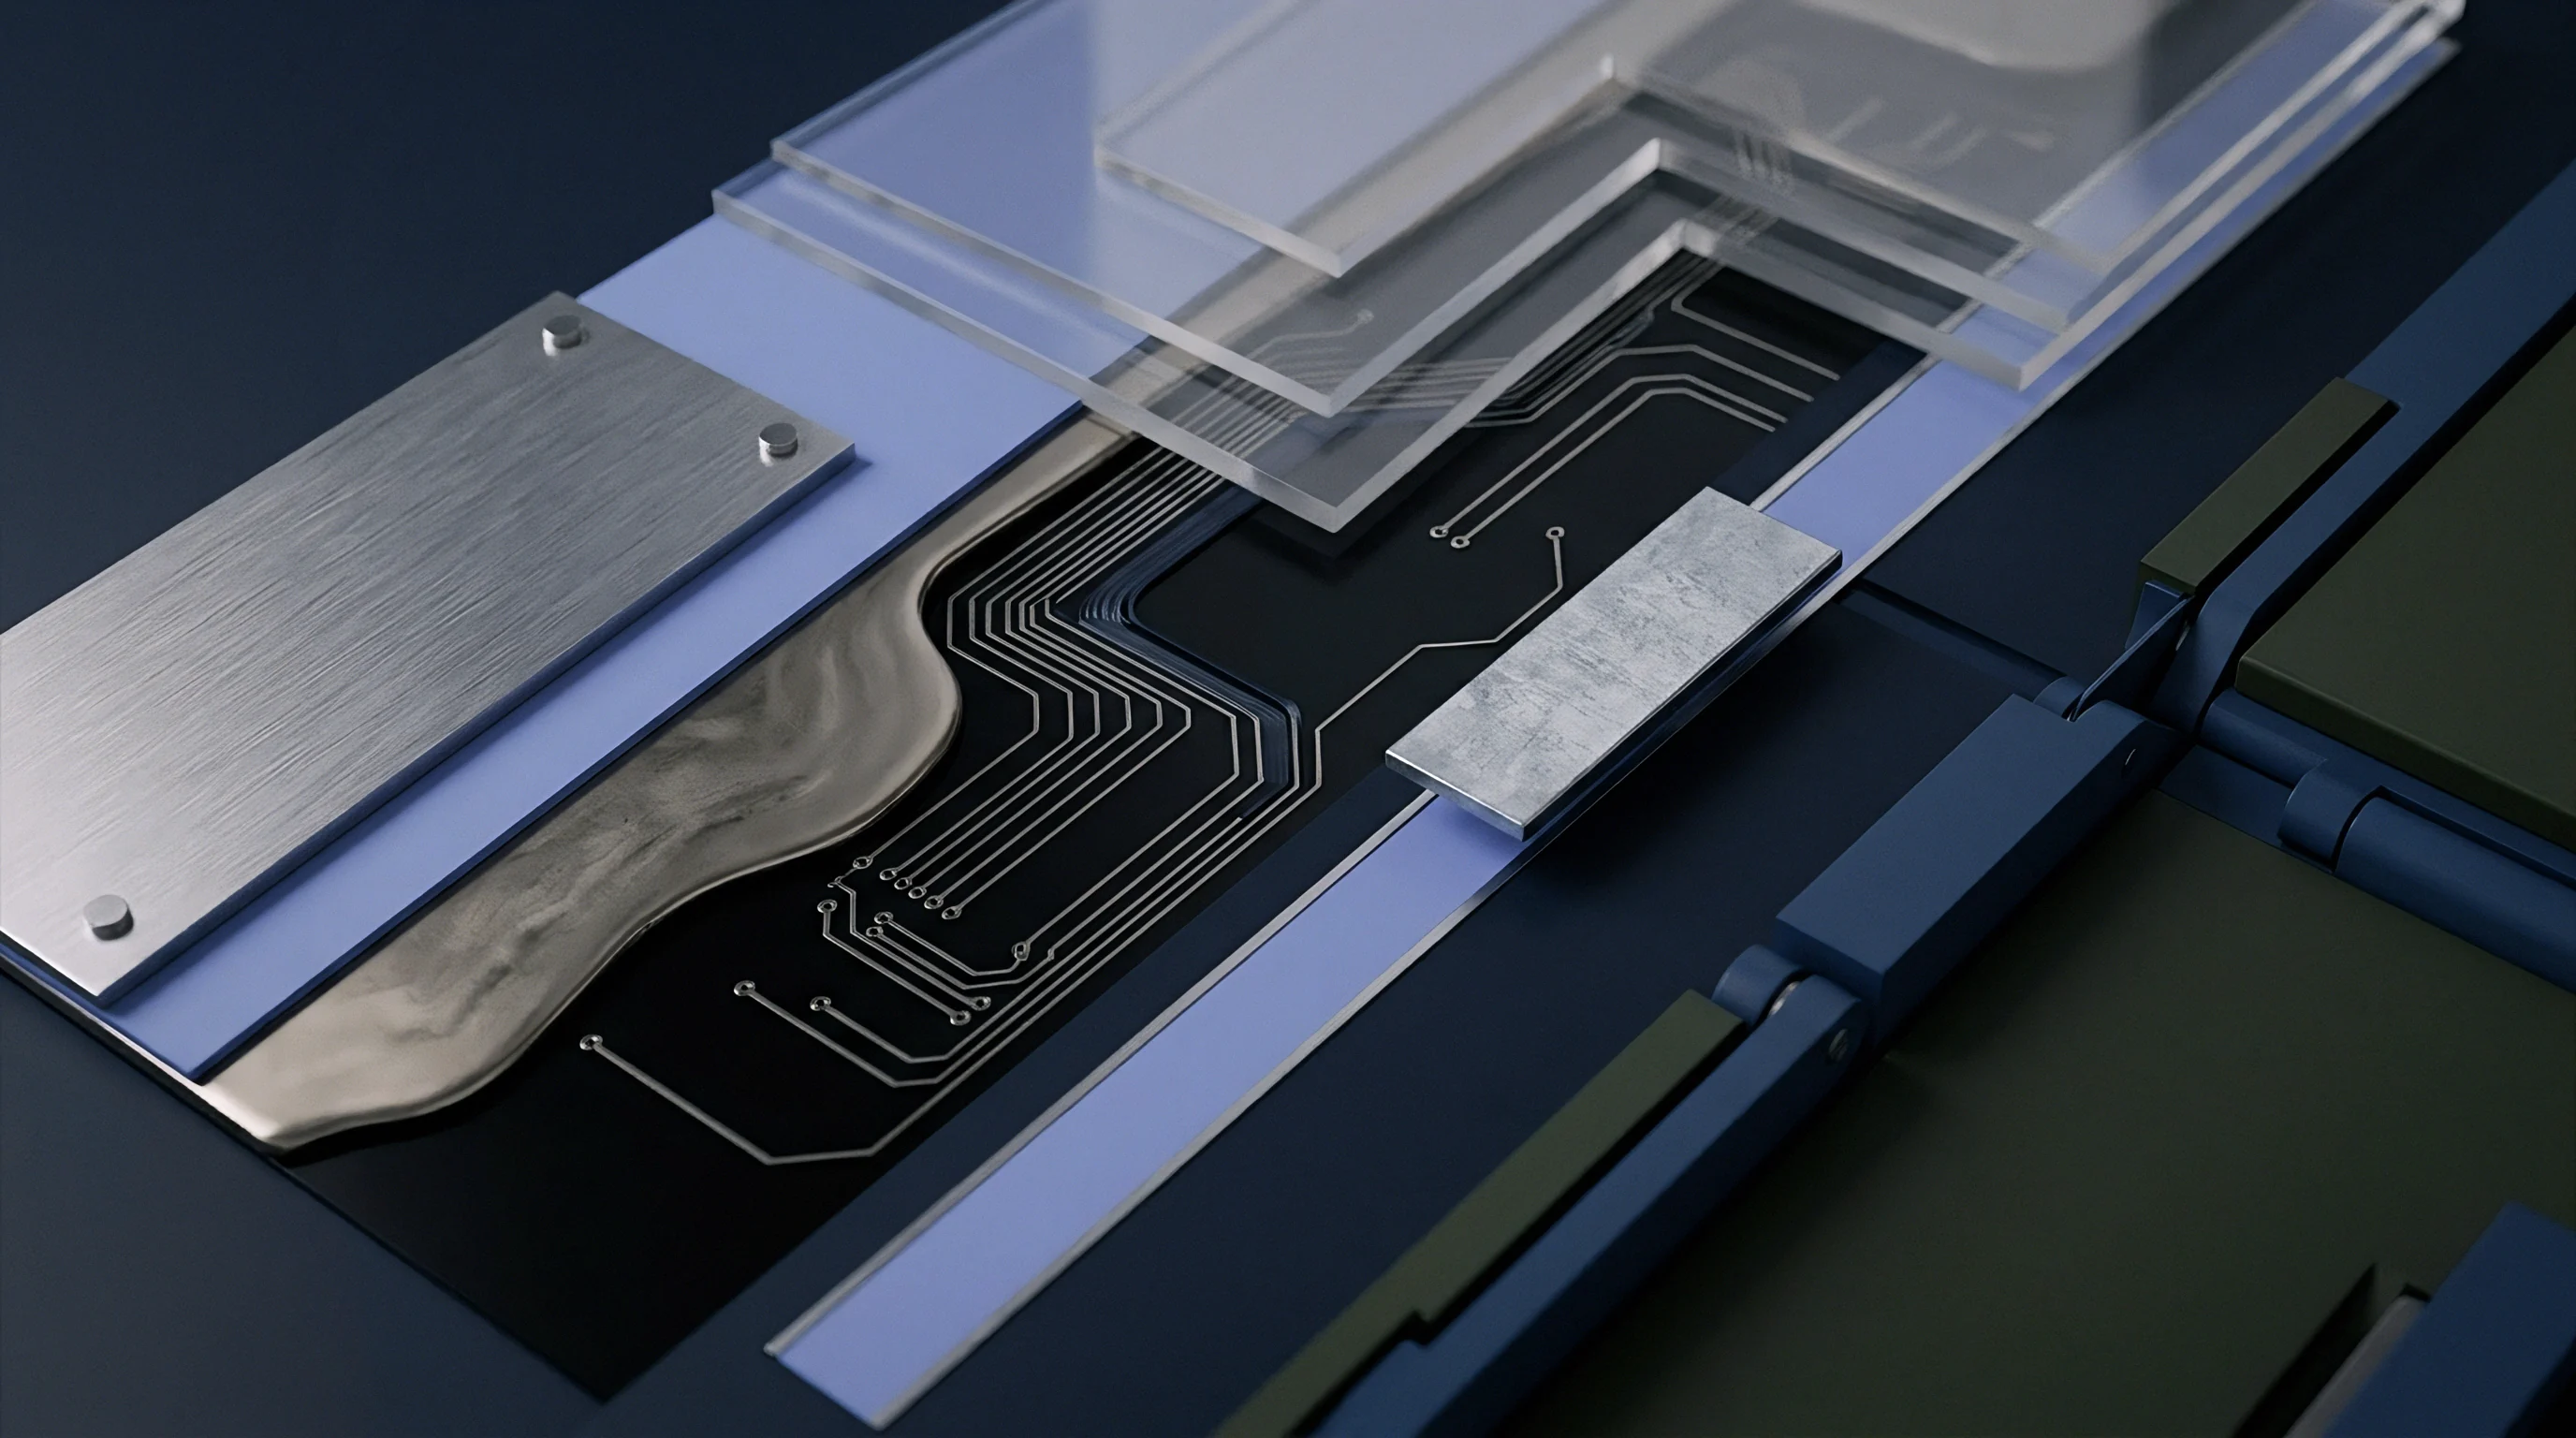
Composite substrates made from woven fiberglass and thermoset or thermoplastic resins exhibit directional electrical properties. E-glass filaments have an intrinsic dielectric constant near 6.6 at ten gigahertz, NE-glass filaments sit near 4.4, and surrounding resin matrices range between 2.8 and 3.2. Because continuous glass filaments lie flat within horizontal fabric layers, electric field lines running parallel to the board face see a higher glass-to-resin ratio than field lines passing through vertically.
Why Does in Plane Permittivity Diverge from Z Axis Measurement?
Standard clamped-stripline fixtures impose a vertical electric field across thin laminate specimens, measuring strictly out-of-plane permittivity. Split post resonators drive horizontal field vectors, capturing in-plane permittivity on the same material. Because horizontal vectors follow continuous glass filaments along the length and width axes, in-plane permittivity typically exceeds vertical permittivity by five to fifteen percent, depending on glass weave and resin content.
In high-frequency designs using coplanar waveguides or edge-coupled differential pairs, broadside and edge field coupling sends electric lines through in-plane laminate regions. Designing differential line geometries using vertical dielectric constant values from vendor datasheets creates impedance shifts and timing skew across high-speed parallel channels.
| Glass Fabric Style | Resin Content (%) | Vertical Dk (Z-Axis) | Planar Dk (X-Y Plane) | Anisotropy Ratio (Dk-xy / Dk-z) |
|---|---|---|---|---|
| 106 Standard E-Glass | 68 | 3.45 | 3.68 | 1.067 |
| 1080 Standard E-Glass | 62 | 3.65 | 3.92 | 1.074 |
| 2116 Standard E-Glass | 54 | 3.85 | 4.18 | 1.086 |
| 7628 Standard E-Glass | 43 | 4.20 | 4.62 | 1.100 |
| 1078 Low-Dk Glass | 64 | 3.10 | 3.22 | 1.039 |
Compliance with IPC-TM-650 Method 2.5.5.13 requires unclad core specimens free of copper surface treatments or etching residue prior to resonator insertion.
Glass Weave Orientation and Volumetric Fiber Fractions
Tightly woven glass fabrics like 7628 contain high bundle counts per inch, maximizing continuous horizontal glass volume and elevating in-plane permittivity. Loose styles like 106 or spread-glass weaves like 1078 reduce planar dielectric concentration, bringing in-plane values closer to vertical baselines. Cores with high resin content show less anisotropic divergence because resin accounts for a larger volume across all axes.
Etching removes the metallic boundary layer and exposes structural fiber bundles just beneath the resin surface. Unclad cores must be thoroughly dried post-etch to remove absorbed moisture; water has a static dielectric constant near 80 and skews planar permittivity readings even in trace amounts.
- Edge-Coupled Impedance Discrepancies Arise when spatial routing models assume vertical permittivity for horizontal field lines between adjacent parallel traces.
- Propagation Delay Inconsistencies Emerge in coplanar waveguide lines because phase velocity depends on horizontal composite dielectric constants.
- Glass Fabric Density Effects Concentrate continuous E-glass filaments along horizontal axes, raising planar dielectric values above vertical baseline data.
- Resin Volume Displacement Reduces anisotropic divergence in thin, resin-rich laminate cores featuring loose glass weave styles.
What structural modifications in low-loss glass fabric manufacturing will eliminate directional permittivity variance without compromising mechanical dimensional stability during lamination?

Derivation
Quantifying complex planar dielectric parameters requires tracking changes in microwave resonance when a specimen enters the active gap. High-precision vector network analyzers capture the shift in center frequency and the drop in transmission quality factor, providing raw input for dielectric extraction equations.

Permittivity and Loss Tangent Extraction Equations
Extraction begins by recording the empty fixture’s baseline center frequency and unloaded quality factor. Inserting an unclad sample lowers the resonant peak frequency and dampens its amplitude through material absorption. Specimen thickness and slot dimensions determine the filling factor, which governs the analytical link between observed frequency shifts and real permittivity.
The real component of complex permittivity scales directly with the fractional frequency drop, normalized by specimen thickness and cavity field energy distribution functions.
Resonator quality factors above ten thousand allow distinction between dielectric loss and surface radiation during unclad substrate evaluation.
Worked Frequency Shift and Quality Factor Calculation
Evaluating an unclad hydrocarbon core with an average thickness of 0.254 mm illustrates the calculation. The empty resonator exhibits an initial center frequency of 9.9500 GHz and an unloaded quality factor of 12,500. Inserting the test core shifts the center frequency down to 9.6200 GHz and lowers the quality factor to 2,100 through dielectric absorption.
Iterative energy balance formulas convert observed frequency displacement into real permittivity. A frequency drop of 330 MHz on a 0.254 mm substrate corresponds to a real in-plane dielectric constant of 3.55 at 9.62 GHz. Evaluating quality factor decay yields an extracted loss tangent of 0.0021, separating bulk dielectric absorption from fixture radiation losses.
- Connect the split post resonator to a calibrated vector network analyzer using low-loss phase-stable coaxial cables.
- Record the empty cavity’s resonant frequency and quality factor from the transmission peak.
- Measure specimen thickness across a nine-point grid using an optical profiler or spherical anvil micrometer.
- Slide the unclad core coupon into the resonator gap until it spans the internal field clearance zone.
- Sweep the transmission response to locate the shifted resonant peak and determine the loaded quality factor.
- Run iterative dielectric extraction software to solve coupled electromagnetic boundary equations for complex planar permittivity.
Iterative extraction algorithms account for higher-order field perturbations in the sample slot, maintaining convergence for substrates with real dielectric constants between two and fifteen.
Sourcing
Securing high-frequency printed circuit boards requires drawing notes that specify the test methods behind quoted dielectric figures. Commercial laminators publish slash-sheet data based on standard clamped-stripline or fluid-displacement testing, giving z-axis dielectric constants that do not reflect performance in coplanar or edge-coupled designs. Specifying split post resonator testing in procurement documents forces fabricators to verify core material quality along functional signal axes before lamination.

Bare Board Procurement and Stackup Specifications
Stackup approval cycles lengthen when fabricators substitute core materials to improve panel yield or reduce raw material costs. Laminate grades sharing identical IPC-4101 slash sheet listings can exhibit different planar dielectric constants if reinforcement fabric styles or glass fiber formulations differ. Explicit fabrication notes mandating split post resonator verification prevent unauthorized core substitutions during production runs.
Quality agreements linking board acceptance to in-plane permittivity compliance protect buyers from trace impedance shifts caused by core batch variations.
| Test Method Standard | Measured Axis | Sample Destructive | Metallization Required | Frequency Band |
|---|---|---|---|---|
| IPC-TM-650 2.5.5.5 (Clamped Stripline) | Z-Axis (Vertical) | Yes | No | 10 GHz Fixed |
| IPC-TM-650 2.5.5.13 (Split Post Resonator) | X-Y Plane (Planar) | No | No | 1 GHz to 20 GHz Discrete |
| IPC-TM-650 2.5.5.6 (Full Sheet Resonator) | X-Y Plane (Planar) | No | Yes (Clad Sheet) | 1 GHz to 3 GHz Low Band |
| IPC-TM-650 2.5.5.12 (Split Cavity) | Z-Axis (Vertical) | No | No | 10 GHz to 40 GHz High Band |
Fabrication Drawing Notes and Batch Verification Protocols
Including material verification clauses in master procurement drawings forces bare-board vendors to pull unclad core coupons from every lamination lot for resonance testing. This incoming inspection catches core permittivity variations before panels undergo drilling, plating, and etching.
Board fabricators maintaining incoming inspection labs use split post dielectric resonators to audit core lots within hours of delivery, returning off-spec raw laminate batches to mills before they reach production.
Every lot of unclad microwave core material delivered under this specification shall possess an in-plane dielectric constant within plus or minus 0.05 of nominal target value when tested per IPC-TM-650 Method 2.5.5.13 at ten gigahertz, and non-compliant material lots shall be rejected prior to panel lamination.