First Pass Yield Adjustments in Contract Electronics Manufacturing
Adjusted first pass yield masks manufacturing defects and latent thermal damage through unlogged re-probes, widened guard bands, and hidden manual rework.


Tally
An in-circuit test station logs a printed circuit board assembly as passed after three failed attempts on the same shift. The diagnostic log records capacitor C104 open on probes 42 and 48, followed by an immediate manual re-test ~ without changing any components ~ that reads 10.2 microfarads. The factory system logs the unit as a first-pass success, altering throughput statistics and masking an unseated contact sleeve in the bed-of-nails receiver.
First Pass Yield measures the proportion of assembled boards that clear every defined inspection and electrical test without intervention, touch-up, re-probing, or parameter overrides. When contract manufacturers quote this metric, commercial reports often diverge from bench reality. The factory calculates yield by dividing units cleared on first exposure by total units loaded into the bay.
In high-volume surface-mount operations, raw arithmetic exposes defects quickly, threatening contractual pricing tiers, scrap limits, and factory bonus structures. To protect those metrics, manufacturers introduce rules that reclassify initial failures as false calls, fixture artifacts, or setup scrap.
Yield numbers improve whenever test software treats an immediate re-probe as an uninterrupted original run.
Adjusted First Pass Yield inserts mathematical filters between physical failures and commercial dashboards, primarily by subtracting perceived false calls from total defect counts. When optical inspection flags a misaligned 0201 resistor, an operator checks the monitor, clears the component, and hits an override key. The board moves down the line with a clean record.
The factory excludes the initial rejection from line tallies because the component was not replaced, assuming human visual checks are more reliable than automated measurements.

Discrepancies in Production Yield Reporting
The gap between raw manufacturing yield and adjusted yield hides structural assembly defects. If optical inspection flags two hundred solder joints out of ten thousand placements, raw first-pass yield drops to ninety-eight percent. If the contract manufacturer reclassifies one hundred and eighty of those rejections as false alarms from surface reflectivity, reported yield jumps back to ninety-nine point eight percent.
That shift masks uneven solder paste deposition, wetting variation, and stencil aperture wear across sequential production gates.
| Inspection Station | Observed Raw Yield Rate | Manufacturer Adjustment Mechanism | Reported Line Yield Rate | Primary Defect Escape Risk |
|---|---|---|---|---|
| Solder Paste Inspection | 93.4 percent | Volume tolerance expansion after dry-run purge | 98.8 percent | Insufficient solder volume on ground pads |
| Automated Optical Inspection | 89.1 percent | Operator visual override on solder fillet height | 97.6 percent | Unwetted component terminations on gull-wing leads |
| In-Circuit Testing | 94.7 percent | Immediate manual re-stroke without component rework | 99.1 percent | Intermittent trace hairline cracks and flux fouling |
| Functional Board Test | 96.2 percent | Power cycle reboot and second-run clearance | 99.4 percent | Marginal thermal dissipation in power MOSFETs |
These reporting adjustments separate accounting from physics. A board that clears functional testing only after an operator resets the DC bench supply usually suffers from marginal rail stabilization or capacitive charging delays. Treating that unit as a first-pass success frames functional vulnerability as a test artifact, masking latent defects across thousands of panels that later survive packaging and ship.

Classification Schemes for Line Fallout
Contract factories group line fallouts into distinct categories to justify data exclusions, giving quality departments a rationale for keeping specific failure logs out of contractual yield deductions.
- Fixture Contact Failures encompass open circuits cleared on subsequent pneumatic actuations without technician intervention.
- Operator Placement Errors involve boards loaded backward in carrier pucks or misaligned within optical conveyor stops.
- Component Non-Conformances isolate supplier-delivered silicon failures and out-of-spec passive reels attributed to external vendors.
- Software Communication Timeouts cover serial diagnostic handshakes that fail because of test rack operating system latencies.
Every diversion assumes that external factors, rather than line control, caused the initial rejection. When component reels show marginal solderability, the factory removes placement failures from the yield tally and files a supplier reject report. The line’s reported First Pass Yield stays artificially high, leading the buyer to assume placement stability while rework operators quietly spend hours maintaining throughput.
Factory management routinely argues that counting fixture contact bounces or camera reflection glitches as assembly failures unfairly penalizes operators for equipment limits beyond their control.
Pin
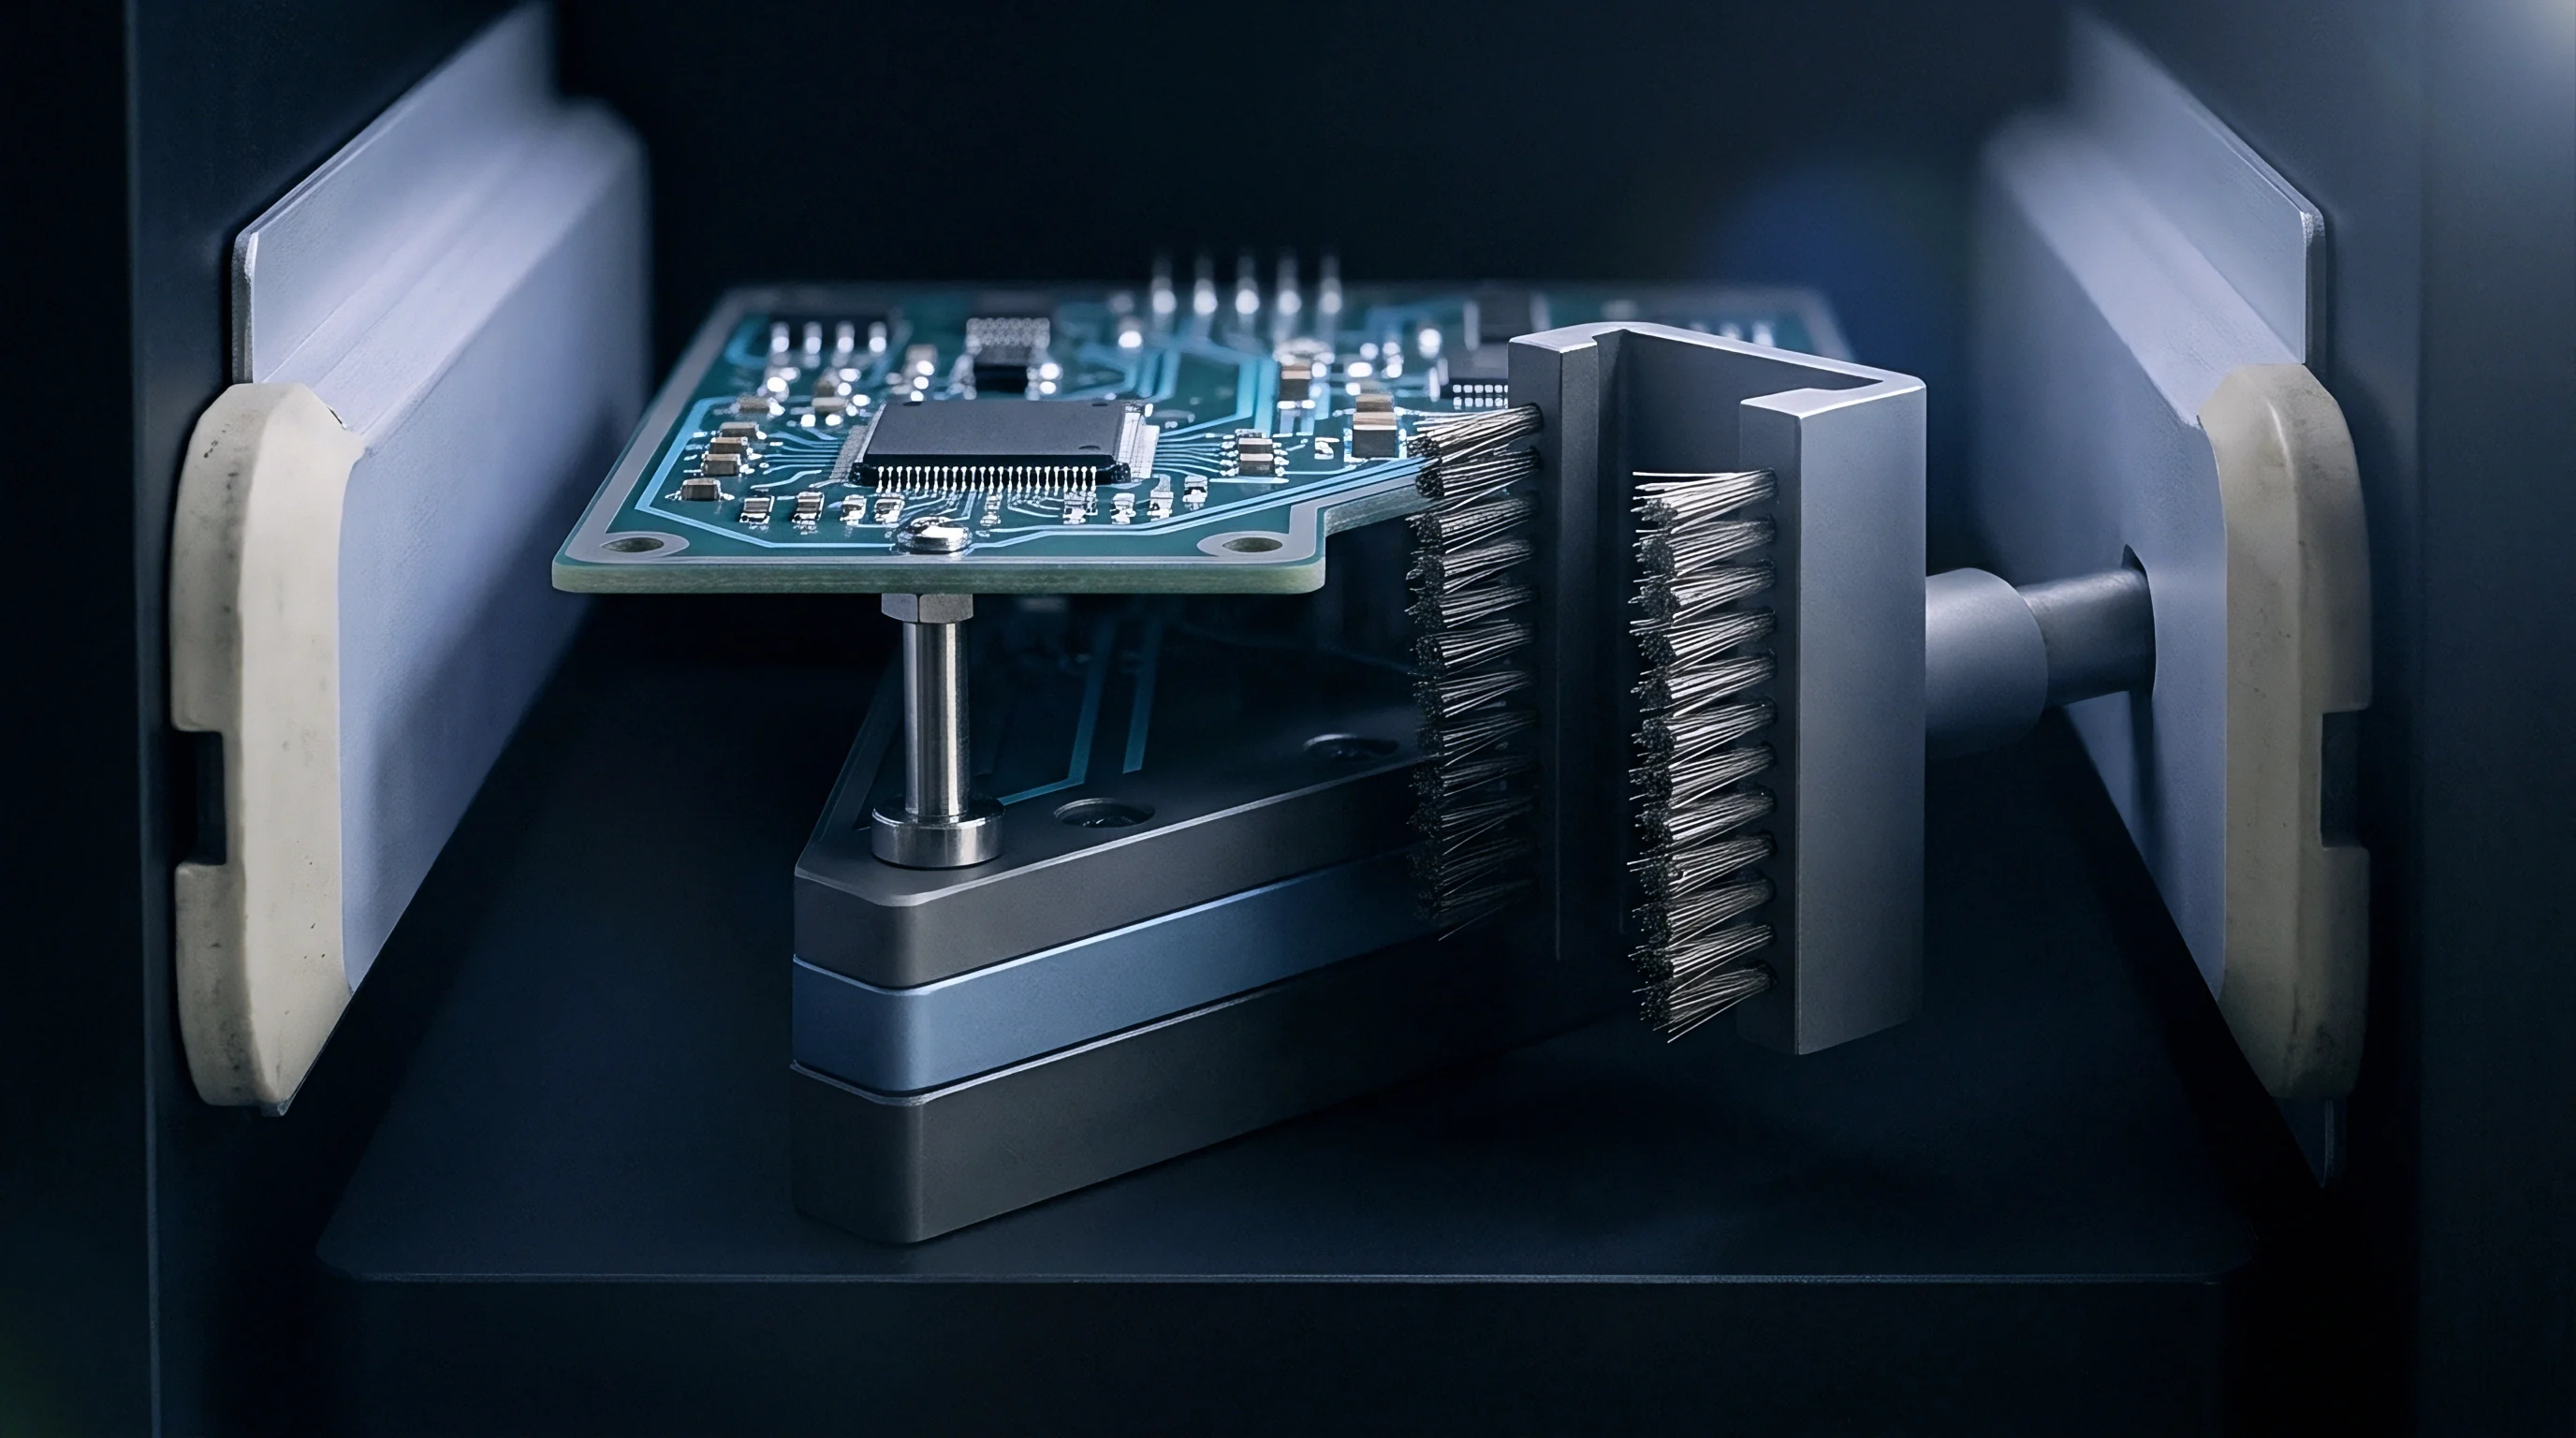
Spring-loaded probes in bed-of-nails fixtures form the primary mechanical interface where false failures occur. Each probe tip strikes a bare copper test pad or solder bead with two to eight ounces of actuation force. Over time, pogo pins oxidize.
As flux residue, atmospheric sulfur, and airborne silicone lubricants coat the tips, probe contact resistance rises from fifty milliohms to tens of ohms. The test receiver reads this interface impedance as a failed net, flagging an out-of-spec passive component or an open solder joint. When the technician cycles the fixture handle a second time, the probe crown breaks through the surface contamination, and the pass is logged.

Which Defects Hide behind Contact Resistance?
Repeating a test cycle to bypass contact resistance blinds diagnostics to genuine assembly defects. When an automated line allows two re-strokes before logging a failure, intermittent cold solder joints easily escape detection. The downward mechanical force of three hundred pneumatic probes flexes the substrate by several hundred micrometers, pushing fractured solder joint surfaces together to create temporary metallic contact.
The instrumentation detects electrical continuity and records a valid pass, but as soon as the fixture releases pressure, the fractured joint springs open again.
A re-stroked fixture punch clears contamination by mechanically flexing the board across underlying microcracks.
Operators often scrape probe tips with brass wire brushes or wipe test surfaces with isopropyl alcohol to restore conductivity, but these fixes alter contact physics. Scrubbing rounds the micro-machined chisel points and spear tips, broadening contact area while lowering localized pressure. That reduced pressure causes further contact instability, triggering another wave of false failures that test engineers typically address by increasing software retry limits instead of rebuilding the probe cassette.

Mechanical Fixture Degradation over Cycle Lifespans
Pogo pin assemblies suffer progressive mechanical fatigue that shifts measurement parameters during high-volume production. Internal springs lose tension after fifty thousand compressions, while receptacles collect solder slivers and debris, creating bore friction that prevents full probe extension.
- Tip Sharpness Verification checks probe penetration through oxidized OSP or immersion tin coatings. Technicians inspect crown edges under thirty-times magnification every ten thousand actuations.
- Actuation Force Profiling verifies that spring resistance stays within ten percent of specification across the bed. Load cells detect collapsed springs beneath dense ball grid array locations.
- Receptacle Alignment Mapping isolates guide plate wear that introduces angular probe tilt relative to target pads. Drift exceeding two degrees causes probes to skate off small annular targets.
- Contact Resistance Logging identifies nets where unadjusted interface impedance steadily rises across consecutive panels. Readings above five hundred milliohms indicate contamination build-up on probe tips.
Mechanical fixtures flex under load. Without sufficient bottom-side support pillars, the circuit board sags away from the probes during actuation, preventing center probes from reaching full nominal stroke depth. Meanwhile, peripheral probes hit the outer rails with excessive force, creating stress risers around surface-mount ceramic capacitors.
When capacitors crack internally under this strain, the initial sweep flags an open contact fault on the outer array. Cycling the fixture again forces the board deeper against the stops, allowing the cracked capacitor to pass capacitance checks because its fractured internal plates remain compressed together until field vibration separates them later.
Repeated pneumatic cycling against stubborn test nets clears surface dirt, but it also drives microcracks deeper into the laminate structure.


Rework
Secondary soldering used to correct initial test fallout alters the metallurgical characteristics of the board assembly. When optical inspection or in-circuit testing flags a bridge, open connection, or misaligned component, the board leaves the automated line for a manual rework station. Technicians use liquid flux ~ which can trap moisture ~ along with high-temperature irons or hot-air nozzles to clear the fault.
This localized heating exposes the board to peak temperatures often exceeding two hundred and sixty degrees Celsius, for durations set by technician technique rather than controlled thermal profiles.

Does Secondary Reflow Degrade Joint Integrity?
Reheating a completed solder joint causes immediate microstructural changes. Tin-lead and lead-free alloys like SAC305 form an intermetallic compound layer where bulk solder meets the copper pad as copper dissolves into the molten alloy. In a controlled reflow oven, copper-tin intermetallic thickness reaches roughly zero point five to one point two micrometers, forming a stable bond primarily composed of Cu6Sn5.
When a technician uses a manual hot-air tool to replace an adjacent component, the neighboring joint reheats, thickening that intermetallic boundary.
Secondary heating expands this intermetallic interface beyond three micrometers, driving the growth of brittle Cu3Sn phases directly over the copper substrate. These thick intermetallic layers show much lower shear strength and fracture toughness under mechanical shock. Just as excessive grain growth in weld heat-affected zones weakens high-pressure steam pipes by concentrating stress along brittle boundaries, solder fillets undergo the same degradation under repeated manual heating.
Reworked joints may pass electrical continuity tests, but they shatter under standard drop-test forces.
A component joint subjected to three manual thermal cycles develops an intermetallic interface exceeding four micrometers in total thickness.
Directing heat solely to the target component is difficult in manual rework. Hot-air exhaust plumes spill onto adjacent parts, subjecting nearby ceramic capacitors and small-outline transistors to severe thermal gradients. Thermal shock creates microcracks within barium titanate dielectric layers that do not cause immediate shorts.
The damaged capacitor clears in-circuit and functional screening, then enters service. Over months of operation, ambient moisture drawn into the microcrack by capillary action causes leakage current to escalate until catastrophic thermal breakdown occurs.

Thermal Budget Depletion on Dense Assemblies
Every printed circuit assembly has a finite thermal budget set by its laminate glass transition temperature and resin decomposition limit. Standard FR-4 laminates have glass transition temperatures between one hundred and thirty and one hundred and seventy degrees Celsius, yet hot-air rework tools routinely project air streams of three hundred and fifty to four hundred degrees Celsius directly onto the board surface.
- Plated Through-Hole Barrel Separation occurs when localized heating expands copper barrels along the Z-axis beyond laminate elastic limits. Resin matrices expand up to four times faster than electrodeposited copper, shearing inner-layer via connections.
- Substrate Delamination and Blistering develops when trapped moisture in prepreg material vaporizes under localized heat. Internal steam pressure splits resin-glass interfaces, creating microscopic air pockets between signal layers.
- Adjacent Component De-Soldering happens when secondary hot air melts solder joints on components within three millimeters of the rework target. Disturbed fillets solidify without proper flux action, forming dull, granular, high-resistance joints.
- Solder Mask Degradation causes discoloration, embrittlement, and blistering around reworked land patterns. Charred solder mask loses dielectric resistance, leading to high-voltage trace creepage failures when exposed to humidity in the field.
Excessive manual intervention strips assemblies of their environmental endurance, converting minor manufacturing defects into unmonitored field liabilities.

Band
Parametric testing verifies that populated circuits function within specific physical, analog, and digital performance limits. In automated lines, functional test fixtures measure reference voltages, clock frequencies, signal rise times, and current consumption across active states. When first-pass functional yield falls below contractual targets, pressure mounts on test parameters, and software administrators frequently widen measurement tolerances to convert marginal failures into passing units, quietly narrowing guard bands.

Guard Limits and Parametric Drift
Guard bands act as safety buffers inside engineering design limits to account for measurement uncertainty, fixture cabling impedance, and instrument calibration variance. If a spec requires a regulated rail of three point three volts with five percent tolerance, physical hardware limits span three point one three five volts to three point four six five volts. Applying a conservative twenty percent guard band tightens test acceptance to between three point two zero one volts and three point three nine nine volts, rejecting marginal units to protect customers from field escapes.
Contract factories facing yield penalties routinely shrink or eliminate these guard bands, pushing test limits out toward absolute specification boundaries. If throughput stays depressed, engineers adjust test scripts to accept looser criteria. In high-power switching converter evaluations, expanding a ripple voltage limit from fifty millivolts to seventy-five millivolts can instantly turn thirty rejected boards per shift into compliant product.
Reported First Pass Yield rises by three percentage points and the factory hits its quota, but the assemblies ship with compromised filter capacitor margins.
| Measurement Net | Design Specification Window | Restricted Guarded Limit | Adjusted Contract Factory Limit | Escaped Latent Mechanism |
|---|---|---|---|---|
| Buck Rail Ripple | 3.30V ± 50mV | 3.30V ± 35mV | 3.30V ± 55mV | Output ceramic capacitor dry joint or cracking |
| Transceiver Sleep Current | 12.0µA Maximum | 9.5µA Maximum | 14.0µA Maximum | Active semiconductor ESD junction leakage |
| Oscillator Frequency Drift | 40.0MHz ± 20ppm | 40.0MHz ± 12ppm | 40.0MHz ± 25ppm | Crystal loading capacitor layout capacitance mismatch |
| LDO Drop-Out Voltage | 200mV Maximum | 160mV Maximum | 220mV Maximum | Pass element thermal saturation under elevated load |

Functional Test Tolerance Creep
Widening test limits changes the statistical distribution of shipped units. In a stable process, measured parametric values form a normal Gaussian curve centered within specification limits. A well-controlled line maintains a process capability index above one point three three, keeping three standard deviations of process variation comfortably inside the guard bands.
When process drift shifts the distribution mean toward a specification boundary, the tail of the curve crosses the fail threshold. The manufacturer must then choose between pausing production to re-center the line or widening software acceptance windows. On a run of twenty thousand communication controllers with a two percent reject rate caused by sleep-mode current exceeding ten microamperes, raising the script limit to fifteen microamperes immediately resolves the immediate bottleneck.
That single adjustment converts four hundred defective boards into shippable units while hiding root causes like flux residue bridging fine-pitch package pins or silicon leakage in high-density ICs. These marginal assemblies ship alongside healthy units. Operating inside sealed enclosures at elevated temperatures, their extra leakage current drains onboard backup batteries in months instead of the intended multi-year lifespan.
Expanding measurement boundaries to absorb process drift raises a fundamental question about whether hardware qualification declarations and environmental compliance remain valid for shipped product.


Penalty
Manufacturing Services Agreements govern the relationship between circuit board buyers and assembly contractors, balancing yield targets against financial liabilities for damaged parts, scrap, and test cycle times. Baseline First Pass Yield metrics in these contracts dictate when financial penalties apply. If baseline yield is set at ninety-five percent, the manufacturer absorbs component scrap costs whenever line yield drops below that target; if yield stays above ninety-five percent, the buyer pays for component attrition, establishing where scrap risk lies.

Contractual Scrap Allowances in Service Agreements
Standard service agreements establish scrap deductibles ranging between zero point five percent and two percent of total bill-of-materials cost. Assembly plants structure yield adjustment protocols specifically to keep official tallies above this deductible threshold. If five percent of a lot fails in-circuit testing from defective solder joints, admitting the failure forces the manufacturer to replace scrapped components and cover rework labor.
Reclassifying those failures as fixture contact anomalies or component variations shifts financial liability back to the buyer through inventory scrap allowances.
Buyers rarely audit the raw data supporting contractor yield dashboards. Managers present clean weekly summary charts showing ninety-eight percent adjusted First Pass Yield while scrap bins behind the line fill with heat-damaged, delaminated boards. Because scrap reporting separates surface-mount fallout from manual insertion and box-build integration, splitting data into isolated operational silos conceals true cumulative yield across the entire manufacturing chain.

Commercial Reconciliation and Batch Release Conditions
Final product acceptance requires matching raw test records against invoiced scrap rates. When auditing production lots, procurement teams need unadjusted machine logs extracted directly from local test rack drives. Comparing raw test counts with contractor invoices exposes the true volume of secondary rework and re-testing hidden behind yield adjustments.
A contract clause permitting unmonitored diagnostic re-tests converts twenty percent line defect rates into ninety-nine percent billable shipments.
Quality audit data from IPC-A-610 Class 2 telecommunications lines indicates that unmonitored manual touch-up rates on high-density boards average three to seven percent across typical runs. That volume creates substantial latent reliability risks that buyers cannot defend during warranty disputes. Contracts must include specific terms that penalize unrecorded diagnostic overrides and strictly define how line fallout affects lot acceptance.
Section 8.3 of standard manufacturing service agreements establishes that any unit failing an automated test sequence must be quarantined immediately as non-conforming material until logged in the quality discrepancy system, voiding automatic second-stroke pass allowances and transferring full scrap financial liability to the manufacturer.