Modelling Prepreg Flow Behavior in Multilayer PCB Lamination
Modelling prepreg flow balances resin viscosity kinetics against copper fill volumes to accurately predict pressed dielectric thickness and prevent trace movement.


Melt
Lamination transforms a B-stage thermosetting resin matrix from a friable solid into a reactive liquid before cross-linking locks the glass-reinforced composite into a solid dielectric sheet. The thermal cycle drives this transition inside a multi-platen vacuum hydraulic press under strict thermal ramp rates and pressure profiles. Viscosity drops rapidly as the core temperature climbs past the glass transition boundary of the uncured resin.
This fluid state exists only for a restricted time window before polymerization accelerates the molecular weight beyond the gelation threshold.
Modelling prepreg flow requires capturing three distinct physical regimes across the thermal cycle: the initial thermal softening period, the minimum viscosity equilibrium window, and the rapid gelation phase. Viscosity decay during early heating follows an Arrhenius dependency until chemical cross-linking dominates the reaction dynamics. Empirical viscosity models combine kinetic conversion rates with temperature profile inputs to track fluid mechanics across time.
| Slash Sheet Designation | Glass Style Options | Nominal Resin Content (%) | Minimum Viscosity Range (Pa·s) | Viscosity Window below 100 Pa·s (s) | Nominal Gel Time Range at 171°C (s) |
|---|---|---|---|---|---|
| IPC-4101/21 (Standard FR-4) | 106, 1080, 2116, 7628 | 44 to 75 | 15 to 45 | 180 to 240 | 120 to 180 |
| IPC-4101/126 (High-Tg FR-4) | 1035, 1078, 2116, 3313 | 50 to 72 | 25 to 65 | 140 to 200 | 90 to 140 |
| IPC-4101/102 (High-Speed Low-Loss) | 1067, 1078, 2116, 3313 | 48 to 68 | 40 to 90 | 100 to 160 | 80 to 120 |
| IPC-4101/91 (Polyamide Rigid Matrix) | 1080, 2116, 7628 | 42 to 60 | 80 to 180 | 60 to 110 | 50 to 90 |
Press ramp rates typically range from 1.5°C to 3.5°C per minute under full vacuum below 50 torr absolute pressure. Selecting a high thermal ramp rate compresses the flow duration window while lowering the absolute minimum viscosity achieved by the resin. Conversely, slow ramp rates prolong the fluid phase but maintain a higher baseline viscosity, which risks incomplete micro-void filling within high-density copper features.
The minimum resin viscosity achieved during lamination drops by forty percent when the thermal ramp rate increases from two degrees to four degrees Celsius per minute.
Mathematical representations of this fluid domain rely on Modified Dual-Arrhenius kinetic equations. These formulations account for simultaneous thermal thinning and reaction-induced polymer chain propagation. Fabricators must tune these parameters against specific raw-material batch certificates to ensure numerical simulations match true press outcomes.
Failure to balance press temperature acceleration with vacuum pressure application causes premature matrix resin expulsion before air removal completes. Structural resin depletion leaves unbonded glass filaments, resulting in catastrophic internal delamination during downstream thermal stress testing.


Shear
Resin movement across internal copper topologies induces mechanical forces that act directly on etched circuit traces and glass weave bundles. Hydrodynamic forces driven by high pressure push liquid polymer horizontally from high-density pattern features toward open surface regions. Unconstrained lateral movement generates drag forces capable of displacing unanchored fine-line copper conductors.
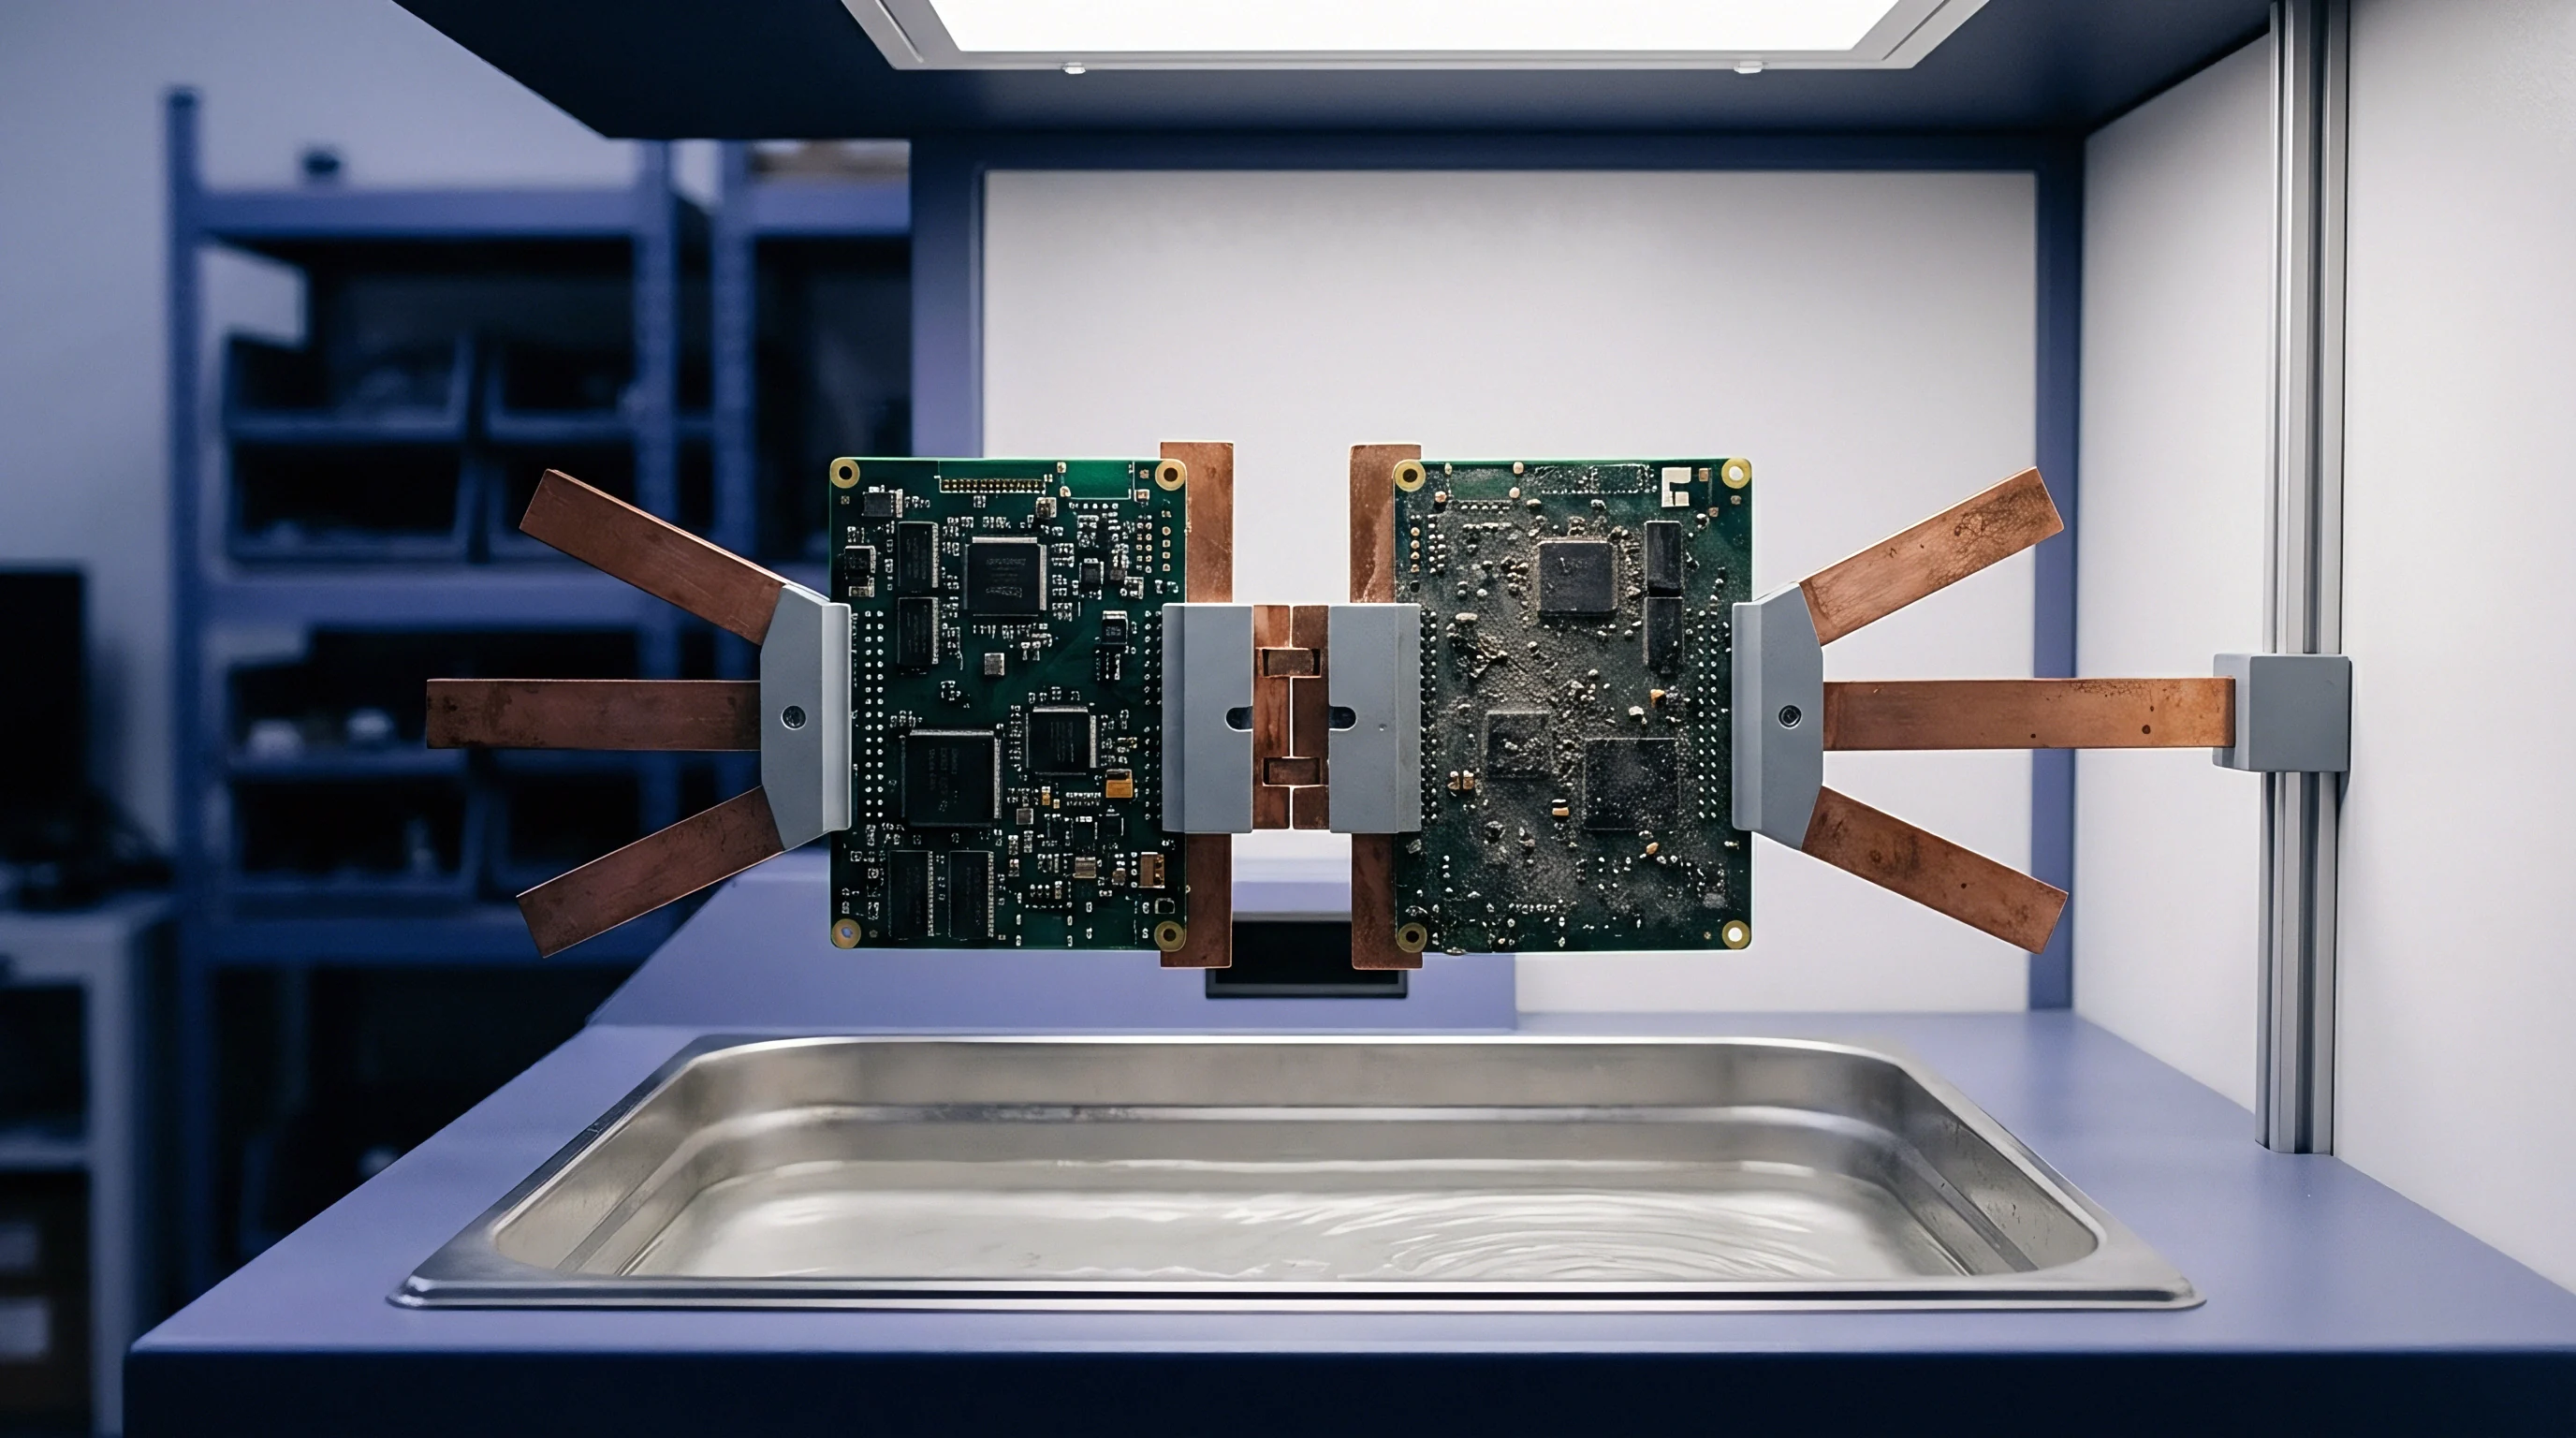
Hydrodynamic Stress Limits and Trace Displacement
Lateral fluid velocity profiles governed by Hele-Shaw flow assumptions reveal intense stress concentrations near narrow copper clearances. As prepreg compresses under hydraulic loads reaching 2.0 to 3.5 MPa, resin moves outward along paths of least hydraulic resistance. Fine signal traces measuring under 75 micrometers in width experience overturning moments when local shear stress exceeds the foil interface bond strength.
Woven glass styles directly modulate these internal stress gradients. Heavy weave fabrics like 7628 exert localized mechanical pressure against copper features, increasing trace distortion risks during compaction. Fine glass weaves like 1035 or 1067 distribute lateral hydraulic forces evenly, mitigating trace movement across high-aspect-ratio routing channels.
- Thermal Profile Calibration establishes the exact temperature timeline to optimize resin viscosity before full hydraulic pressure application.
- Vacuum System Evacuation lowers ambient pressure below 30 torr to prevent gas entrapment prior to resin liquefaction.
- Low-Pressure Kiss Stage allows initial prepreg softening without driving high-velocity resin displacement across fine conductors.
- Full Hydraulic Compaction applies final pressure when resin viscosity reaches its minimum working plateau.
- Isothermal Cure Dwell holds temperature above the ultimate glass transition point for seventy minutes to complete polymer cross-linking.
Modelling tools capture these dynamics by solving Navier-Stokes equations coupled with porous-media flow formulations representing the glass cloth matrix. The permeability tensor of the glass fabric dictates directional flow resistance, creating non-isotropic velocity vectors across the layer plane.
Copper feature density variations amplify localized shear differentials across large panel areas. Quadrants with sparse pattern coverage draw resin from adjacent high-density regions, inducing macro-scale thickness gradients across the finished panel.
Material suppliers frequently claim that standard datasheet viscosity values fully predict flow behavior in high-layer-count stackups. That explanation ignores the geometric flow resistance imposed by complex inner-layer copper topography and tight glass bundle compaction.


Fill
Complete encapsulation of internal copper features demands accurate volume balancing between available prepreg resin and pattern clearance gaps. Etched inner layers create internal relief zones where copper foil has been removed. Liquid resin must migrate vertically and laterally to occupy these vacant spaces before reaching gelation.

What Triggers Dielectric Thinning during High-Pressure Lamination?
Excessive hydraulic pressure applied during the minimum viscosity phase forces resin out of the central stackup zone into edge waste margins. This phenomenon, known as resin squeeze-out, reduces the dielectric isolation thickness between power and ground planes. Reduced spacing lowers line impedance and increases dielectric breakdown risk under high voltage conditions.
Calculations for dielectric layer thickness post-lamination require accounting for copper area ratios on adjacent inner layers. The residual copper percentage dictates the volume of resin required to yield a planar interface across the stack. Calculating final pressed thickness requires subtracting the volume needed for copper gap filling from the initial unpressed prepreg volume.
| Starting Copper Weight (oz / µm) | Etched Feature Depth (µm) | Residual Copper Coverage (%) | Resin Fill Volume Deficit (µm) | Calculated Thickness Loss per Interface (µm) |
|---|---|---|---|---|
| 0.5 oz (17.5 µm) | 18 | 20 | 14.4 | 7.2 |
| 0.5 oz (17.5 µm) | 18 | 80 | 3.6 | 1.8 |
| 1.0 oz (35.0 µm) | 35 | 30 | 24.5 | 12.25 |
| 1.0 oz (35.0 µm) | 35 | 70 | 10.5 | 5.25 |
| 2.0 oz (70.0 µm) | 70 | 40 | 42.0 | 21.0 |
Unfilled micro-cavities present severe reliability hazards in multilayer interconnects. Air pockets trapped adjacent to signal line edges initiate conductive anodic filament growth when exposed to humidity and electrical bias during field operation.
- Micro-Void Formation occurs when resin fails to displace gases within tight clearance gaps prior to gelation.
- Resin Starvation arises when adjacent copper patterns draw excessive resin away from low-density stackup zones.
- Wedge Defect Instability develops when asymmetric copper layout causes non-uniform resin flow and panel tilt.
- Blistering Failure results from moisture trapped in unfilled prepreg voids expanding during surface-mount soldering assemblies.
Numerical models map local copper pattern distribution from artwork CAD files onto finite element grids. The software calculates local resin depletion by balancing microscopic flow rates into trace channels against macroscopic prepreg compaction rates.
IPC-6012 Class 3 mandates that internal dielectric spacing between conductor layers shall not fall below thirty micrometers or thirty percent of the specified baseline distance.
Compliance with strict IPC standards demands pre-lamination validation of all thickness calculations. Fabrication drawings specifying target dielectrics without flow-adjusted calculations trigger engineering holds, delaying manufacturing release schedules.

Margin
Dimensional control of finished panel stackups dictates yield outcomes for controlled impedance circuits and microvia target alignment. Variations in prepreg flow behavior directly cause dielectric thickness dispersion across single manufacturing panels. Higher thickness variance forces fabricators to open electrical impedance acceptance windows on production drawings.

Stackup Architecture and Tolerance Accumulation
Variability in pressed prepreg thickness accumulates across multi-layer stackups, compounding dielectric tolerance stack-ups. A twenty-layer circuit board containing ten prepreg bonding layers amplifies minor batch-to-batch flow deviations into major panel thickness shifts. Microvia laser drilling depth settings rely on precise dielectric thickness control to hit internal land pads accurately.
Advanced numerical flow modeling minimizes panel margin requirements by predicting final layer positions across arbitrary stack geometries. Engineers adjust initial raw material prepreg thickness selections based on software flow predictions, closing the gap between designed parameters and real physical output.
| Layer Count and Stack Type | Flow Model Calibration Method | Dielectric Variation (± %) | Impedance Yield (%) | Registration Scrap Rate (%) |
|---|---|---|---|---|
| 8-Layer Standard Rigid | Static Datasheet Estimation | 8.5 | 93.2 | 1.4 |
| 8-Layer Standard Rigid | Dynamic Flow Model Derived | 3.1 | 99.1 | 0.2 |
| 18-Layer High-Density HDI | Static Datasheet Estimation | 14.2 | 78.5 | 6.8 |
| 18-Layer High-Density HDI | Dynamic Flow Model Derived | 4.6 | 96.8 | 0.9 |
| 32-Layer Backplane Board | Dynamic Flow Model Derived | 5.2 | 94.5 | 1.1 |
High-density interconnect designs feature microvias terminating on thin inner-layer pads. If resin flow models miscalculate dielectric compression by more than eight micrometers, laser drills risk over-penetrating target layers or under-drilling into glass fibers. Over-penetration breaks inner-layer signal integrity and causes structural plating failures within blind via barrels.
Panel utilization strategies must account for border resin loss. Edge waste zones exhibit higher resin flow velocity due to missing boundary constraints beyond the active panel circuit boundary. Trimming perimeter borders prevents non-uniform edge regions from entering final board dimensions.
Resin flow models must account for copper density distribution across all layers simultaneously rather than evaluating individual dielectric interfaces in isolation.


Calculus
Procurement operations for high-layer-count laminate materials rely on precise area calculations combined with yield-adjusted scrap allowances. Prepreg materials contribute up to forty percent of total raw bare-board material costs in complex HDI constructions. Miscalculating resin flow loss leads either to excessive material scrap or to starved laminates that fail factory quality audits.
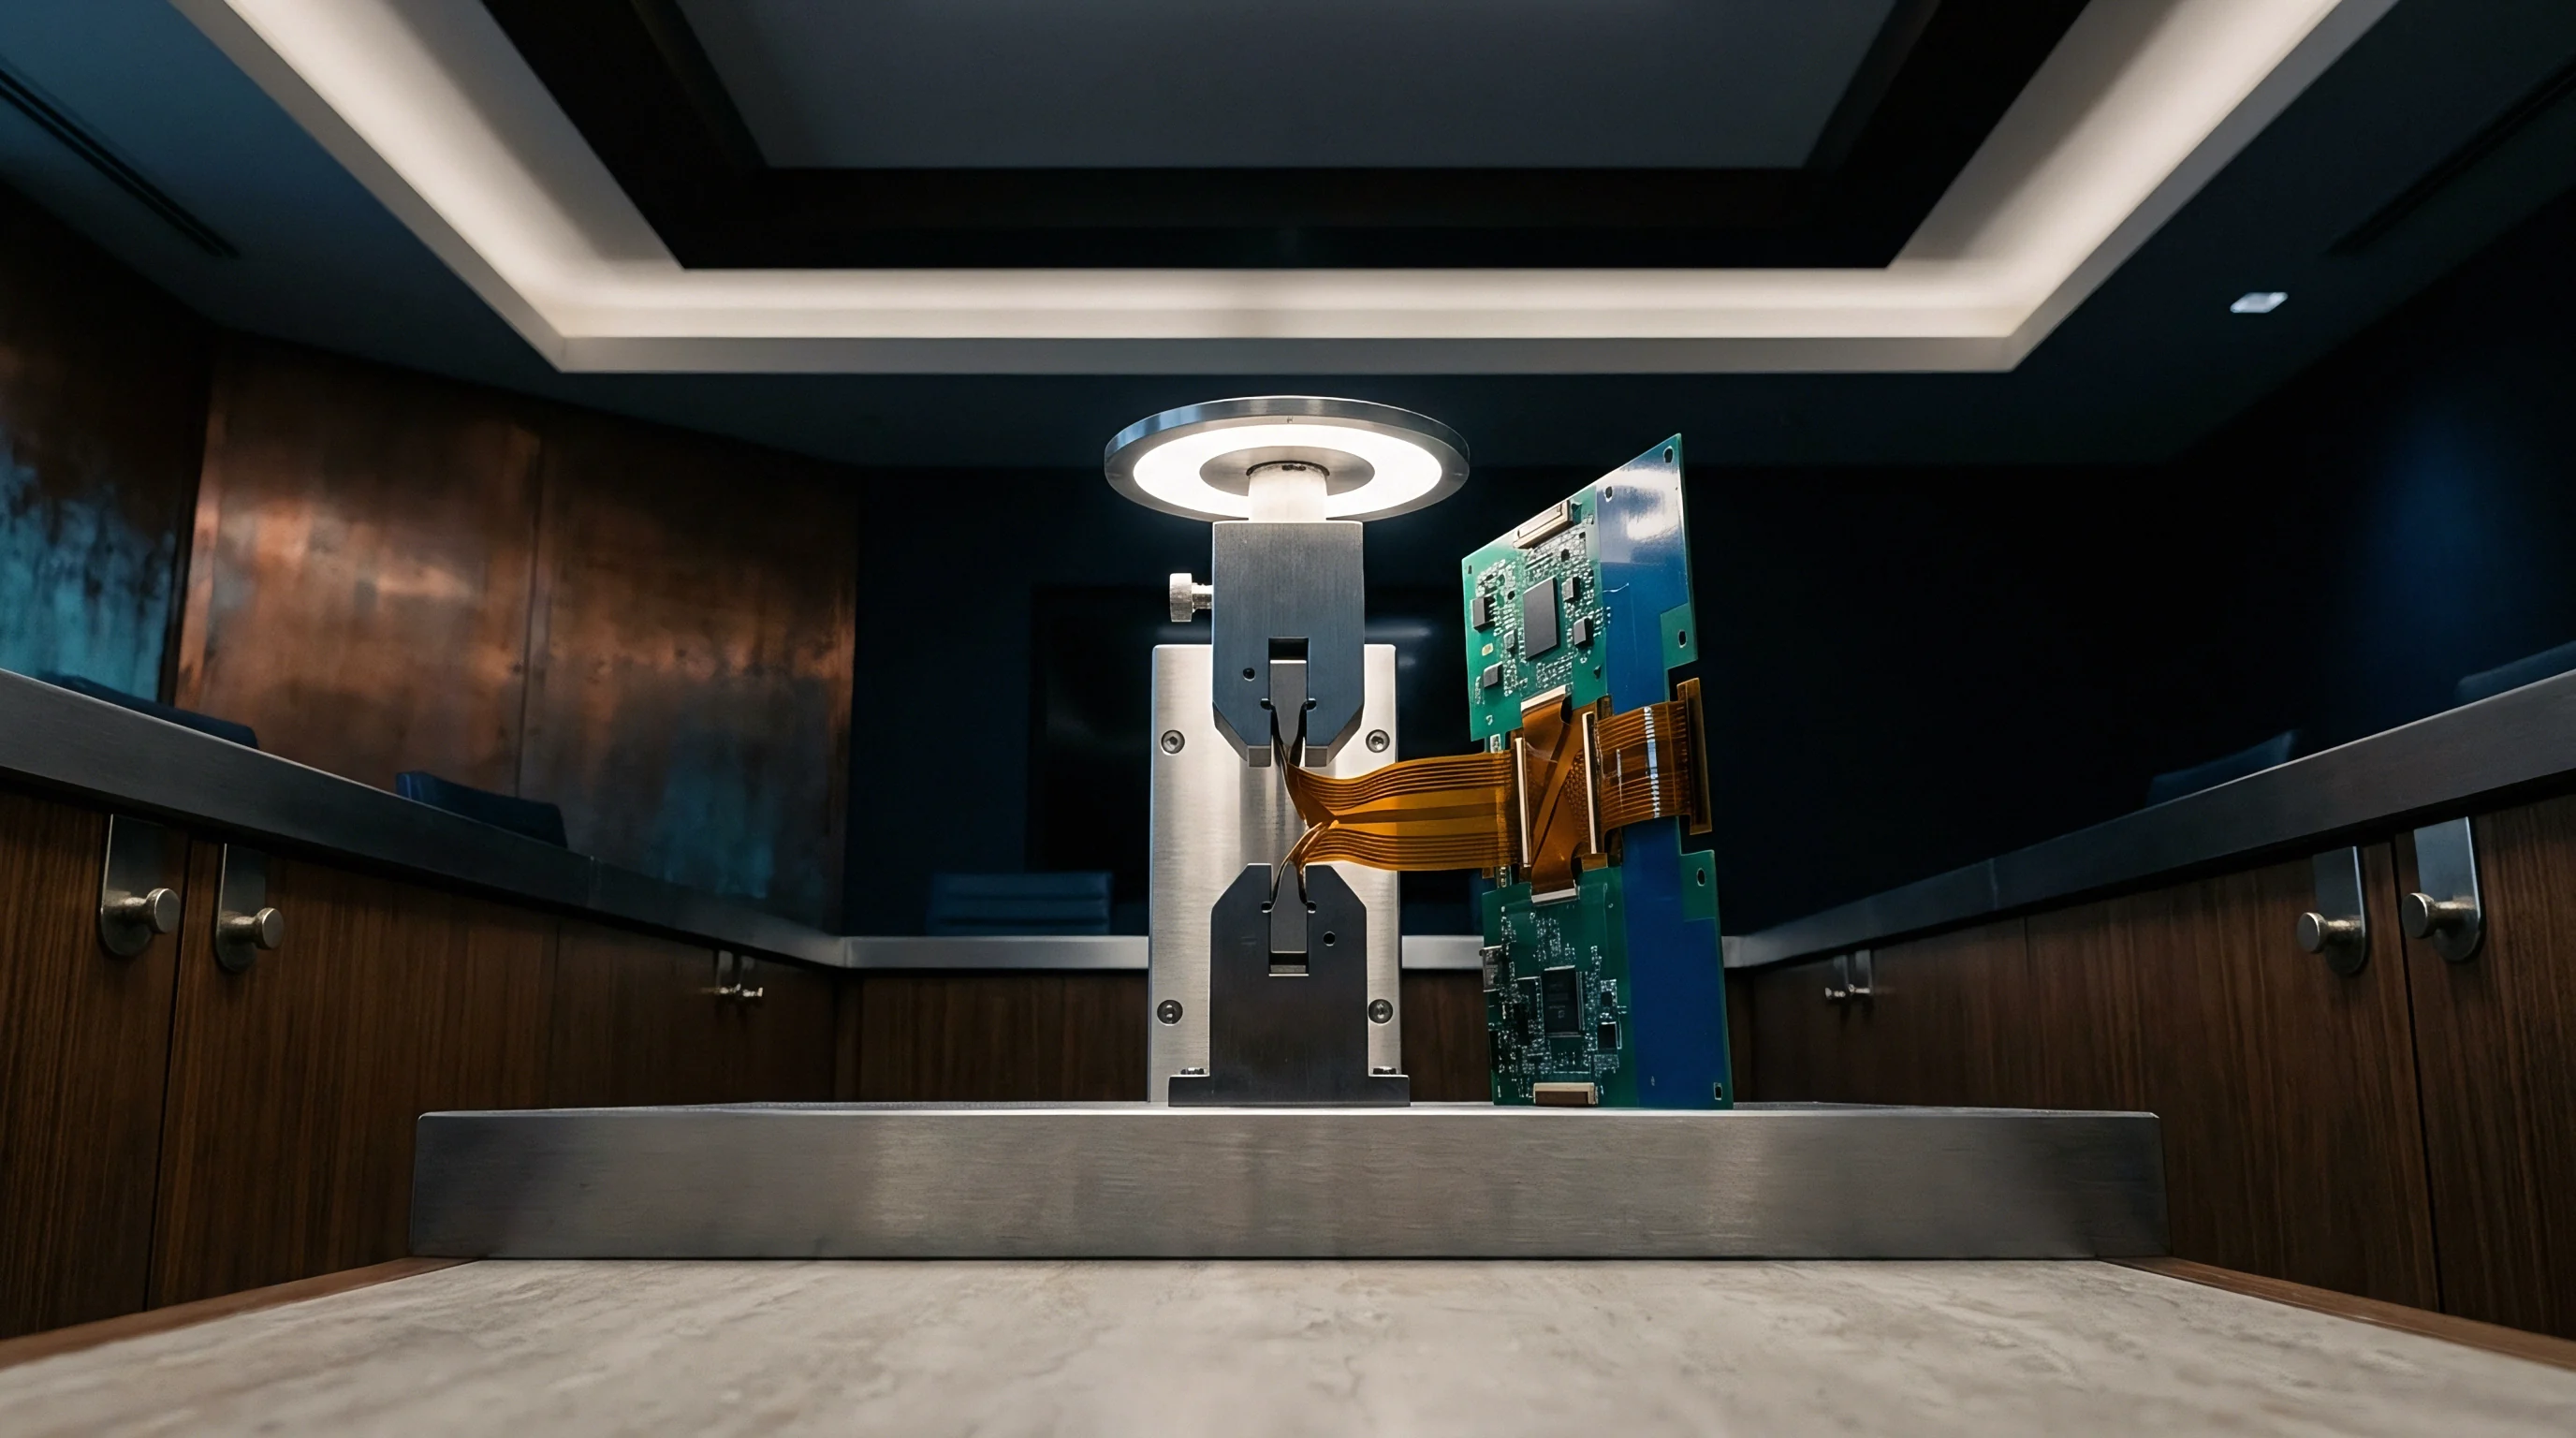
Worked Example of Area-Averaged Resin Volume Balancing
Consider an eighteen-layer HDI panel measuring 457 mm by 610 mm, yielding an overall panel surface area of 0.278. The build contains nine prepreg interlayers using glass style 1080 with an unpressed thickness of 75 micrometers per sheet and a nominal resin content of 65 percent by volume. The adjacent inner layers feature 1 oz copper (35 micrometers depth) with an average copper pattern density across the panel of 45 percent, leaving a 55 percent area void to be filled by resin flow.
The total volume of empty space created by etched copper features across one interface equals the panel area multiplied by the copper depth and the void fraction:
Clearance Volume = 0.278 m² × 0.000035 m × 0.55 = 0.00000535 m³ (5.35 cm³ per interface)
The total resin volume contained within a single sheet of 1080 prepreg prior to pressing equals:
Prepreg Resin Volume = 0.278 m² × 0.000075 m × 0.65 = 0.0001355 m³ (135.5 cm³ per sheet)
During press compaction, 5.35 cm³ of resin flows locally into the inner-layer copper voids. Simultaneously, perimeter squeeze-out accounts for a five percent volume loss (6.77 cm³) into the panel waste borders. The total resin volume consumed by fill mechanics and perimeter loss equals 12.12 cm³ per interface.
Subtracting this consumed volume from the initial prepreg resin volume yields a net remaining resin volume of 123.38 cm³. Dividing the remaining composite volume (glass matrix plus net resin) by the panel area establishes the final pressed dielectric thickness of 70.6 micrometers. This absolute 4.4 micrometer thickness reduction per layer alters line impedance calculations by 3.8 ohms if left uncorrected on the stackup drawing released to the shop floor.
- Define panel layout dimensions and derive total working panel area.
- Determine residual copper area coverage percentages from inner-layer Gerber files.
- Calculate copper pattern clearance void volume for every layer interface.
- Select baseline prepreg glass styles and raw resin content percentages.
- Apply rheological flow model to predict lateral edge squeeze-out volume loss.
- Calculate net pressed dielectric thickness per interface after flow equilibration.
- Verify final impedance and total board thickness tolerances prior to tooling release.
Accurate flow modeling eliminates empirical press trial cycles during NPI setup. Shop floor press trial iterations add panel scrap costs and delay engineering release schedules by multiple days. Predictive numerical simulation turns lamination setup into a deterministic engineering process.
Quantifying total landed costs requires evaluating material utilisation against yield loss risks. Over-specifying prepreg resin content to guarantee hole fill increases raw material spend without improving reliability. Optimizing prepreg selection via flow modeling maximizes panel yields while controlling raw composite procurement expenditures.
How far will emerging low-loss resin chemistries with non-Newtonian flow behavior force fabricators to redefine traditional empirical compaction models during high-frequency stackup design?